sidemap is a tool that provides an overview of a website via a graph representing all the paths accessible from one of its pages the others.
sidemap is made of Python, that why it is easy to install and use it on every platform. To install it, simply run:
git clone https://github.com/0cmenog/sidemap.git
cd sidemap && pip install -r requirements.txt
To run sidemap with the default values, fill the only required parameter:
python3 sidemap.py -u <yourStartingPage>
The starting page can be a URL, a hostname or a domain name.
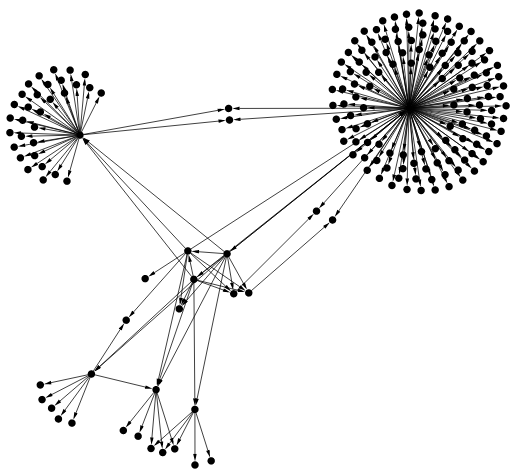
You can choose between a tree (--tree) or the default spring representation (--no-tree).
| (part of) tree | spring |
|---|---|
 |
 |
With the tree representation, you can adjust the edges' size to have a more horizontal tree (--xcoef) or a more vertical one (--ycoef).
| vanilla | --xcoef 4 |
--ycoef 4 |
|---|---|---|
 |
 |
 |
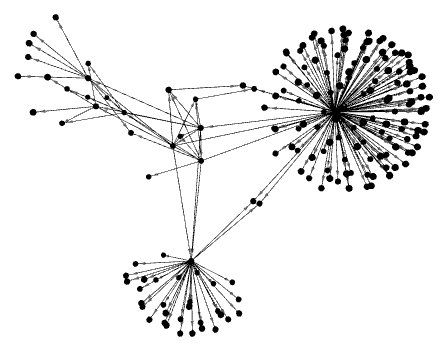
You can choose between a default 2 dimensions (--dimension 2) or 3 dimensions graph (--dimension 3).
--dimension 2 |
--dimension 3 |
|---|---|
 |
 |
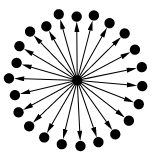
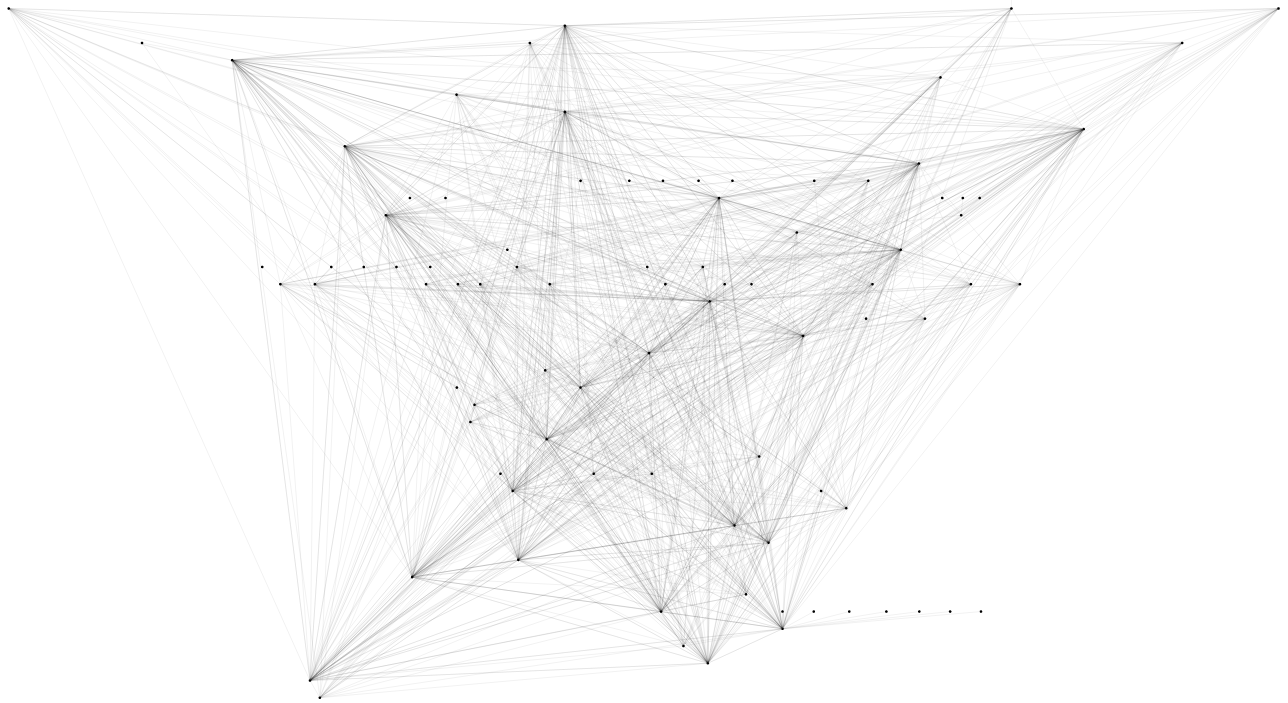
You can adjust the depth of your map depending of wether you need a long or short vision. The --depth option corresponds to the minimum number of hops between the starting node and its farthest node. A prudent value of 2 is set by default.
--depth 1 |
--depth 10 |
|---|---|
 |
 |
To avoid recalculation of the same graph data and take advantage of the different representations, you can store data (--cache-results) or use it (--cache-file). The cache files are stored under the cache/ folder.
Write cache file
python3 sidemap.py -u <startingPage> --cache-results
Use cache file
python3 sidemap.py -u <startingPage> --cache-file
To avoid some type of files in the graph data (eg. css files), you can use the option --banexts to add several extensions to the small predefined list containing png, jpg, jpeg, ico and svg.
Add css and js extensions to the list
python3 sidemap.py -u <startingPage> --banexts css js
In order to have a better understanding of what is currently going on, you can use the --verbose option.
Obviously, you can combine these options to make sidemap yours and have the most adapted graph for your needs. Below are some examples.
python3 sidemap.py -u <startPage> --dimension 2 --ycoef 4 --tree --cache-results --depth 10 -be css

python3 sidemap.py -u <startPage> --dimension 3 --cache-results --depth 2

python3 sidemap.py -u <startPage> --tree --ycoef 2 --cache-results --depth 2 --verbose

python3 sidemap.py -u <startPage> --dimension 3 --cache-file
The --help option allows to recap all the possibilities.
$ python3 sidemap.py --help
usage: sidemap.py [-h] -u URL [-d DEPTH] [-v | --verbose | --no-verbose] [-t | --tree | --no-tree] [-dim DIMENSION] [-x XCOEF] [-y YCOEF] [-be BANEXTS [BANEXTS ...]] [-cr | --cache-results | --no-cache-results]
                  [-cf | --cache-file | --no-cache-file]

options:
  -h, --help            show this help message and exit
  -u URL, --url URL     url of the siteweb to map
  -d DEPTH, --depth DEPTH
                        maximum hops from the given url
  -v, --verbose, --no-verbose
                        increases verbosity
  -t, --tree, --no-tree
                        displays tree graphs
  -dim DIMENSION, --dimension DIMENSION
                        dimensions of the graph (2d/3d)
  -x XCOEF, --xcoef XCOEF
                        x-axis node gap coefficient
  -y YCOEF, --ycoef YCOEF
                        y-axis node gap coefficient
  -be BANEXTS [BANEXTS ...], --banexts BANEXTS [BANEXTS ...]
                        additional extensions to ban
  -cr, --cache-results, --no-cache-results
                        puts the result in a cache file
  -cf, --cache-file, --no-cache-file
                        uses the appropriate cache file to load graph
The graph part is mainly built on top of Gravis. For more information about Gravis, please refer to the dependencies section.
The result graph is interactive and served in a browser tab. The window is thus divided into 3 parts: the graph, its attributes and a menu.
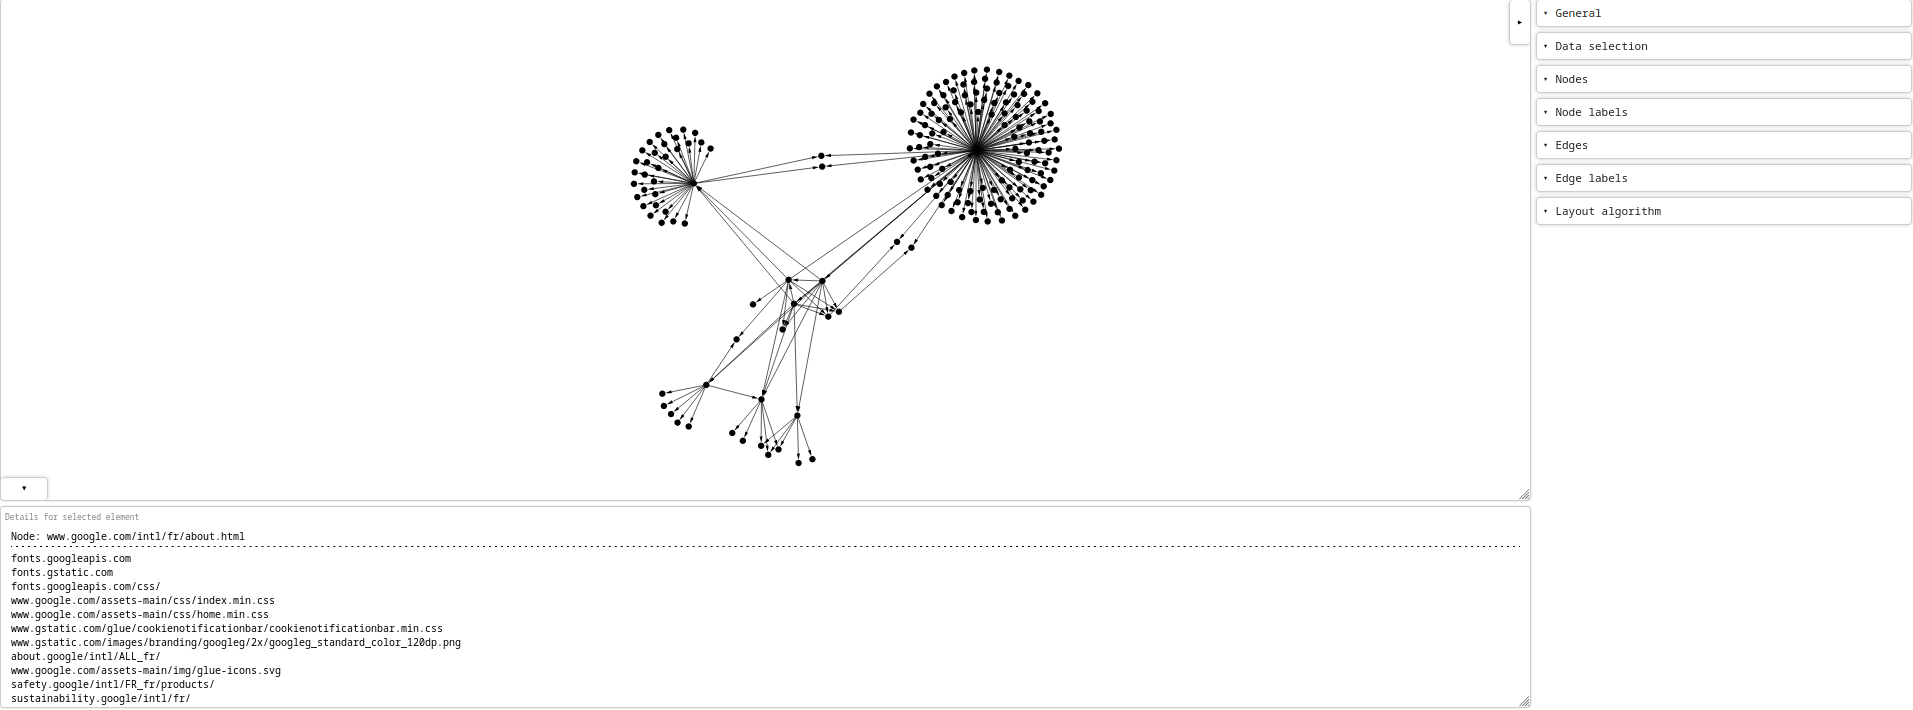
Nodes of the graph can be dragged and obey to the laws defined in the menu part. By clicking on nodes or edges, it will reveal their properties in the attributes part. It is possible to zoom in/out, move around and rotate (if 3d) the graph.
The attributes part can be hidden. It contains the properties of the selected element.
The menu can be hidden. It is a panel of settings to interactively adapt the graph. For example, from this menu, it is possible to hide/show labels, adapt nodes/edges size or adapt attraction laws between nodes.
Done:
- List all related pages in an unlinked node
- Manage cache files
- Manage depth
- Manage edge size
- Manage extensions to ban
- Put out of scope URL in the properties of the linked node
- Robust given URL parsing (URL encoding, URL parameters, hostname, domain name)
- Size of a node proportional to its total degree
Coming soon:
- Colouring node according to the extension
- Edge thickness proportional to the quantity of references between pages
- Option
--large/--no-largeto have nodes domain name/hostname related - Manage dots (
./and../) in the URL
Need more time:
- Automatically generated code documentation
- Loading bar
- POST and GET parameters keys added to the nodes' attributes
- Update regex to grab more than URL present in href attribute
- Manage redirections
The code still self-explanatory for now but a documentation is coming soon. If you want to contribute, simply submit a pull request by explaining the best as possible what you improve and how.
The dependencies are listed in the requirements.txt file. In particular, the graphs are managed by Gravis, which allows to create interactive 2d and 3d plots of graphs and networks.
This software is under the GPLv3 license. For more information, please refer to the LICENSE file.