by André Vargas (@andrevargas)
Gatsby is a site generator for React. It generates static builds with content from any kind of data sources. In order to create the static resources, it runs a build process using Node.js. Since it's a simple Node.js process, we can debug it using VS Code!
This guide shows how to use the built-in Node debugger to debug Gatsby build process only. If you are interested in debugging the app in runtime, take a look at the Debugging React apps guide.
- The latest version of VS Code installed.
- A project initialized with Gatsby CLI.
- Open your project folder in VS Code.
- Click on the Debug icon in the Activity Bar to switch to the Debug view.
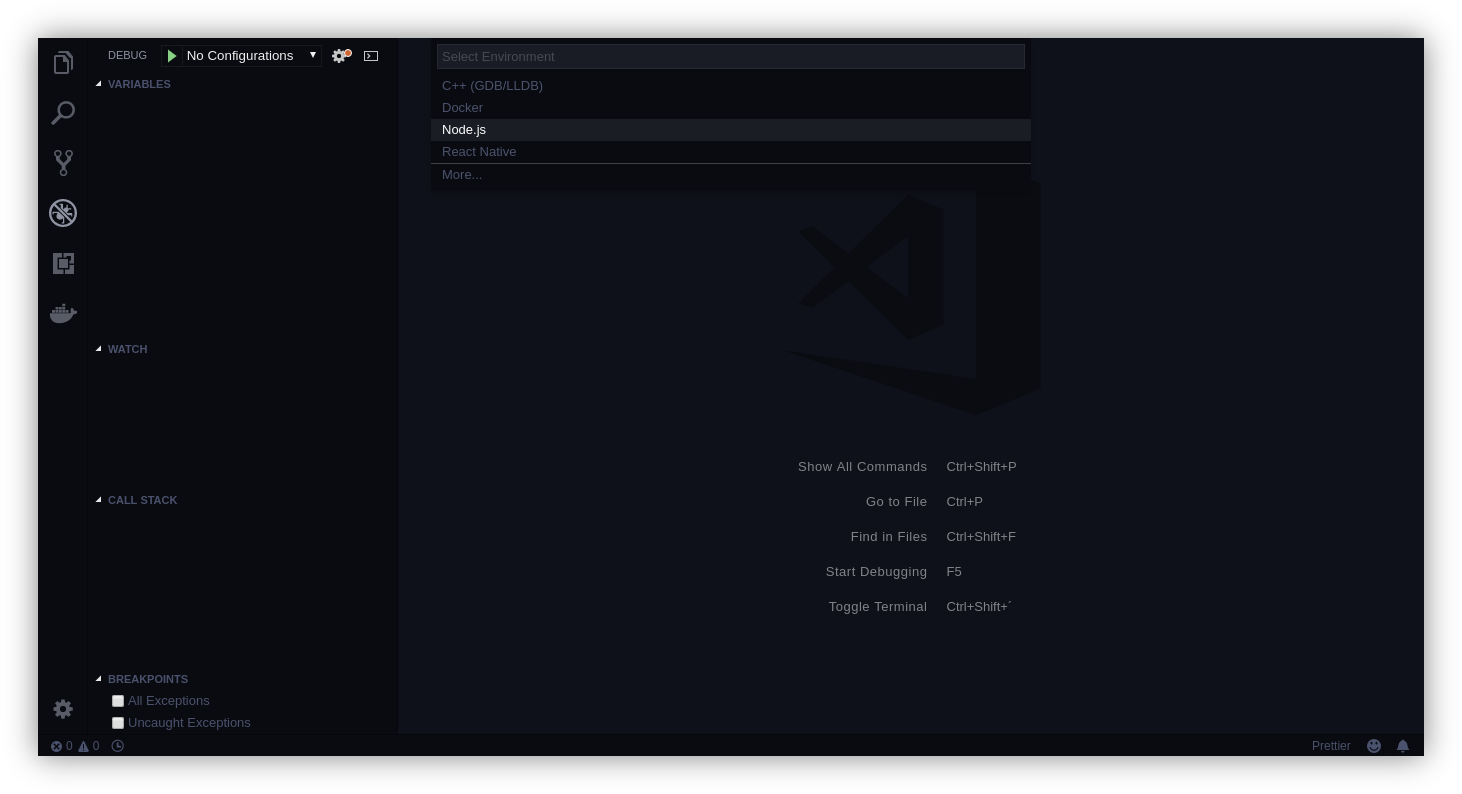
- Click on the gear ⚙ icon to create a
launch.jsonfile. - In the Select Environment input, select Node.js.
- Replace the content of the generated
launch.jsonfile with the following configuration:

{
  "version": "0.2.0",
  "configurations": [
    {
      "name": "Gatsby develop",
      "type": "node",
      "request": "launch",
      "program": "${workspaceRoot}/node_modules/gatsby/dist/bin/gatsby",
      "args": ["develop"],
      "stopOnEntry": false,
      "runtimeArgs": ["--nolazy"],
      "sourceMaps": false
    },
    {
      "name": "Gatsby build",
      "type": "node",
      "request": "launch",
      "program": "${workspaceRoot}/node_modules/gatsby/dist/bin/gatsby",
      "args": ["build"],
      "stopOnEntry": false,
      "runtimeArgs": ["--nolazy"],
      "sourceMaps": false
    }
  ]
}
This JSON file defines two configurations, one for
gatsby developcommand and another forgatsby buildcommand. The build process is executed in both commands, and both are debuggable.
Gatsby lets you configure the build process through the gatsby-node.js file in your project. Assuming you have written a custom logic in there, you can debug it just like any other Node application!
- Open the
gatsby-node.jsfile. - Put a breakpoint 🔴 anywhere in the file.
- Switch to the Debug view and select "Gatsby build" or "Gatsby develop" configuration.
- Press
F5or click on Start debugging (the green "play" button). - Tadaa! 🎉 Your breakpoint have been hit, and now you have full access to the variables and program flow.
