These instructions are considered experimental. They describe how to attach a Python debugger from VSCode to Blender, using a 3rd-party addon called blender-debugger-for-vscode.
-
If not already installed, download and install Visual Studio Code ("VSCode").
-
If not already installed, download and install Python 3.x. It includes a package manager named "pip" that should also be installed.
-
Open a new command shell and type
pip install debugpy. Debugpy is a Python debug server for VSCode, replacing an older tool called "ptvsd". (source code on GitHub) -
Launch VSCode, go to the "Extensions" tab, and install the
ms-python.pythonextension from the "recommended" list. (For more info see the market page). -
Remove the existing
scripts/addons/io_scene_gltf2folder from the Blender install folder, as this method will use the git source tree instead. -
In Blender -> Edit -> Preferences -> Interface -> Display, there is a checkbox for "Developer Extras." Turn that on.
-
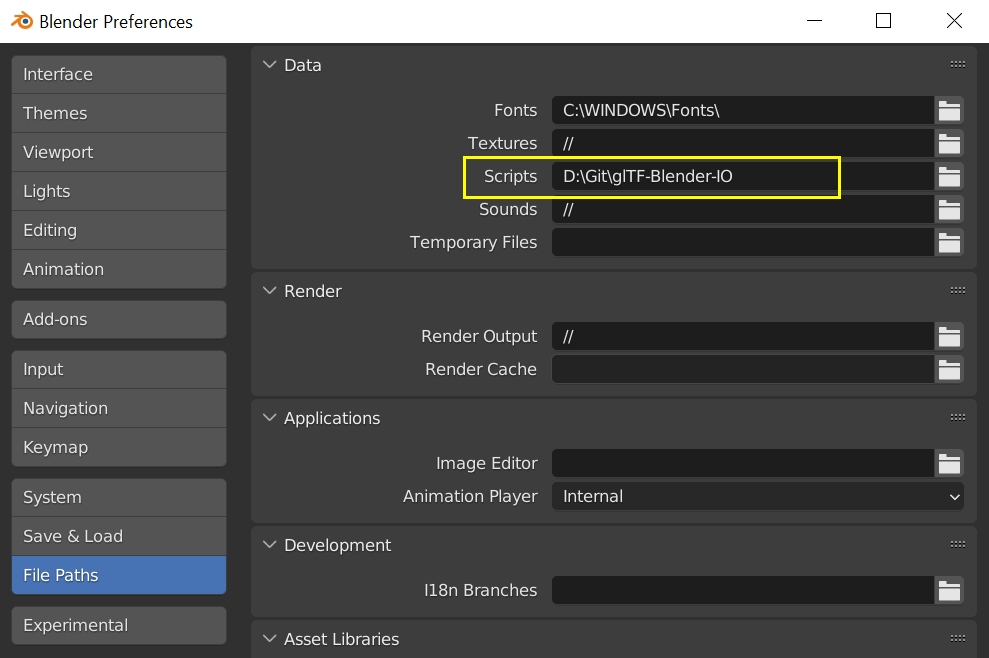
In Blender -> Edit -> Preferences -> File Paths, there is a blank entry for "Scripts" about 3rd from the top. Paste in the full path to the glTF-Blender-IO local git repository on your drive. Save the preferences.
-
Download the blender-debugger-for-vscode addon. Place it in the addons/ folder of the glTF-Blender-IO git repository. By installing the debugging addon there, instead of in the default Blender addons directory, you'll be able to keep it installed when upgrading Blender later.
-
In Blender -> Edit -> Preferences -> Add-ons, search for the word "Debug", and enable the addon "Development: Debugger for VS Code". It should automatically pick up the location of where debugpy was installed on this panel. Save the preferences.
-
Quit and re-start Blender. Make sure the glTF import/export options are available, indicating the addon is running from the new location.
-
In Blender, press F3 to bring up the tools search window. Search for the word "Debug", and then click "Debug: Start Debug Server for VS Code."
-
In VSCode, with the glTF-Blender-IO folder opened, press F5 or choose "Start Debugging" from the Debug menu.
If both actions happen within 20 seconds or so, you may see a console message in VSCode saying "Debugger is attached." If not, it may have just silently worked, but you can check: Go back to Blender and find the tool "Debug: Check if VS Code is Attached" and run that. It should also produce the "Debugger is Attached" message.
Look for a line in __init__.py at the end of def invoke that looks like this:
return ExportHelper.invoke(self, context, event)
Try placing a breakpoint on this line by clicking to the left of the line number, to place a red dot there. Then, in Blender, go to File -> Export -> glTF. Blender's entire UI should immediately lock up, and VSCode should show the execution halted on the breakpoint.
Once a breakpoint is hit, you can inspect the call stack in the left window, and interrogate local variables with the DEBUG CONSOLE window at the bottom.
See the documentation and video included with blender-debugger-for-vscode for additional capabilities not covered here.
In VSCode, the far-right icon on the debug toolbar is a red square with a disconnected plug, with a "Disconnect" tool-tip. Clicking this will detach the debugger and let Blender continue. The debugpy server is likely still running for the remainder of the Blender session, so you can re-attach by asking VSCode to launch the debugger again.
