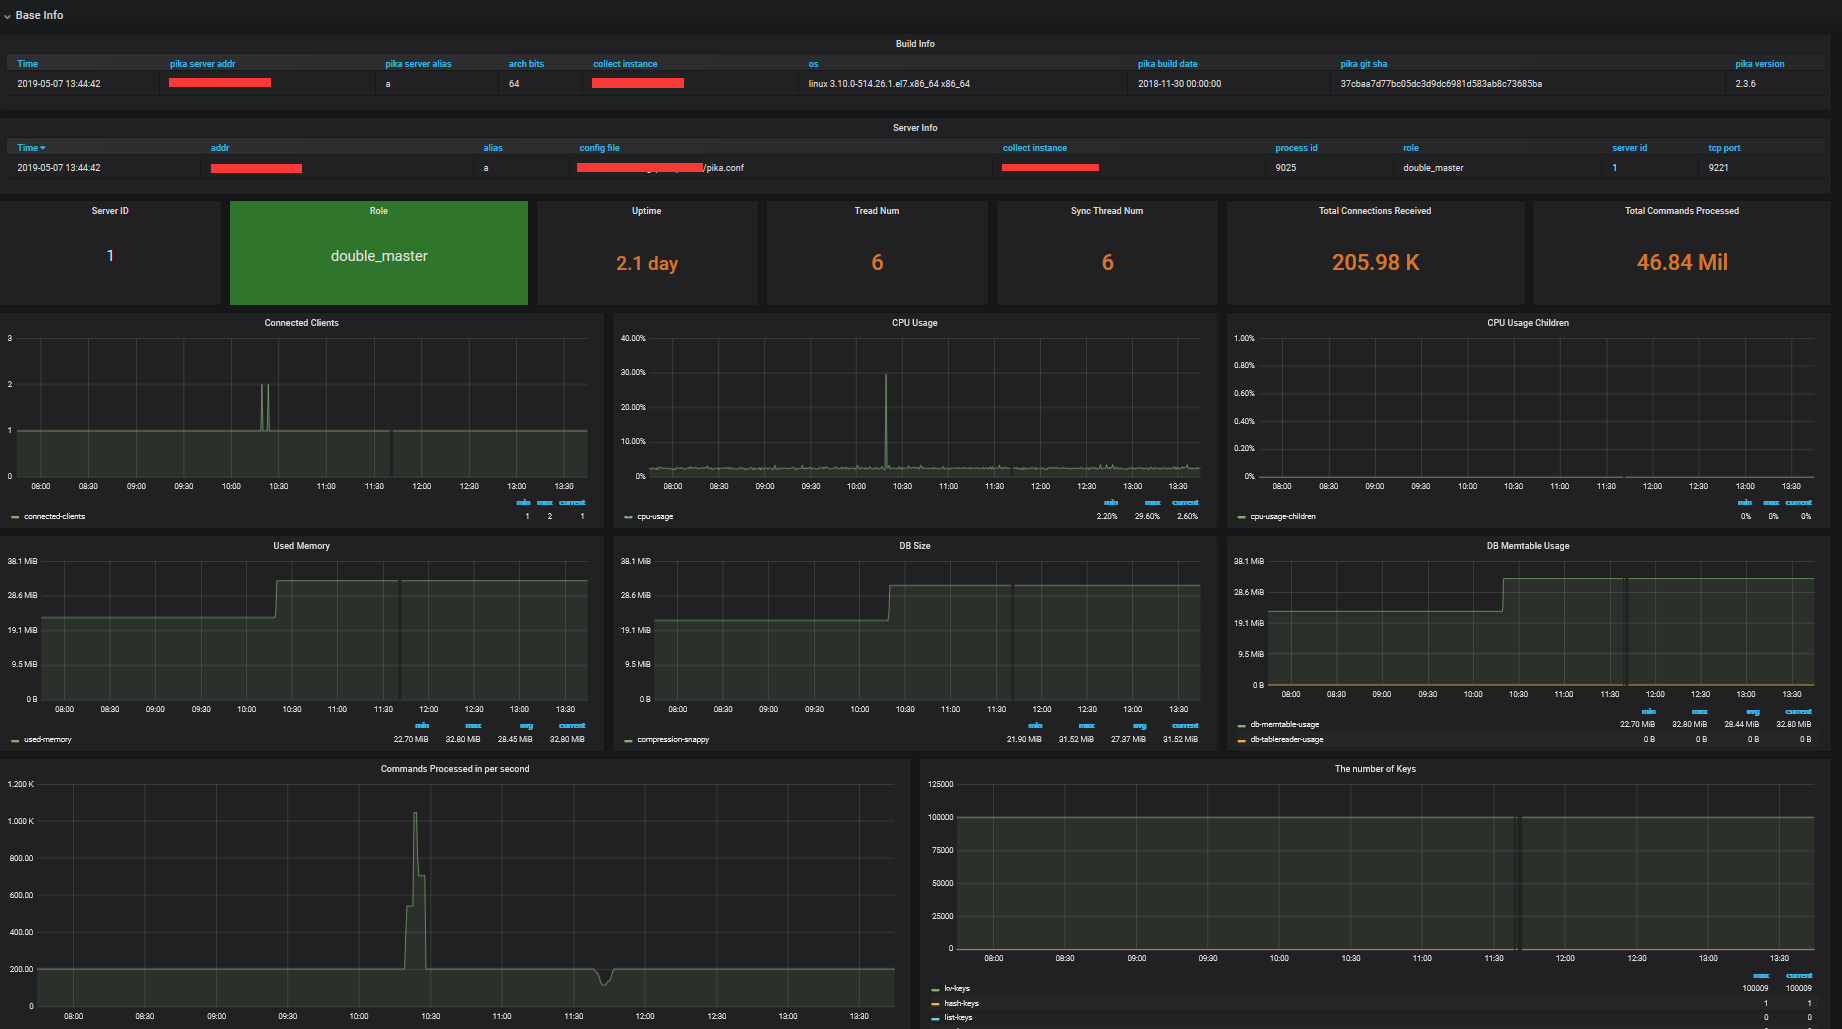
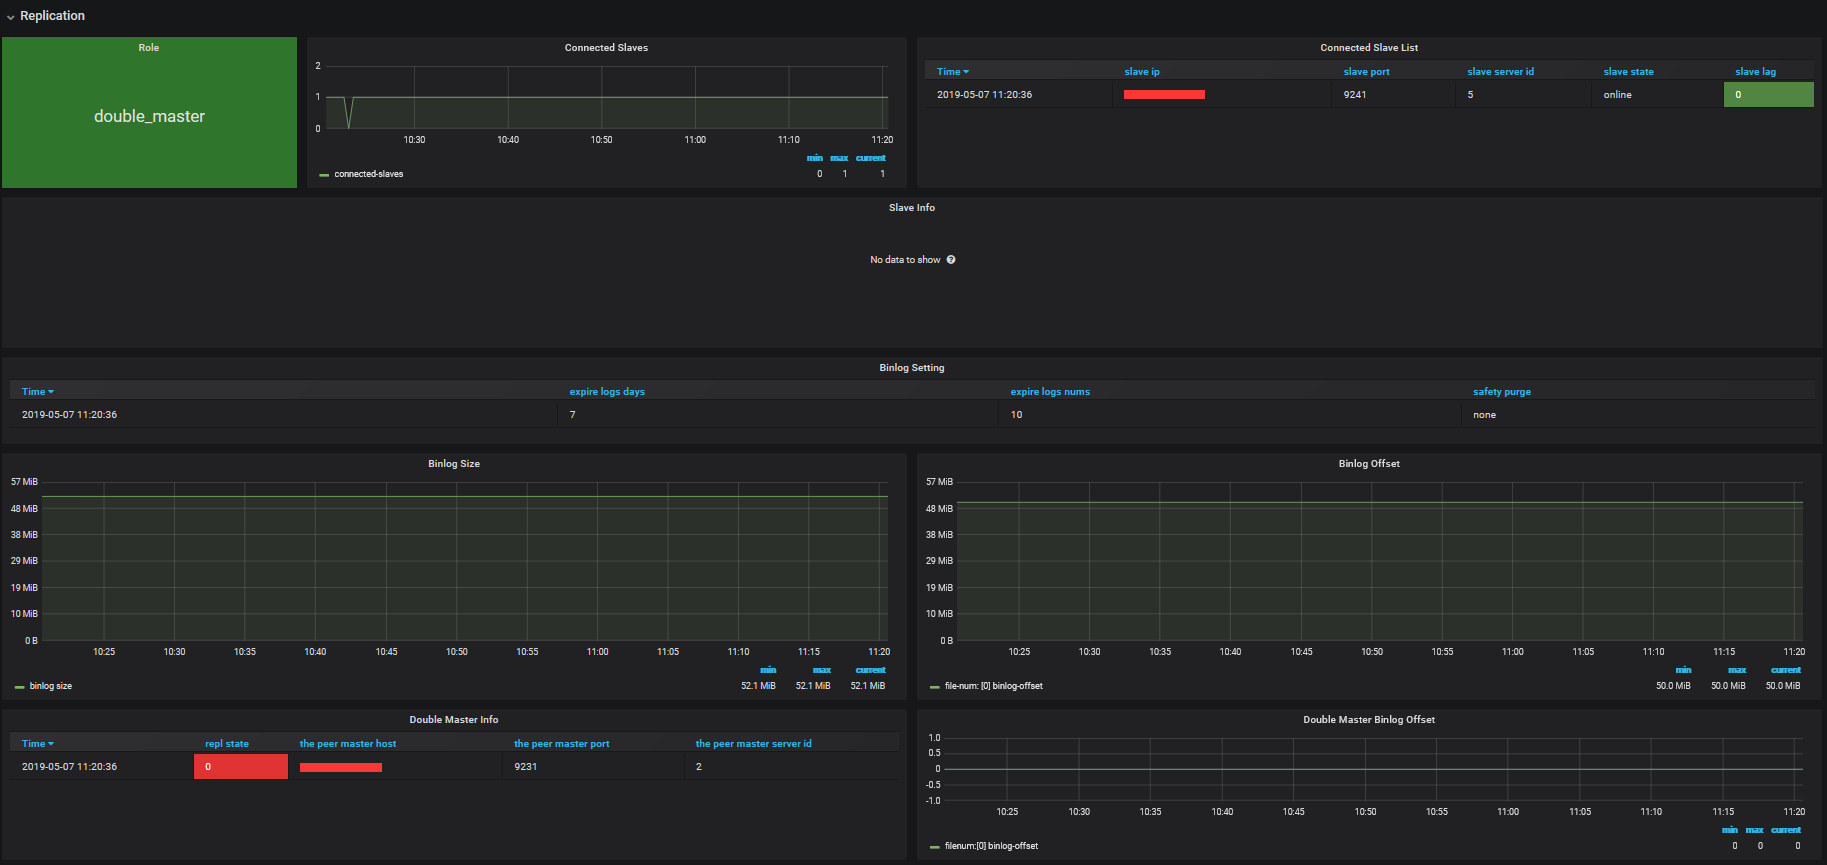
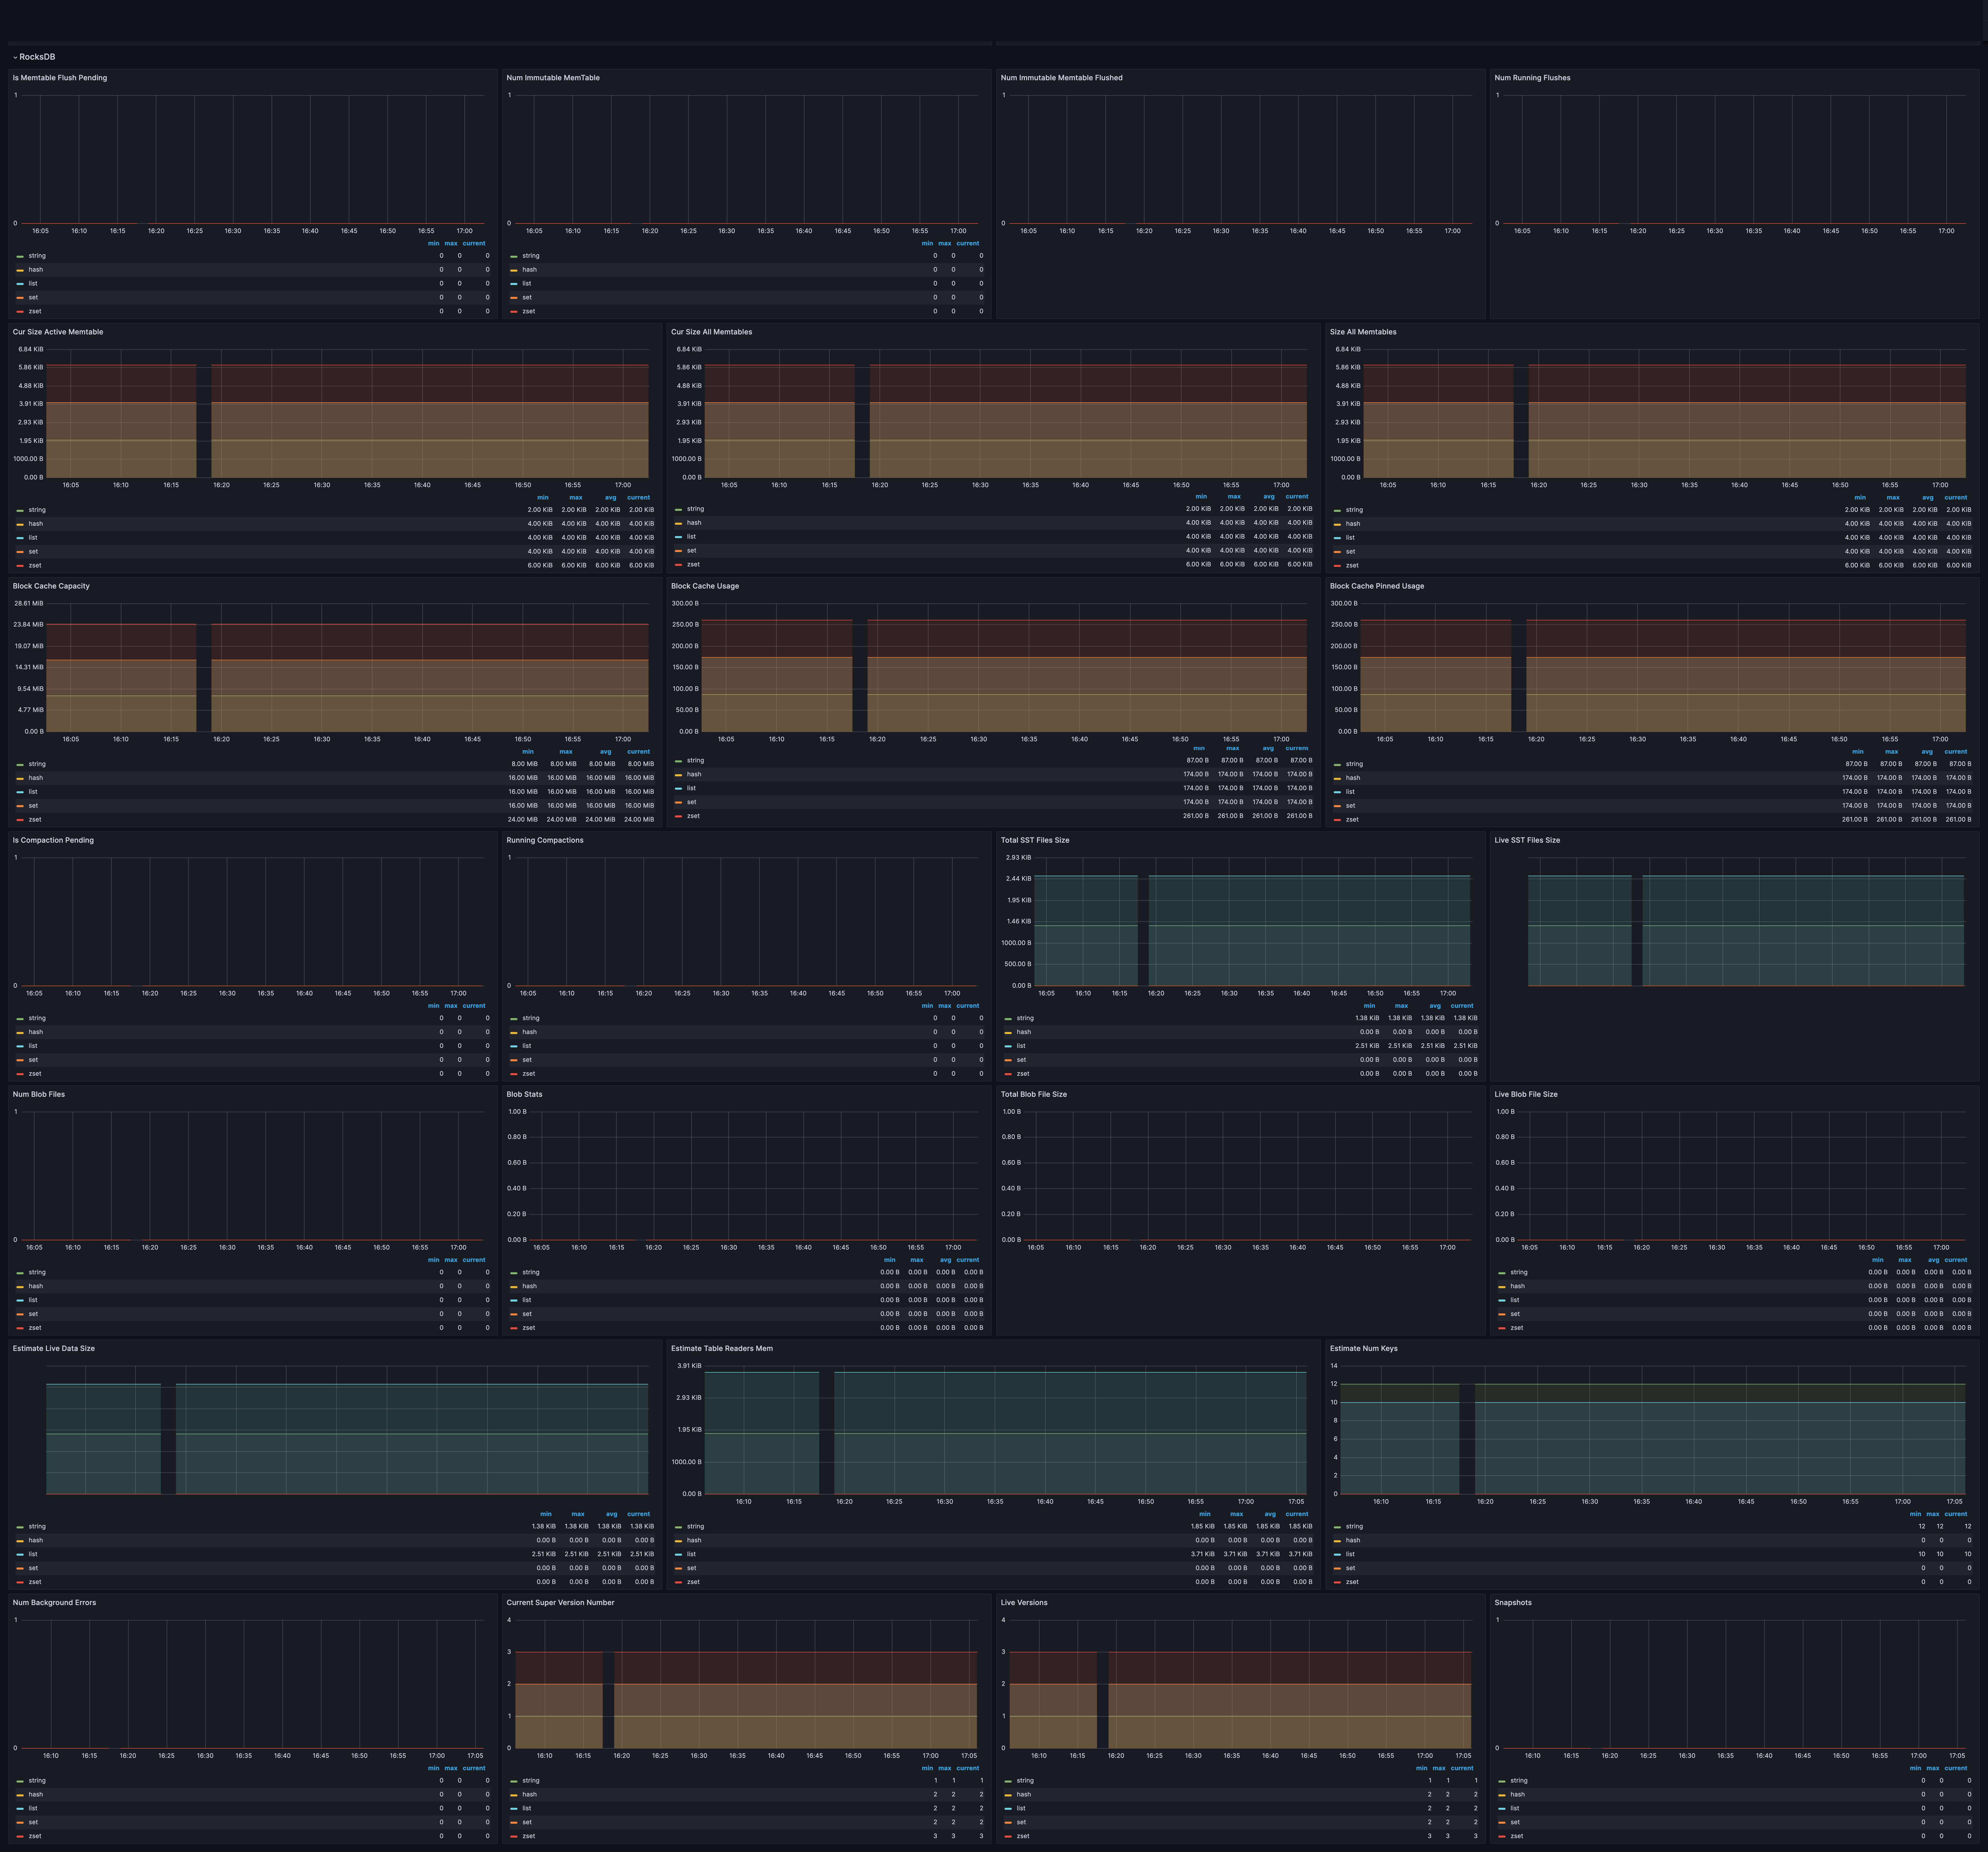
Prometheus exporter for nosql Qihoo360/pika metrics.
Pika-Exporter is based on Redis-Exporter
Build and run locally:
To start using pika_exporter, install Go and run go get
$ go get github.com/OpenAtomFoundation/pika/tools/pika_exporter
$ cd $GOPATH/src/github.com/OpenAtomFoundation/pika/tools/pika_exporter
$ make
$ ./bin/pika_exporter <flags>
For example:
$ nohup ./bin/pika_exporter -pika.addr 127.0.0.1:9221 &Prometheus Configuration:
Add a block to the scrape_configs of your prometheus.yml config file:
scrape_configs:
  - job_name: pika
    scrape_interval: 15s
    static_configs:
      - targets: ['127.0.0.1:9121']
        labels:
          group: 'test'
Run prometheus:
prometheus --config.file=./grafana/prometheus.yml| Name | Environment Variables | Default | Description | Example |
|---|---|---|---|---|
| pika.host-file | PIKA_HOST_FILE | Path to file containing one or more pika nodes, separated by newline. NOTE: mutually exclusive with pika.addr.Each line can optionally be comma-separated with the fields <addr>,<password>,<alias>. See here for an example file. |
--pika.host-file ./pika_hosts_file.txt | |
| pika.addr | PIKA_ADDR | Address of one or more pika nodes, separated by comma. | --pika.addr 192.168.1.2:9221,192.168.1.3:9221 | |
| pika.password | PIKA_PASSWORD | Password for one or more pika nodes, separated by comma. | --pika.password 123.com,123.com | |
| pika.alias | PIKA_ALIAS | Pika instance alias for one or more pika nodes, separated by comma. | --pika.alias a,b | |
| namespace | PIKA_EXPORTER_NAMESPACE | pika | Namespace for metrics | --namespace pika |
| keyspace-stats-clock | PIKA_EXPORTER_KEYSPACE_STATS_CLOCK | -1 | Stats the number of keys at keyspace-stats-clock o'clock every day, in the range [0, 23]. If < 0, not open this feature. | --keyspace-stats-clock 0 |
| check.key-patterns | PIKA_EXPORTER_CHECK_KEY_PARTTERNS | Comma separated list of key-patterns to export value and length/size, searched for with SCAN. | --check.key-patterns db0=test*,db0=abc | |
| check.keys | PIKA_EXPORTER_CHECK_KEYS | Comma separated list of keys to export value and length/size. | --check.keys abc,test,wasd | |
| check.scan-count | PIKA_EXPORTER_CHECK_SCAN_COUNT | 100 | When check keys and executing SCAN command, scan-count assigned to COUNT. | --check.scan-count 200 |
| web.listen-address | PIKA_EXPORTER_WEB_LISTEN_ADDRESS | :9121 | Address to listen on for web interface and telemetry. | --web.listen-address ":9121" |
| web.telemetry-path | PIKA_EXPORTER_WEB_TELEMETRY_PATH | /metrics | Path under which to expose metrics. | --web.telemetry-path "/metrics" |
| log.level | PIKA_EXPORTER_LOG_LEVEL | info | Log level, valid options: panic fatal error warn warning info debug. |
--log.level "debug" |
| log.format | PIKA_EXPORTER_LOG_FORMAT | json | Log format, valid options: txt json. |
--log.format "json" |
| version | false | Show version information and exit. | --version |
| Metrics Name | Metric Type | Labels | Metrics Value | Metric Desc |
|---|---|---|---|---|
| namespace_build_info | Gauge |
{addr="", alias="", "os"="", "arch_bits"="", "pika_version"="", "pika_git_sha"="","pika_build_compile_date"=""} | 1 | pika binary file build info |
| namespace_server_info | Gauge |
{addr="", alias="", "process_id"="", "tcp_port"="", "config_file"="", "server_id"="", "role"=""} | 1 | pika instance's info, the label role is the role in replication info |
| namespace_uptime_in_seconds | Gauge |
{addr="", alias=""} | the value of uptime_in_seconds |
pika instance's uptime in seconds |
| namespace_thread_num | Gauge |
{addr="", alias=""} | the value of thread_num |
pika instance's thread num |
| namespace_sync_thread_num | Gauge |
{addr="", alias=""} | the value of sync_thread_num |
pika instance's thread num for syncing |
| Metrics Name | Metric Type | Labels | Metrics Value | Metric Desc |
|---|---|---|---|---|
| namespace_db_size | Gauge |
{addr="", alias="", "compression"=""} | the value of db_size |
total db data size (in bytes) of the pika instance, statistics of all files under the configured db-path |
| namespace_log_size | Gauge |
{addr="", alias=""} | the value of log_size |
total log data size (in bytes) of the pika instance, statistics of all files under the configured log-path witch contains INFO, WARNING, ERROR logs and binlog (write2fine) files for synchronization |
| namespace_used_memory | Gauge |
{addr="", alias=""} | the value of used_memory |
total used memory size (in bytes) of the pika instance |
| namespace_db_memtable_usage | Gauge |
{addr="", alias=""} | the value of db_memtable_usage |
total memtable used memory size (in bytes) of the pika instance |
| namespace_db_tablereader_usage | Gauge |
{addr="", alias=""} | the value of db_tablereader_usage |
total tablereader used memory size (in bytes) of the pika instance |
| (new)namespace_db_fatal | Gauge |
{addr="", alias=""} | the value of db_fatal |
the metrics value: 1 means errors occurred, 0 means no error |
| Metrics Name | Metric Type | Labels | Metrics Value | Metric Desc |
|---|---|---|---|---|
| namespace_connected_clients | Gauge |
{addr="", alias=""} | the value of connected_clients |
total count of connected clients in pika instance |
| Metrics Name | Metric Type | Labels | Metrics Value | Metric Desc |
|---|---|---|---|---|
| namespace_total_connections_received | Counter |
{addr="", alias=""} | the value of total_connections_received |
total count of received connections from clients in pika instance |
| namespace_instantaneous_ops_per_sec | `Gauge | {addr="", alias=""} | the value of instantaneous_ops_per_sec |
the count of prcessed operations in per seconds by pika instance |
| namespace_total_commands_processed | Counter |
{addr="", alias=""} | the value of total_commands_processed |
total count of processed commands in pika instance |
| namespace_is_bgsaving | Gauge |
{addr="", alias=""} | 0 or 1 | the metrics value: 1 means bgsave is in progress, 0 means bgsave is not in progress |
| namespace_is_scaning_keyspace | Gauge |
{addr="", alias=""} | 0 or 1 | the metrics value: 1 means the keyspace is scanning, 0 means not scanning |
| namespace_compact | Gauge |
{addr="", alias="", compact_cron"="", "compact_interval":""} | 0 or 1 | the metrics value: 1 means compact is in progress, 0 means compact is not in progress |
| Metrics Name | Metric Type | Labels | Metrics Value | Metric Desc |
|---|---|---|---|---|
| namespace_command_exec_count | Counter |
{addr="", alias="", "command"=""} | the value of the command executed count | the count of each command executed in pika instance |
| Metrics Name | Metric Type | Labels | Metrics Value | Metric Desc |
|---|---|---|---|---|
| namespace_used_cpu_user_children | Counter |
{addr="", alias=""} | the value of used_cpu_user_children |
total user CPU usage time (in seconds) of pika children instance |
| namespace_used_cpu_user | Counter |
{addr="", alias=""} | the value of used_cpu_user |
total user CPU usage time (in seconds) of pika instance |
| namespace_used_cpu_sys_children | Counter |
{addr="", alias=""} | the value of used_cpu_sys_children |
total system CPU usage time (in seconds) of pika children instance |
| namespace_used_cpu_sys | Counter |
{addr="", alias=""} | the value of used_cpu_sys |
total system CPU usage time (in seconds) of pika instance |
| Metrics Name | Metric Type | Labels | Metrics Value | Metric Desc |
|---|---|---|---|---|
| namespace_connected_slaves | Gauge |
{addr="", alias=""} | the value of connected_slaves |
the count of connected slaves, when pika instance's role is master |
| (no exists)namespace_partition_slave_lag | Gauge |
{addr="", alias="", "slave_conn_fd"="", slave_ip"="", "slave_port"="", "partition"=""} | parse master slave info's lag |
the binlog lag of all slaves of the pika instance |
| namespace_master_link_status | Gauge |
{addr="", alias="", "master_host"="", "master_port"=""} | 0 or 1 | connection state between slave and master(1 means all partitions sync ok), when pika instance's role is slave |
| namespace_slave_read_only | Gauge |
{addr="", alias="", "master_host"="", "master_port"=""} | 0 or 1 | is slave read only, when pika instance's role is slave |
| namespace_slave_priority | Gauge |
{addr="", alias="", "master_host"="", "master_port"=""} | the value of slave_priority |
slave priority, when pika instance's role is slave |
| (no exists)namespace_partition_repl_state | Gauge |
{addr="", alias="", "master_host"="", "master_port"="", "partition"="", "repl_state"=""} | 0 | sync connection state between slave and master for each partition, when pika instance's role is slave |
| (no exists)namespace_db_binlog_offset_filenum | Gauge |
{addr="", alias="", "db"=""} | the value of binlog_offset filenum each db |
binlog file num for each db |
| (no exists)namespace_db_binlog_offset | Gauge |
{addr="", alias="", "db"="", "safety_purge"=""} | the value of binlog_offset offset each db |
binlog offset for each db |
| (new)namespace_db_consensus_last_log | Gauge |
{addr="", alias="", "db"="", "last_log"=""} | the value of consensus last_log each db |
consensus last_log for each db when consensus-level is enabled |
| Metrics Name | Metric Type | Labels | Metrics Value | Metric Desc |
|---|---|---|---|---|
| (new)namespace_keyspace_last_start_time | Gauge |
{addr="", alias=""} | the value of Keyspace Time convert to unix seconds |
the start time(unix seconds) of the last statistical keyspace |
| namespace_keys | Gauge |
{addr="", alias="", "db"="", "type"=""} | the value of keys |
total count of the key-type keys for each db |
| namespace_expire_keys | Gauge |
{addr="", alias="", "db"="", "type"=""} | the value of expire_keys |
total count of the key-type expire keys for each db |
| namespace_invalid_keys | Gauge |
{addr="", alias="", "db"="", "type"=""} | the value of invalid_keys |
total count of the key-type invalid keys for each db |
| Serial Number | Metric | Meaning |
|---|---|---|
| 11 | rocksdb.num-immutable-mem-table | Number of immutable memtables not yet flushed. |
| 12 | rocksdb.num-immutable-mem-table-flushed | Number of immutable memtables that have been flushed. |
| 13 | rocksdb.mem-table-flush-pending | Returns 1 if there is a pending memtable flush; otherwise returns 0. |
| 14 | rocksdb.num-running-flushes | Number of currently running flush operations. |
| 15 | rocksdb.compaction-pending | Returns 1 if at least one compaction operation is pending; otherwise returns 0. |
| 16 | rocksdb.num-running-compactions | Number of running compactions. |
| 17 | rocksdb.background-errors | Total number of background errors. |
| 18 | rocksdb.cur-size-active-mem-table | Approximate size, in bytes, of the active memtable. |
| 19 | rocksdb.cur-size-all-mem-tables | Total size in bytes of memtables not yet flushed, including the current active memtable and the unflushed immutable memtables. |
| 20 | rocksdb.size-all-mem-tables | Total size in bytes of all memtables, including the active memtable, unflushed immutable memtables, and pinned immutable memtables. |
| 25 | rocksdb.estimate-num-keys | Estimated number of keys in active memtable, unflushed immutable memtables, and flushed SST files. |
| 26 | rocksdb.estimate-table-readers-mem | Estimated memory size used for reading SST files, excluding block cache (such as filter and index blocks). |
| 28 | rocksdb.num-snapshots | Number of unreleased snapshots in the database. |
| 31 | rocksdb.num-live-versions | Number of current versions. More current versions usually indicate more SST files being used by iterators or incomplete compactions. |
| 32 | rocksdb.current-super-version-number | Current number of the LSM version. It is a uint64_t integer that increments after any changes in the LSM tree. This number is not preserved after restarting the database and starts from 0 after a database restart. |
| 33 | rocksdb.estimate-live-data-size | Estimated size of the activity data in bytes.For BlobDB, it also includes the actual live bytes in the version's blob file. |
| 36 | rocksdb.total-sst-files-size | Total size (in bytes) of all SST files.Note: If there are too many files, it may slow down the online query. |
| 37 | rocksdb.live-sst-files-size | Total size in bytes of all SST files belonging to the latest LSM tree. |
| 40 | rocksdb.estimate-pending-compaction-bytes | Estimated total number of bytes that compression needs to rewrite to bring all levels down below the target size. Has no effect on compression other than level-based compression. |
| 47 | rocksdb.block-cache-capacity | The capacity of the block cache. |
| 48 | rocksdb.block-cache-usage | Memory size occupied by entries in the block cache. |
| 49 | rocksdb.block-cache-pinned-usage | Memory size occupied by pinned entries in the block cache. |
| 51 | rocksdb.num-blob-files | The number of blob files in the current version. |
| 52 | rocksdb.blob-stats | The total and size of all blob files, and the total amount of garbage (in bytes) in blob files in the current version. |
| 53 | rocksdb.total-blob-file-size | The total size of all blob files across all versions. |
| 54 | rocksdb.live-blob-file-size | The total size of all blob files in the current version. |
See here


