| id | title | date | author | layout | guid |
|---|---|---|---|---|---|
3915 |
ODK Team Releases ODK Tables Alpha |
2013-07-08 16:19:31 +0000 |
Sam Sudar |
single |
/?p=3915 |
The ODK Team is pleased to announce the alpha release of ODK Tables.
Tables is an Android app that allows you to visualize and edit data, revisiting existing data and syncing it up to an Aggregate instance in the cloud. Using Tables as your entry-point to data collection, you will be able to gather data using Collect (and eventually Survey), sync it to a server, and have other users download and edit the data on their own devices.
Tables supports a familiar spreadsheet view, as well as graphing and visualizing datapoints on a map. Users can also access the data using an HTML and javascript API. This feature allows users with web-programming experience to develop an Android app that includes persistence and synchronization functionality.
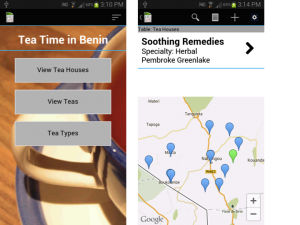
The APK, as well as an HTML-based app called “Tea Time in Benin,” can be installed from the Survey and Tables download pages. A walk-through of basic functionality and a guide to designing your own apps using Tables is also available in the wiki section of our developer website.
We would love to hear people’s thoughts and suggestions, as we will incorporate feedback into the upcoming beta and production releases.
REMINDER: This an alpha release! This means that Tables is still experimental and is under active development. As such, this release should not be used for production or for gathering data that cannot be lost.
Left: The customized, HTML-based home screen for the sample app, Tea Time in Benin.Right: Datapoints can be visualized in several ways, all of which can be highly customized. Here we are visualizing tea houses from the Tea Time in Benin sample app based on their location.
