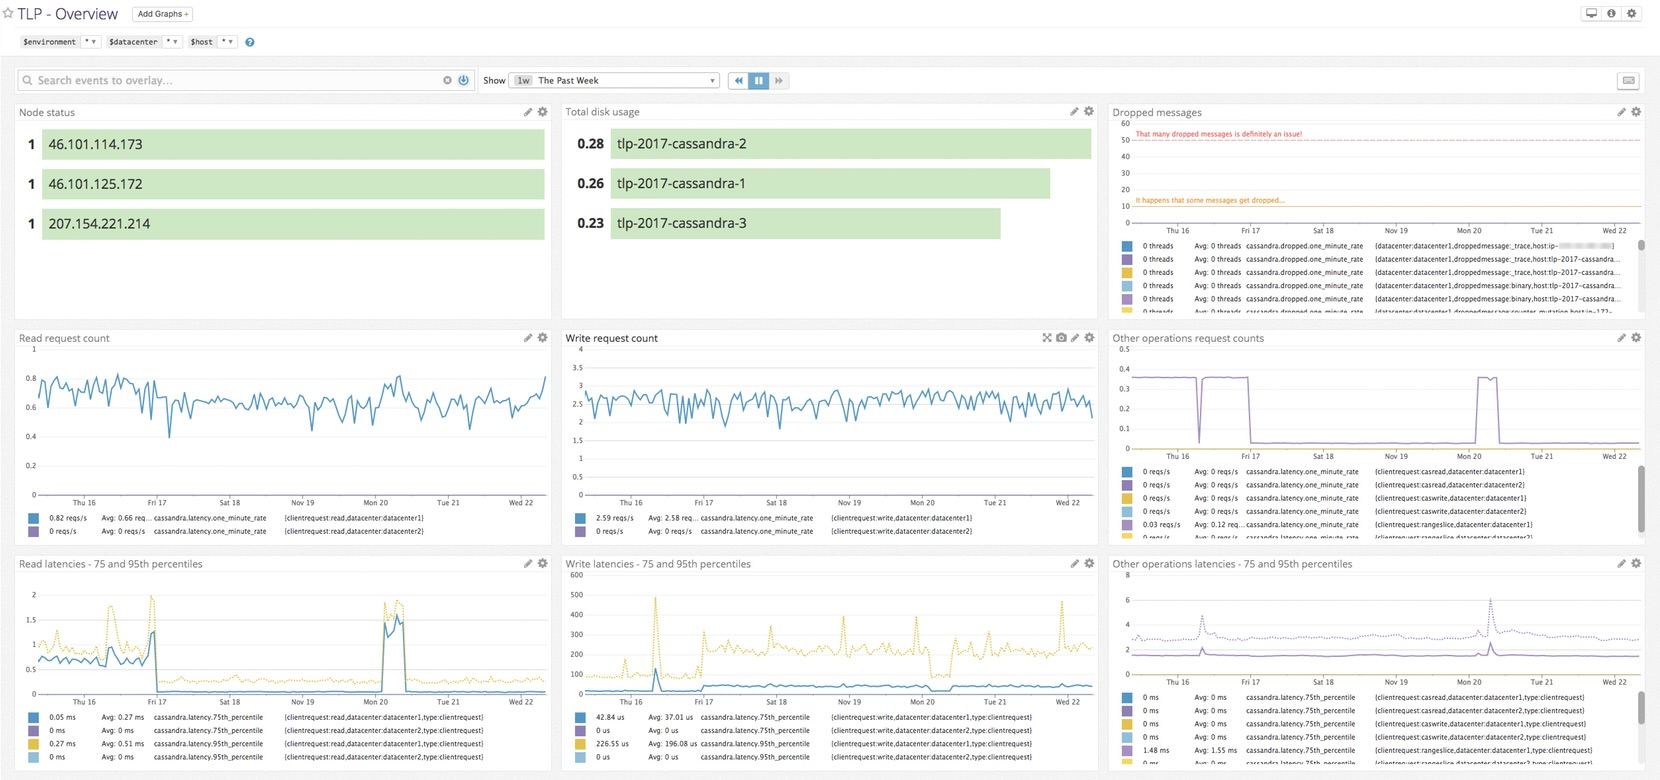
This check collects metrics for your Cassandra cluster that are not available through jmx integration. It uses the nodetool utility to collect them.
The Cassandra Nodetool check is included in the Datadog Agent package, so you don't need to install anything else on your Cassandra nodes.
Follow the instructions below to configure this check for an Agent running on a host. For containerized environments, see the Containerized section.
-
Edit the file
cassandra_nodetool.d/conf.yamlin theconf.d/folder at the root of your Agent's configuration directory. See the sample cassandra_nodetool.d/conf.yaml for all available configuration options:init_config: instances: ## @param keyspaces - list of string - required ## The list of keyspaces to monitor. ## An empty list results in no metrics being sent. # - keyspaces: - "<KEYSPACE_1>" - "<KEYSPACE_2>"
Cassandra Nodetool logs are collected by the Cassandra integration. See the log collection instructions for Cassandra.
For containerized environments, use the official Prometheus exporter in the pod, and then use Autodiscovery in the Agent to find the pod and query the endpoint.
Run the Agent's status subcommand and look for cassandra_nodetool under the Checks section.
See metadata.csv for a list of metrics provided by this integration.
The Cassandra_nodetool check does not include any events.
See service_checks.json for a list of service checks provided by this integration.
Need help? Contact Datadog support.
