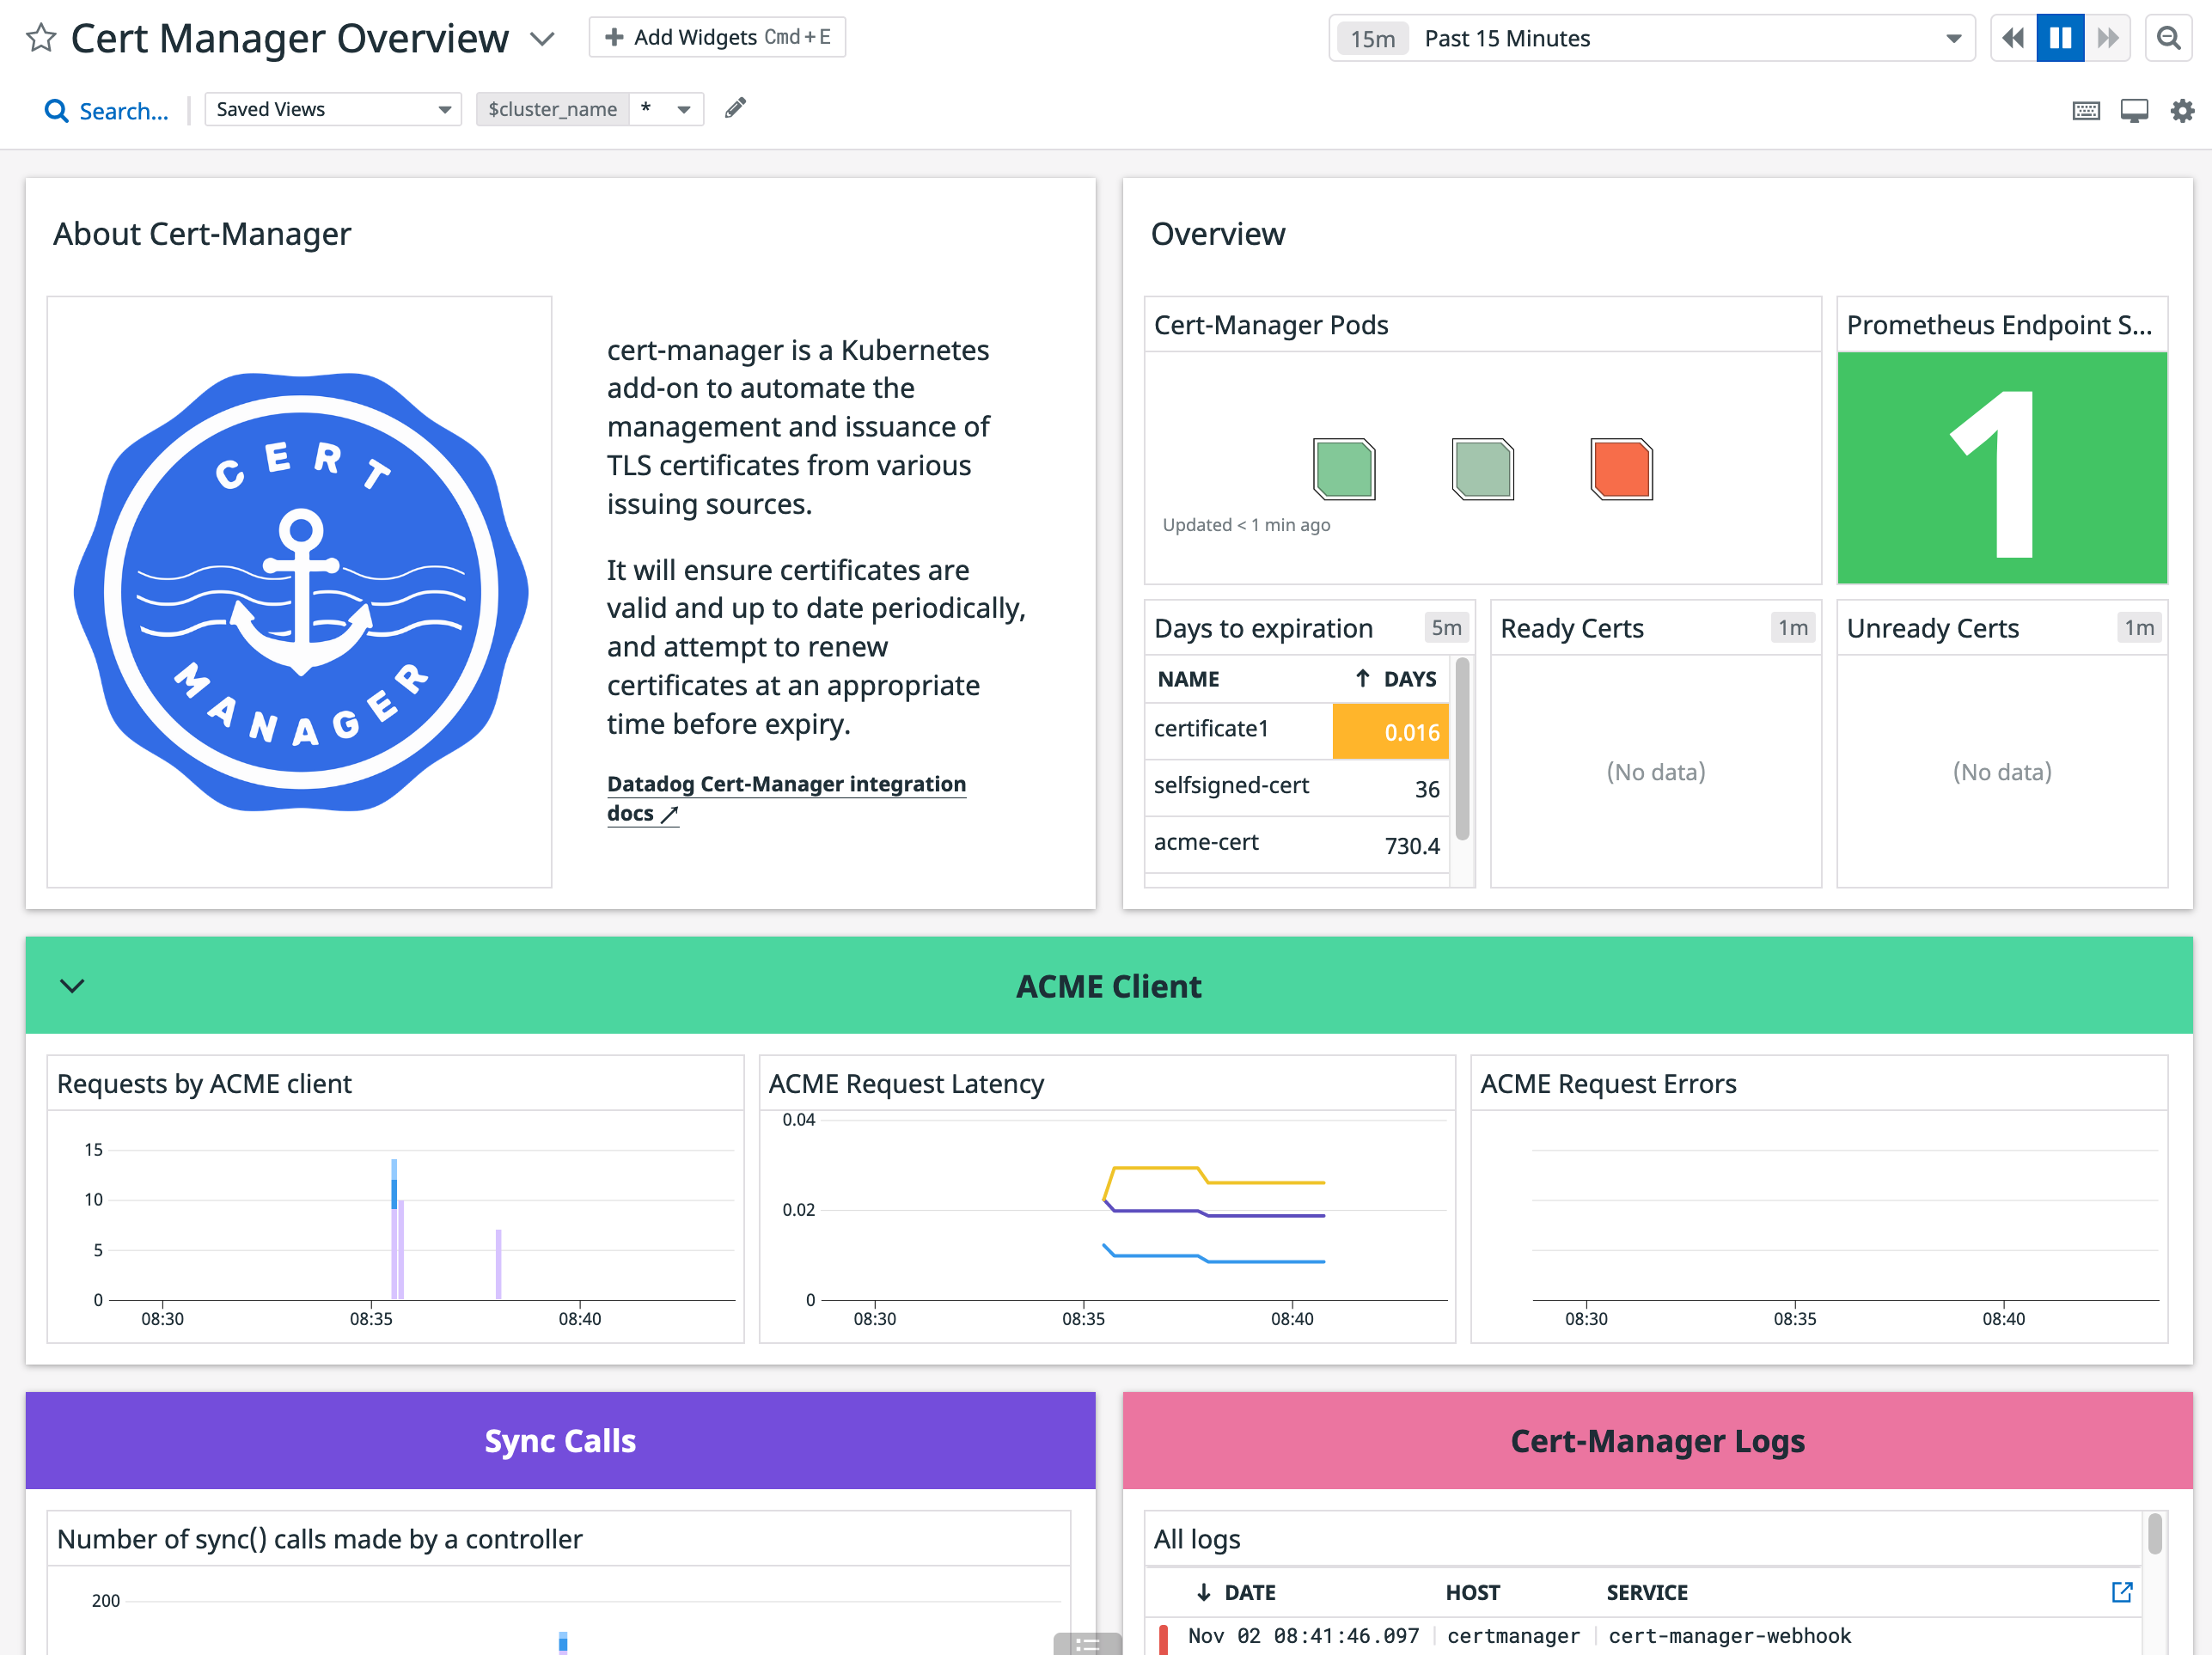
This check collects metrics from cert-manager.
Follow the instructions below to install and configure this check for an Agent running on a host. For containerized environments, see the Autodiscovery Integration Templates for guidance on applying these instructions.
The cert_manager check is included in the Datadog Agent package. No additional installation is needed on your server.
-
Edit the
cert_manager.d/conf.yamlfile in theconf.d/folder at the root of your Agent's configuration directory to start collecting your cert_manager performance data. See the sample cert_manager.d/conf.yaml for all available configuration options.
Run the Agent's status subcommand and look for cert_manager under the Checks section.
See metadata.csv for a list of metrics provided by this check.
The cert_manager integration does not include any events.
See service_checks.json for a list of service checks provided by this integration.
Each certificate name is exposed within the name label in the Prometheus payload and is converted to a tag by the Datadog Agent. If your hosts also use the name tag (for instance, automatically collected by the AWS integration), metrics coming from this integration will present both values. To avoid duplicate name tags, you can use the rename_labelsconfiguration parameter to map the Prometheus label name to the Datadog tag cert_name. This ensures you have a single value within the tag cert_name to identify your certificates :
init_config:
instances:
- openmetrics_endpoint: <OPENMETRICS_ENDPOINT>
  rename_labels:
    name: cert_name
Need further help? Contact Datadog support.
