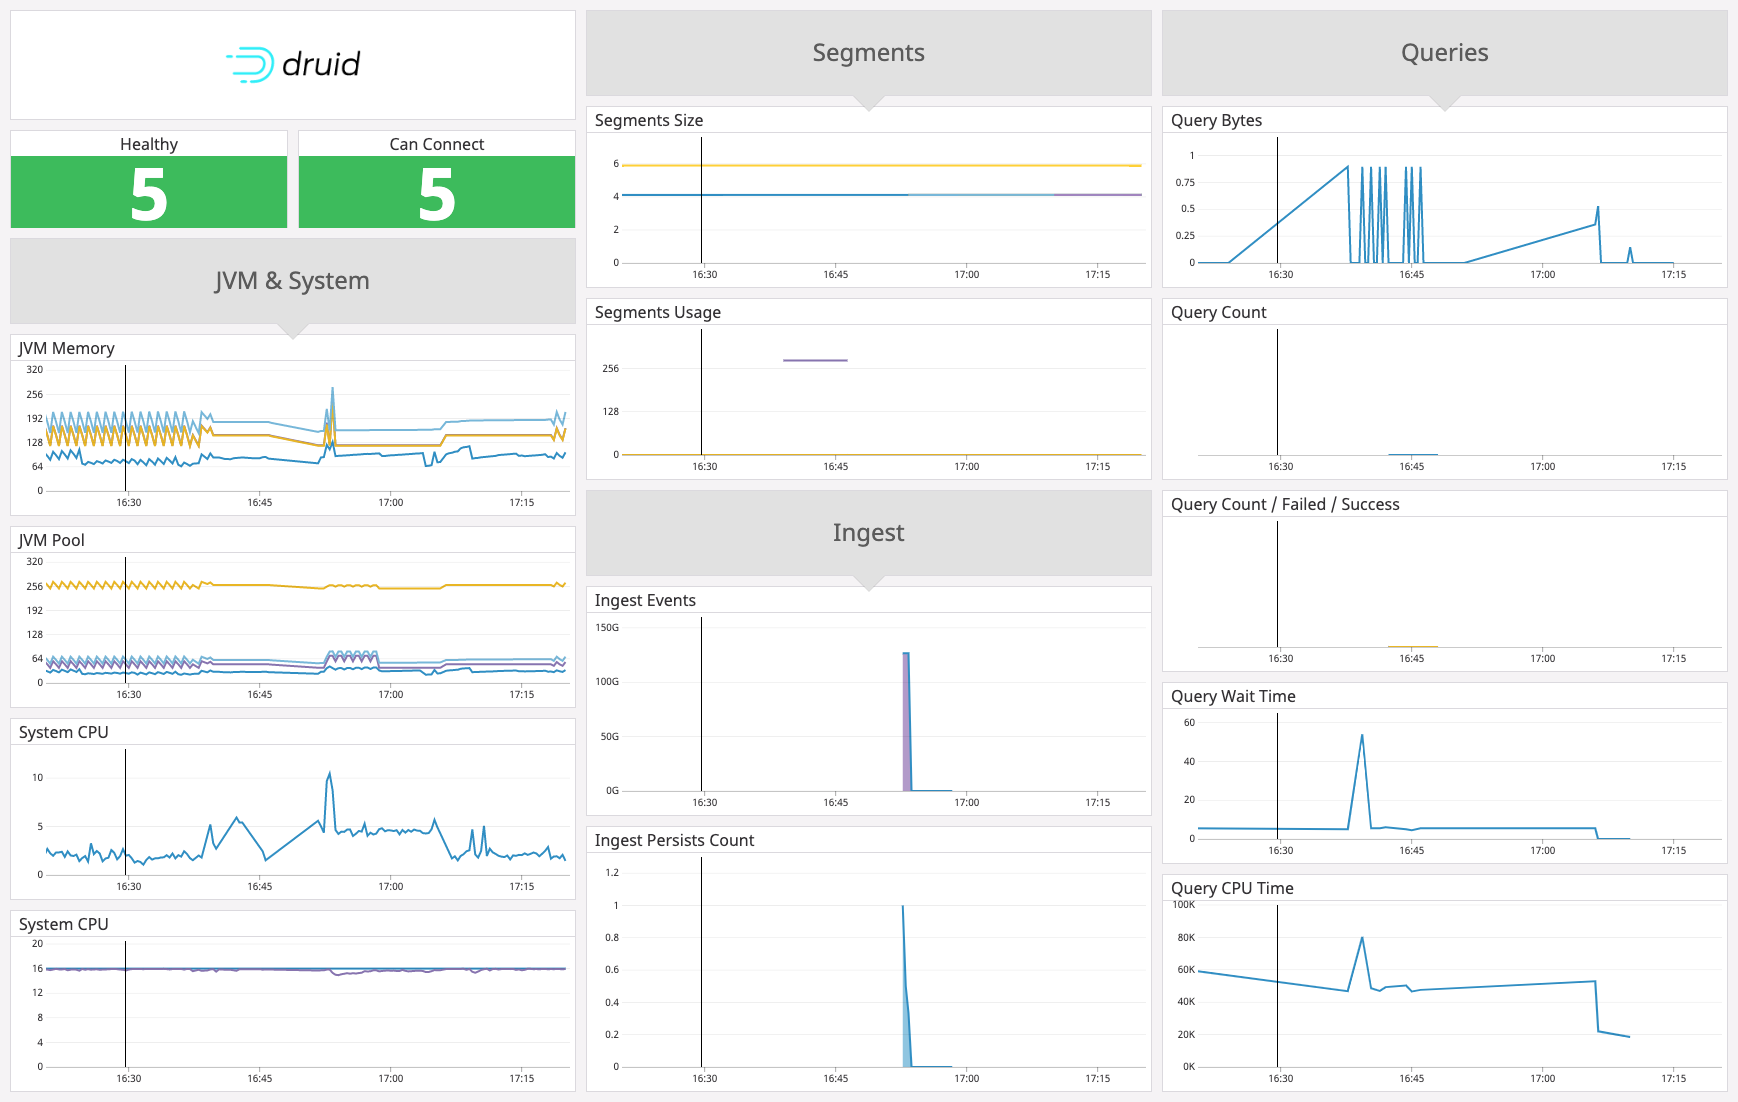
The Datadog Agent collects metrics from Druid using DogStatsD. DogStatsD collects metrics on Druid queries, ingestion, and coordination data. For more information, see the Druid metrics documentation.
In addition to collecting metrics, the Agent also sends a Service Check related to Druid's health.
Druid 0.16 or above is required for this integration to work properly.
Both steps below are needed for Druid integration to work properly. Before you begin, you should install the Datadog Agent.
Configure the Druid check included in the Datadog Agent package to collect health metrics and service checks.
- Edit the
druid.d/conf.yamlfile, in theconf.d/folder at the root of your Agent's configuration directory to start collecting your druid service checks. See the sample druid.d/conf.yaml for all available configuration options. - Restart the Agent.
Step 2: Connect Druid to DogStatsD (included in the Datadog Agent) by using the extension statsd-emitter to collect metrics
Step to configure statsd-emitter extension to collect the majority of Druid metrics.
-
Install the Druid extension
statsd-emitter.$ java \ -cp "lib/*" \ -Ddruid.extensions.directory="./extensions" \ -Ddruid.extensions.hadoopDependenciesDir="hadoop-dependencies" \ org.apache.druid.cli.Main tools pull-deps \ --no-default-hadoop \ -c "org.apache.druid.extensions.contrib:statsd-emitter:0.15.0-incubating"
More info about this step can be found on the official guide for loading Druid extensions
-
Update Druid java properties by adding the following configs:
# Add `statsd-emitter` to the extensions list to be loaded druid.extensions.loadList=[..., "statsd-emitter"] # By default druid emission period is 1 minute (PT1M). # We recommend using 15 seconds instead: druid.monitoring.emissionPeriod=PT15S # Use `statsd-emitter` extension as metric emitter druid.emitter=statsd # Configure `statsd-emitter` endpoint druid.emitter.statsd.hostname=127.0.0.1 druid.emitter.statsd.port:8125 # Configure `statsd-emitter` to use dogstatsd format. Must be set to true, otherwise tags are not reported correctly to Datadog. druid.emitter.statsd.dogstatsd=true druid.emitter.statsd.dogstatsdServiceAsTag=true -
Restart Druid to start sending your Druid metrics to the Agent through DogStatsD.
Use the default configuration of your druid.d/conf.yaml file to activate the collection of your Druid service checks. See the sample druid.d/conf.yaml for all available configuration options.
Available for Agent versions >6.0
-
Collecting logs is disabled by default in the Datadog Agent, enable it in your datadog.yaml file:
logs_enabled: true
-
Uncomment and edit this configuration block at the bottom of your
druid.d/conf.yaml:logs: - type: file path: '<PATH_TO_DRUID_DIR>/var/sv/*.log' source: druid service: '<SERVICE_NAME>' log_processing_rules: - type: multi_line name: new_log_start_with_date pattern: \d{4}\-\d{2}\-\d{2}
Change the
pathandserviceparameter values and configure them for your environment.
Run the Agent's status subcommand and look for druid under the Checks section.
See metadata.csv for a list of metrics provided by this check.
The Druid check does not include any events.
See service_checks.json for a list of service checks provided by this integration.
Need help? Contact Datadog support.
