SorTn-seq: a high-throughput functional genomics approach to discovering regulators of bacterial gene expression
Leah M. Smith, Simon A. Jackson, Lucia M. Malone, James E. Ussher, Paul P. Gardner and Peter C. Fineran* (2021) The Rcs stress response inversely controls surface and CRISPR–Cas adaptive immunity to discriminate plasmids and phages. Nature Microbiology, 6, 162–172. doi: 10.1038/s41564-020-00822-7
Leah M. Smith, Simon A. Jackson, Paul P. Gardner and Peter C. Fineran* (2021) SorTn-seq: a high-throughput functional genomics approach to discovering regulators of bacterial gene expression. Nature Protocols, 16, 4382–4418. doi: 10.1038/s41596-021-00582-6
SorTn-seq uses fluorescent reporters, saturation transposon mutagenesis and fluorescence activated cell sorting (FACS) to isolate bacterial mutants with altered gene expression. Sorted cell pools are deep sequenced to identify transposon insertion sites and the enrichment of mutants in high or low fluorescence bins is used to identify putative regulators of gene expression.
This repository contains:
-
The data analysis scripts from Smith et al., 2021, Nature Microbiology: SorTn-seq/Nature_Microbiology/
-
Data analysis scripts and an example dataset from the subsequent Protcol paper: Smith et al., 2021, Nature Protcols: SorTn-seq/
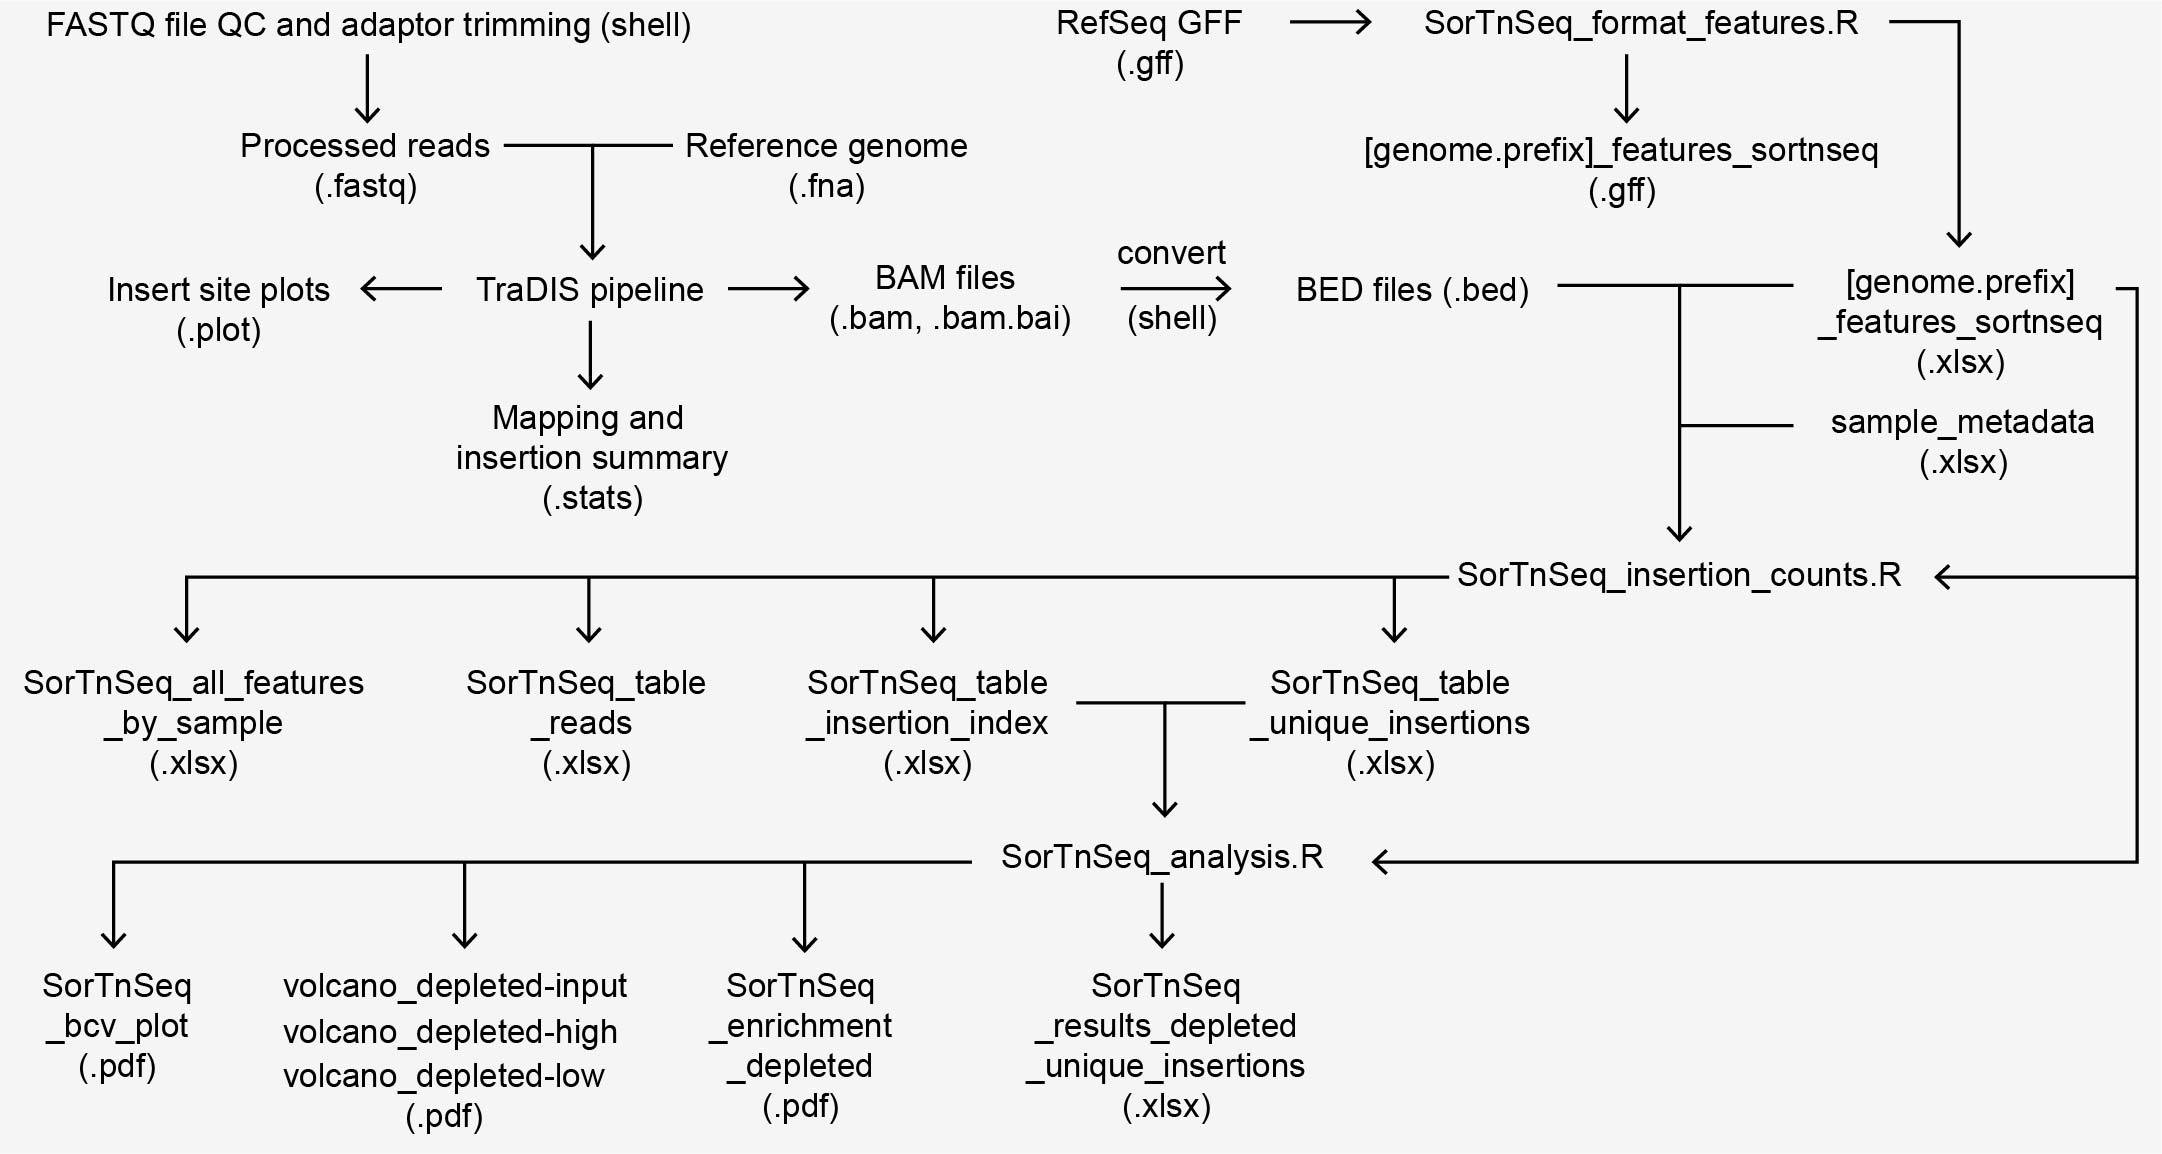
Summary of input and output files of the SorTn-seq analysis. FASTQ files are first processed to assess quality and remove adaptor contamination in the terminal window (shell). Processed files are fed into the TraDIS pipeline to identify the transposon tag and map reads to the reference genome (.fasta file). The TraDIS pipeline summarizes mapping and insertion statistics (.stats file), as well as producing sample-specific files, such reads per nucleotide position (.plot files) and Binary Alignment Map (BAM) files and indices (.bam and .bam.bai). In the terminal, BAM files are converted to Browser Extensible Data (BED) files (.bed) for subsequent analysis in R. To assign mapped reads to specific genomic features, an organism-specific feature table ([genome.prefix]_features_sortnseq.xlsx) is first generated in R (SorTnSeq_format_features.R), which parses RefSeq General Feature Format (GFF) files and adds intergenic regions as features. The feature table, BED files, and user-supplied sample information (sample_metadata.xlsx) are used to generate tables of read counts, insertion counts, and insertion index (number of insertions / feature length) for each sample (.xlsx files). To identify differentially enriched features, the unique insertion table (SorTnSeq_unique_insertions.xlsx) and insertion index table (SorTnSeq_table_insertion_index.xlsx) are processed using edgeR (SorTnSeq_analysis.R). A table summarizing feature enrichment (SorTnSeq_results_depleted_unique_insertions.xlsx) is generated along with plots that summarize the results (.pdf).
Process raw data: Requires the RefSeq nucleotide fasta file for the bacterial genome: [genome.prefix]_genomic.fna
# Quality control of raw sequencing data
fastqc -t 32 *.fastq.gz

# Optional read trimming
trimmomatic SE -threads 20 -trimlog trim_summary [input].fastq.gz [output].fastq.gz ILLUMINACLIP:TruSeq3-SE:2:30:1

# Bio-TraDIS
find *.fastq.gz -printf '%f\n' > filelist.txt
bacteria_tradis --smalt --smalt_k 10 --smalt_s 1 --smalt_y 0.92 --smalt_r -1 -mm 2 -v -f filelist.txt -T TATAAGAGACAG -r [genome.prefix]_genomic.fna

# Convert .bam files to .bed format
for FILE in *.bam; do
bedtools bamtobed -i $FILE > $FILE.bed
done
Requires:
- The RefSeq .gff file corresponding to the genome assembly used above: [genome.prefix]_genomic.gff
- Update the [genome.prefix] variable
Outputs:
- [genome.prefix]_features_sortnseq.xlsx
SorTnSeq_insertion_counts.R: Matches Tn insertion sites to genome features and generates a counts table for later analyses.
Requires:
- [genome.prefix]_features_sortnseq.xlsx
- sample_metadata.xlsx (see example in /example_dataset/ and below)
- The .bed files generate above, placed in bam/
- Update the [genome.prefix], [trim.3.prime] and [trim.5.prime] variables
Example sample_metadata table:
| plot.file.prefix | sample.type* | replicate |
|---|---|---|
| C7P4T-3658-01-0-1_S1_L001_R1_001_prinseq_good | low | 1 |
| C7P4T-3658-02-0-1_S2_L001_R1_001_prinseq_good | high | 1 |
| C7P4T-3658-03-0-1_S3_L001_R1_001_prinseq_good | depleted | 1 |
| C7P4T-3658-04-0-1_S4_L001_R1_001_prinseq_good | low | 2 |
| C7P4T-3658-05-0-1_S5_L001_R1_001_prinseq_good | high | 2 |
| C7P4T-3658-06-0-1_S6_L001_R1_001_prinseq_good | depleted | 2 |
| C7P4T-3658-07-0-1_S7_L001_R1_001_prinseq_good | low | 3 |
| C7P4T-3658-08-0-1_S8_L001_R1_001_prinseq_good | high | 3 |
| C7P4T-3658-09-0-1_S9_L001_R1_001_prinseq_good | depleted | 3 |
| C7P4T-3658-10-0-1_S10_L001_R1_001_prinseq_good | input | 1 |
| C7P4T-3658-11-0-1_S11_L001_R1_001_prinseq_good | input | 2 |
| C7P4T-3658-12-0-1_S12_L001_R1_001_prinseq_good | input | 3 |
*sample.type must be one of: [input] [high] [low] [depleted]
Outputs:
- SorTnSeq_table_reads.xlsx: summarizes the number of reads per feature for each library.
- SorTnSeq_table_insertion_index.xlsx: summarizes the insertion index (number of insertions / feature length) per feature for each library.
- SorTnSeq_table_unique_insertions.xlsx: summarizes the number of unique transposon insertions per feature for each library.
- SorTnSeq_all_features_by_sample.xlsx: summarizes the number of reads, unique insertions, and insertions index per feature for each library.
Requires:
- [genome.prefix]_features_sortnseq.xlsx
- SorTnSeq_table_unique_insertions.xlsx
- SorTnSeq_table_insertion_index.xlsx
- Update the [bcv.features], [read.cutoff.depleted], [reference.sample], [threshold.fc] and [threshold.p.adj] variables
Outputs:
- SorTnSeq_bcv_plot.pdf: multidimensional scaling plot (MDS) to visualize the similarity between libraries and replicates based upon the biological coefficient of variation
- SorTnSeq_enrichment_depleted.pdf: summarizes the enriched features in the high and low bins, at the specified cut-offs values. In R, this plot is interactive, and hovering above each point displays the feature name.
- Volcano plots for each sample library compared to the reference
- SorTnSeq_results_depleted_unique_insertions.xlsx: results of the differential enrichment analysis.
An example dataset for SorTn-seq on the type III-A CRISPR-Cas csm promoter in Serratia ATCC 39006 is provided in example_dataset/.
- The [genome.prefix] should be set to "GCF_002847015.1_ASM284701v1".
- The .bed files need to be unzipped before running SorTnSeq_insertion_counts.R.
- FastQC
https://www.bioinformatics.babraham.ac.uk/projects/fastqc/ - Trimmomatic
http://www.usadellab.org/cms/?page=trimmomatic - BEDTools
https://github.com/arq5x/bedtools2 - Bio-TraDIS
https://sanger-pathogens.github.io/Bio-Tradis/ - R
Version 4.0.3 or higher https://www.r-project.org/
- tidyverse
- readxl
- writexl
- edgeR
- scales
- ggrepel
- ggiraph
