This documentation page is outdated.
For up-to-date information, see the Lets-Plot for Kotlin documentation website.
-
Lets-Plot Kotlin API reference: https://lets-plot.org/kotlin
-
The "Example Notebooks" reference: kotlin_examples/
-
Example notebooks in the Binder: mybinder.org
You can customize the content, values formatting and appearance of tooltip for any geometry layer in your plot.
Learn more: Tooltip Customization.
Formatting of numeric and date-time values in tooltips, legends, on the axes and text geometry layer.
Learn more: Formatting.
Sampling is a special technique of data transformation, which helps to deal with large datasets and overplotting.
Learn more: Data Sampling.
The ggsave() function is a convenient way of saving a plot or a GGBunch object in a file.
The supported export formats are: SVG, HTML, PNG, JPEG and TIFF.
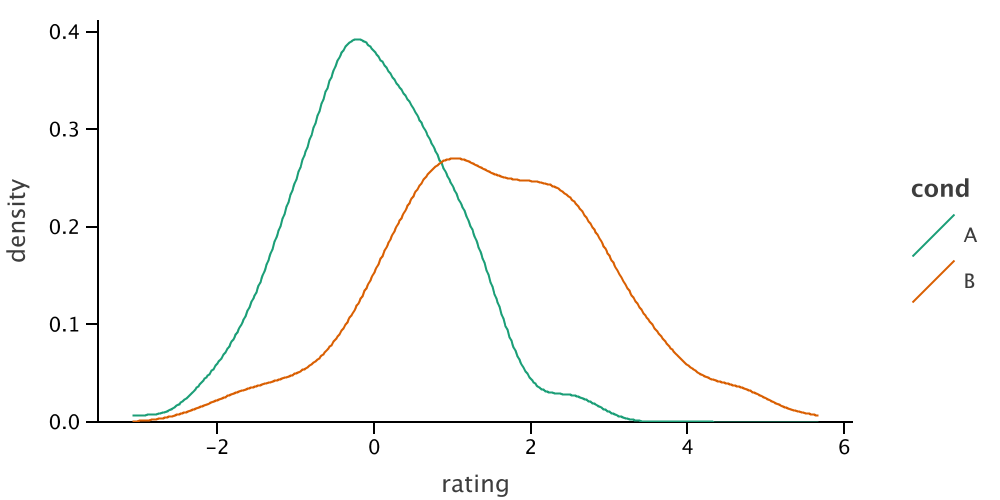
For example, the code below will save plot as a PNG image in the file <user dir>//lets-plot-images/density.png:
val rand = java.util.Random(123)
val n = 400
val data = mapOf (
    "rating" to List(n/2) { rand.nextGaussian() } + List(n/2) { rand.nextGaussian() * 1.5 + 1.5 },
    "cond" to List(n/2) { "A" } + List(n/2) { "B" }
)

var p = letsPlot(data) +
        geomDensity { x = "rating"; color = "cond" } + ggsize(500, 250)

ggsave(p, "density.png")
See ggsave() documentation
for more information about the function arguments and default values.
Example notebook: ggsave demo.
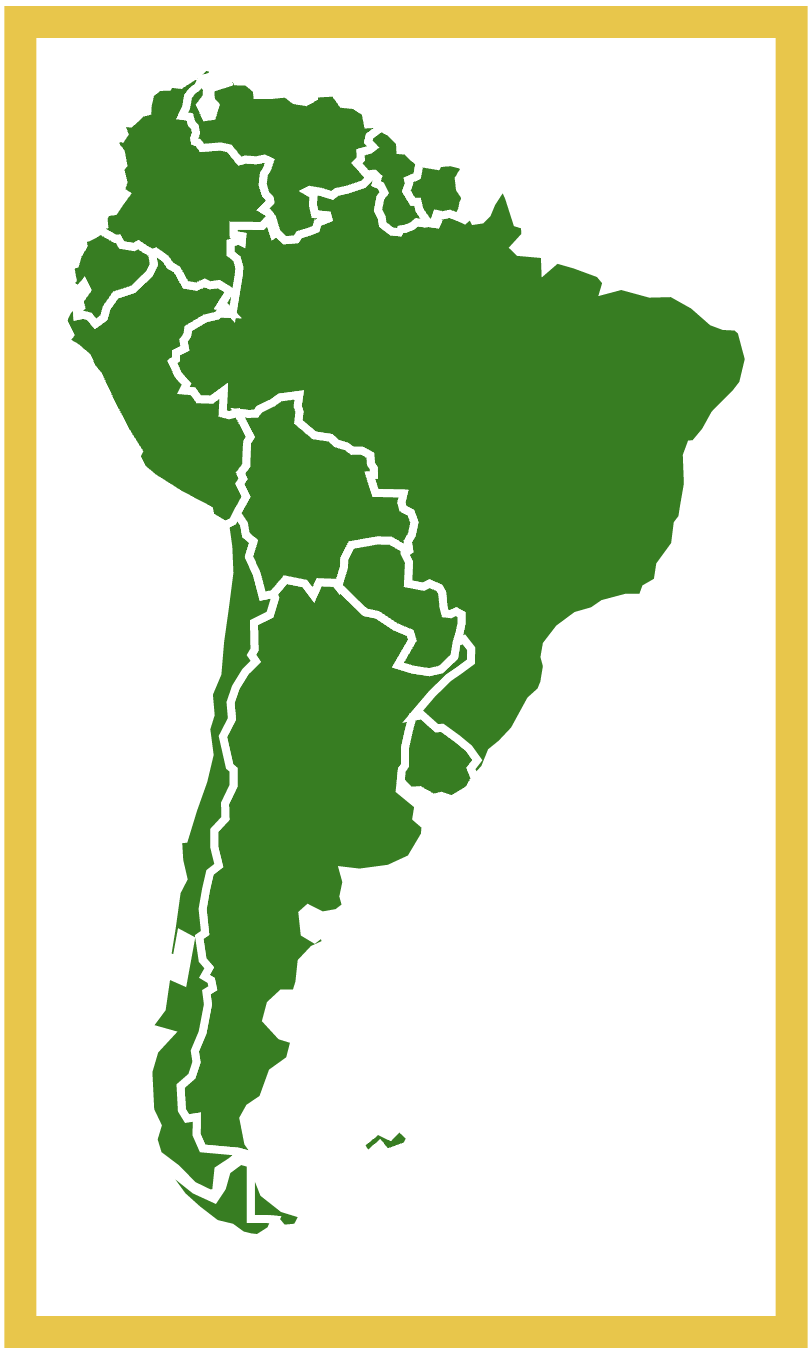
GeoTools is an open source Java GIS Toolkit.
Lets-Plot supports visualization of a set of SimpleFeature-s stored in SimpleFeatureCollection, as well as
individual Geometry and ReferencedEnvelope objects.
Learn more: Geospatial Charts.

