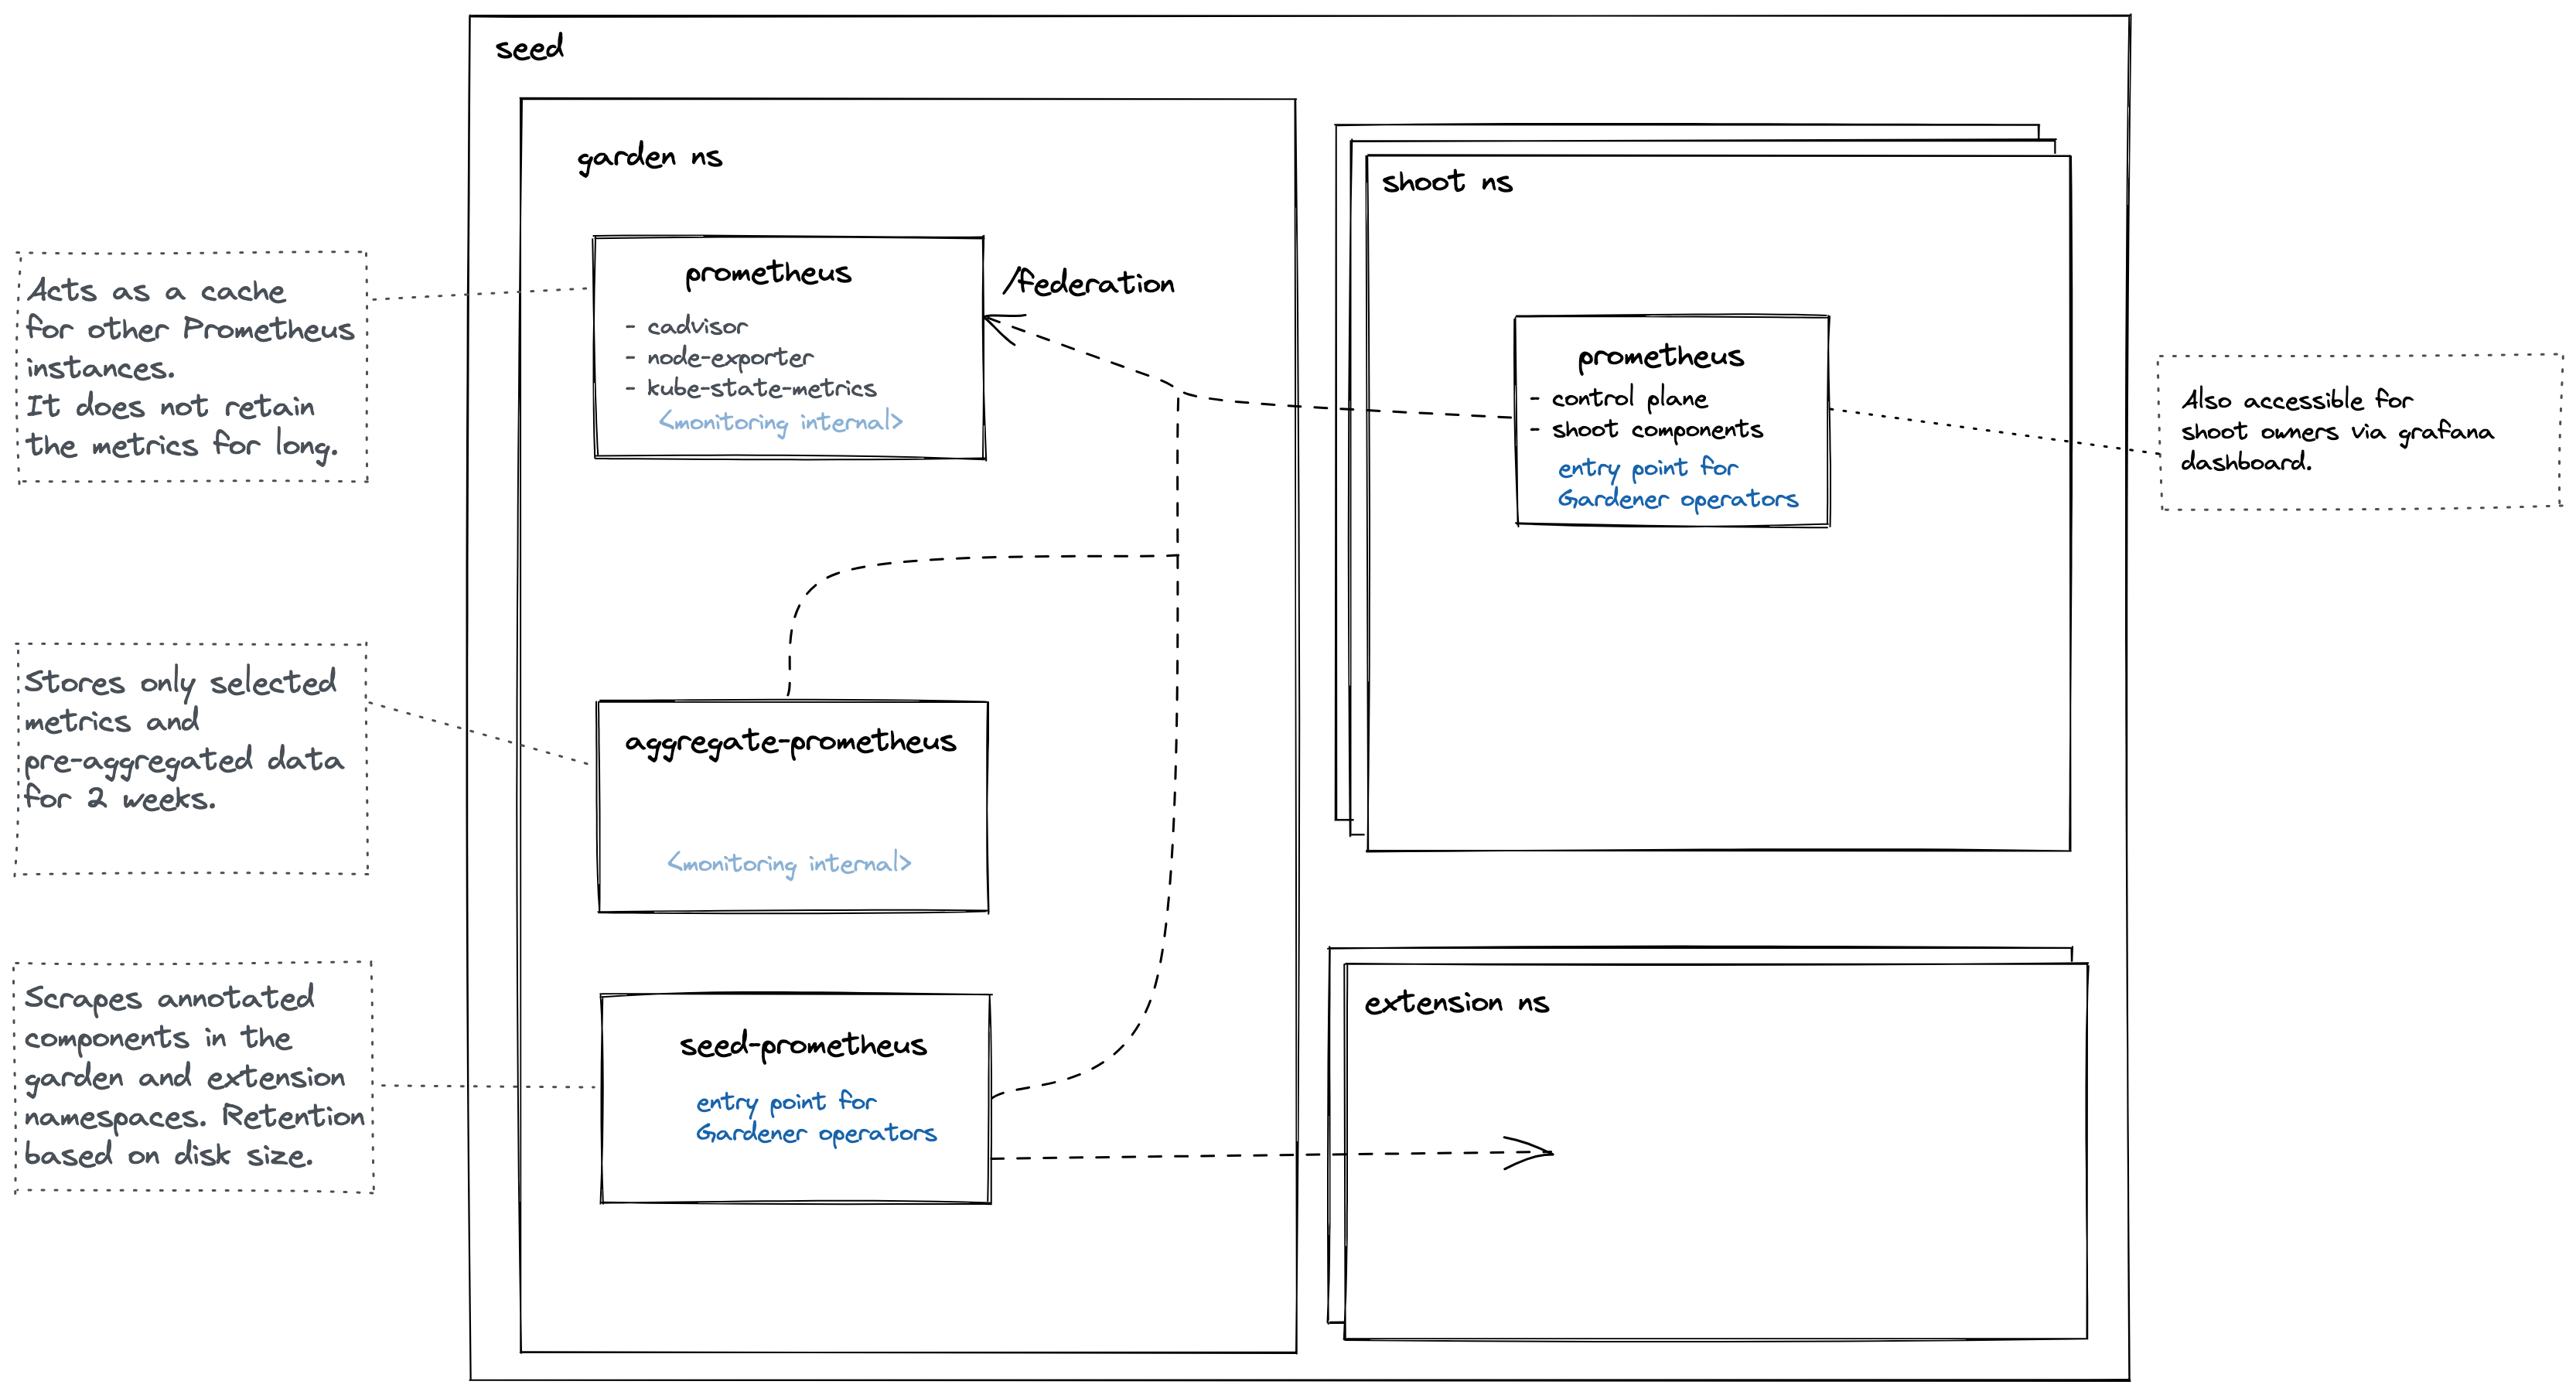
Deployed in the garden namespace. Important scrape targets:
- cadvisor
- node-exporter
- kube-state-metrics
Purpose: Acts as a cache for other Prometheus instances. The metrics are kept for a short amount of time (~2 hours) due to the high cardinality. For example if another Prometheus needs access to cadvisor metrics it will query this Prometheus instead of the cadvisor. This also reduces load on the kubelets and API Server.
Some of the high cardinality metrics are aggregated with recording rules. These pre-aggregated metrics are scraped by the Aggregate Prometheus.
This Prometheus is not used for alerting.
Deployed in the garden namespace. Important scrape targets:
- other prometheus instances
- logging components
Purpose: Store pre-aggregated data from prometheus and shoot prometheus. An ingress exposes this Prometheus allowing it to be scraped from another cluster.
Deployed in the garden namespace. Important scrape targets:
- pods in extension namespaces annotated with:
prometheus.io/scrape=true
prometheus.io/port=<port>
prometheus.io/name=<name>
- cadvisor metrics from pods in the garden and extension namespaces
The job name label will be applied to all metrics from that service. Purpose: Entrypoint for operators when debugging issues with extensions or other garden components.
Deployed in the shoot control plane namespace. Important scrape targets:
- control plane components
- shoot nodes (node-exporter)
- blackbox-exporter used to measure connectivity
Purpose: Monitor all relevant components belonging to a shoot cluster managed by Gardener. Shoot owners can view the metrics in Plutono dashboards and receive alerts based on these metrics. Gardener operators will receive a different set of alerts. For alerting internals refer to this document.
An optional collection of all Shoot Prometheus metrics to a central prometheus (or cortex) instance is possible with the monitoring.shoot setting in GardenletConfiguration:
monitoring:
  shoot:
    remoteWrite:
      url: https://remoteWriteUrl # remote write URL
      keep:# metrics that should be forwarded to the external write endpoint. If empty all metrics get forwarded
      - kube_pod_container_info
      queueConfig: | # queue_config of prometheus remote write as multiline string
        max_shards: 100
        batch_send_deadline: 20s
        min_backoff: 500ms
        max_backoff: 60s
    externalLabels: # add additional labels to metrics to identify it on the central instance
      additional: label
If basic auth is needed it can be set via secret in garden namespace (Gardener API Server). Example secret
If you wish to disable metric collection for every shoot and roll your own then you can simply set.
monitoring:
  shoot:
    enabled: false
