- Algorand TEAL Debugger
- Run the debugger
It prints out the URL to follow:
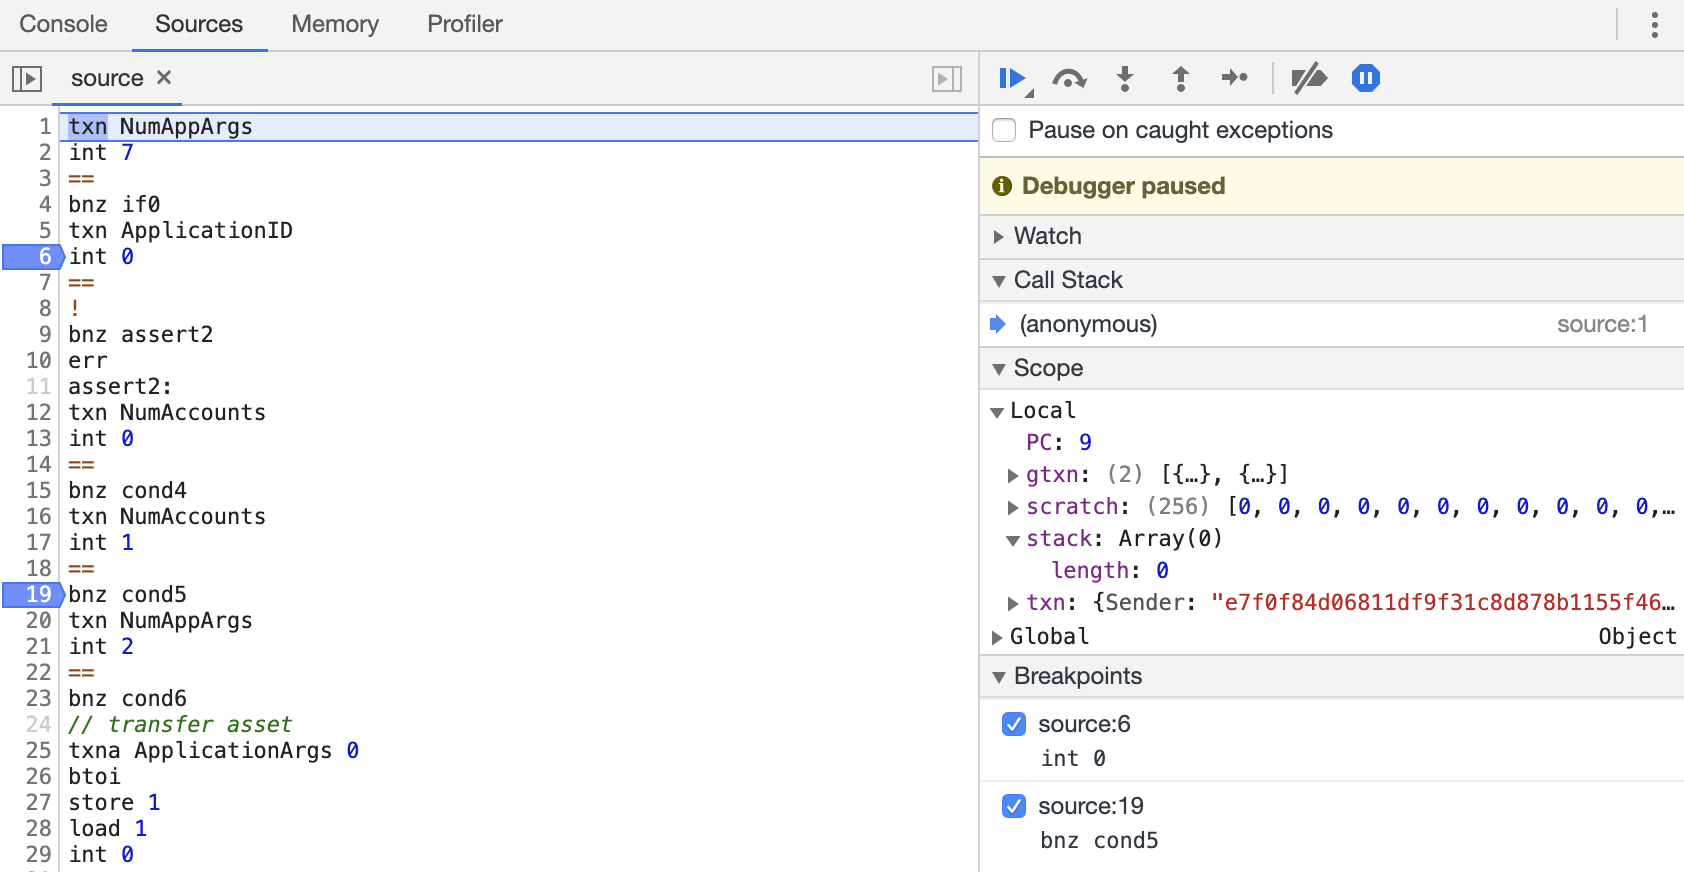
$ tealdbg debug myprog.teal $ tealdbg debug samples/calls_count.teal --balance samples/calls_count_balance.json --txn samples/calls_count_txn.json --proto=future $ tealdbg debug samples/calls_count.teal --proto=future --painlessdevtools://devtools/bundled/js_app.html?... - Open the URL in Google Chrome.
If you see the
This site can’t be reachedpage, open Chrome DevTools as explained and refresh the page.
The debugger runs either local programs or accept HTTP connections from remote evaluators configured to run with a remote debugger hook.
Local debugger allows debugging TEAL from files (both sources and compiled) or from transaction(s) and balance records (see Setting Debug Context for details).
Remote debugger might be useful for debugging unit tests for TEAL (currently in Golang only) or for hacking algod eval and breaking on any TEAL evaluation.
The protocol consist of three REST endpoints and one data structure describing the evaluator state.
See WebDebugger and TestWebDebuggerManual in go-algorand sources for more details.
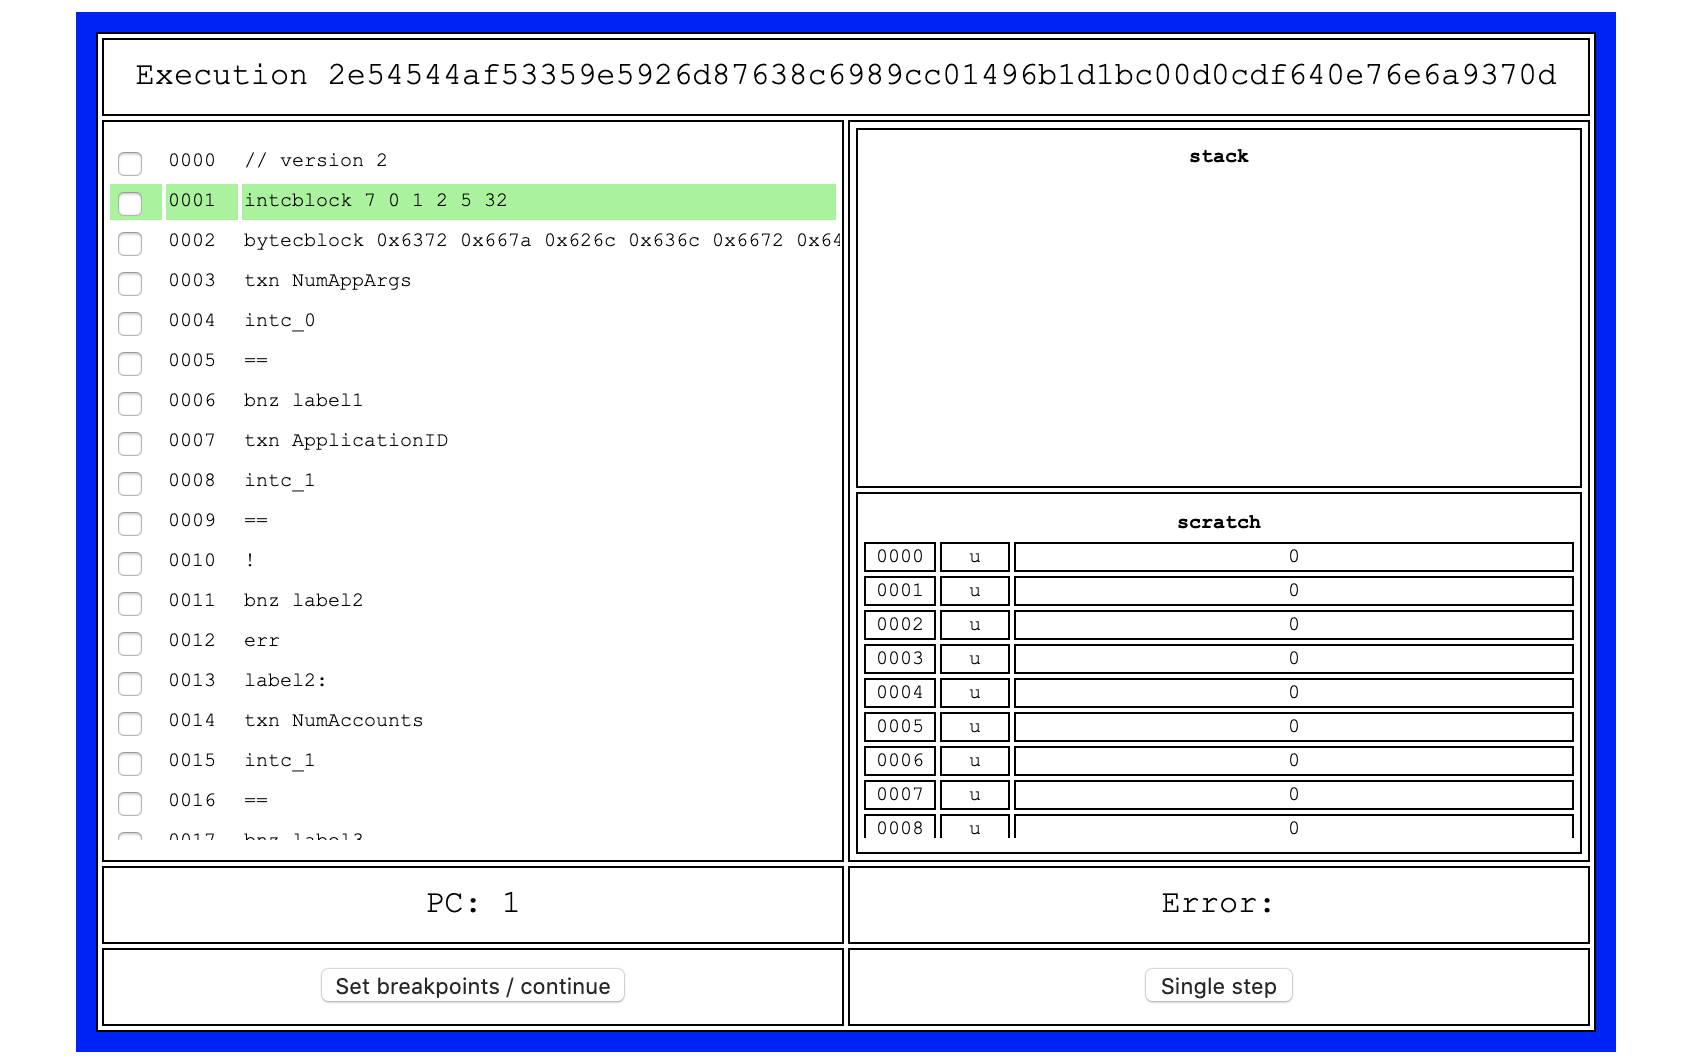
Two frontends are available:
Local debugger supports setting the execution context: consensus protocol, transaction(s), balance records, execution mode.
Used to determine execution parameters and limits such as program version, max program size and cost and so on.
$ tealdbg debug --proto https://github.com/algorandfoundation/specs/tree/e5f565421d720c6f75cdd186f7098495caf9101f
$ tealdbg debug --proto future
Transaction(s) are used for:
- Providing execution environment for TEAL programs.
Its fields are accessible by
txn,gtxn,txnaandgtxnainstructions. - Retrieving TEAL code from
Lsig.Logicor fromApplicationCallTxtransactions.
$ tealdbg debug --txn samples/txn_group.json
If an array of transaction supplied then it is treated as a transaction group. To specify the current transaction for execution use --group-index option:
$ tealdbg debug --txn samples/txn_group.json --group-index=1
Transaction(s) are JSON or MessagePack (goal clerk compatible) serialized instances of transactions. See samples dir for more examples.
Sample transaction in JSON format:
{
  "sig": "+FQBnfGQMNxzwW85WjpSKfOYoEKqzTChhJ+h2WYEx9C8Zt5THdKvHLd3IkPO/usubboFG/0Wcvb8C5Ps1h+IBQ==",
  "txn": {
    "amt": 1000,
    "close": "IDUTJEUIEVSMXTU4LGTJWZ2UE2E6TIODUKU6UW3FU3UKIQQ77RLUBBBFLA",
    "fee": 1176,
    "fv": 12466,
    "gen": "devnet-v33.0",
    "gh": "JgsgCaCTqIaLeVhyL6XlRu3n7Rfk2FxMeK+wRSaQ7dI=",
    "lv": 13466,
    "note": "6gAVR0Nsv5Y=",
    "rcv": "PNWOET7LLOWMBMLE4KOCELCX6X3D3Q4H2Q4QJASYIEOF7YIPPQBG3YQ5YI",
    "snd": "47YPQTIGQEO7T4Y4RWDYWEKV6RTR2UNBQXBABEEGM72ESWDQNCQ52OPASU",
    "type": "pay"
  }
}
Balance records are used for setting environment for stateful TEAL execution and contains data available for TEAL with balance, global Round, app_opted_in and so on instructions.
$ tealdbg debug myprog.teal --balance samples/balances.json
Balance records are JSON or MessagePack (goal account dump compatible) serialized instances of basics.BalanceRecord
Sample balance record in JSON format:
{
  "addr": "PNWOET7LLOWMBMLE4KOCELCX6X3D3Q4H2Q4QJASYIEOF7YIPPQBG3YQ5YI",
  "onl": 1,
  "algo": 500000000,
  "asset": {
    "50": {
        "a": 10
    }
  },
  "appl": {
    "100": {
      "hsch": {
        "nbs": 3,
        "nui": 2
      },
      "tkv": {
        "lkeybyte": {
          "tb": "local",
          "tt": 1
        },
        "lkeyint": {
          "tt": 2,
          "ui": 1
        }
      }
    }
  }
}
If default/empty local and global state are OK for the application, the use --painless CLI option
to automatically create necessary balance records for the application(s) so that app_ opcodes
do not fail due to absent data in ledger.
You can also supply balance records through an indexer https://github.com/algorand/indexer. Specify the indexer api endpoint, round number at which to fetch balance records, and an api token if necessary.
$ tealdbg debug myprog.teal --round roundnumber -i apiendpoint --indexer-token token
Execution mode, either signature or application matches to Algod's evaluation mode
for logic signature TEAL or application call TEAL. In short, determines either state access allowed or not with state access instructions. For example, balance, global Round, app_opted_in instructions are only available in application mode.
$ tealdbg debug myprog.teal --mode signature
Default value for --mode option is auto that forces the debugger to scan the program and to guess suitable execution mode.
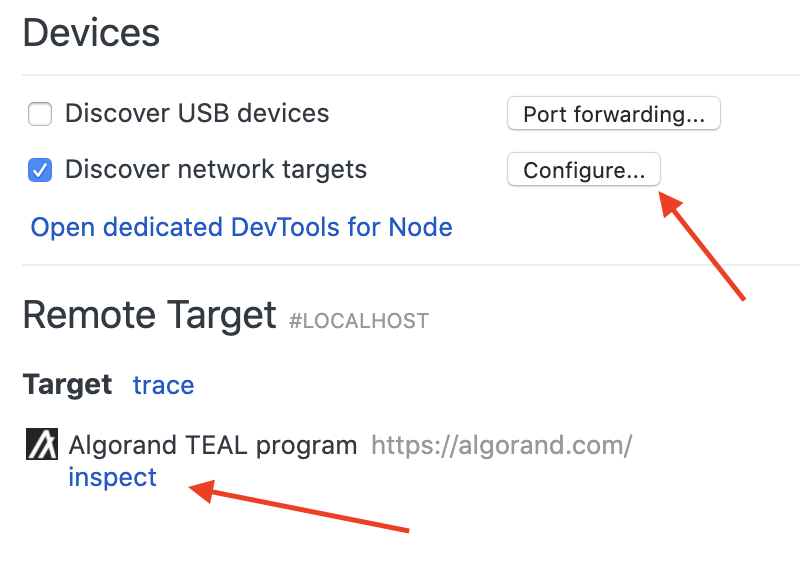
Open chrome://inspect/, click Configure, type localhost:9392 (default port) and save.
Then active CDT session will appear under "Remote Target" section. Click inspect to start debugging.
Refer the screenshot for details:
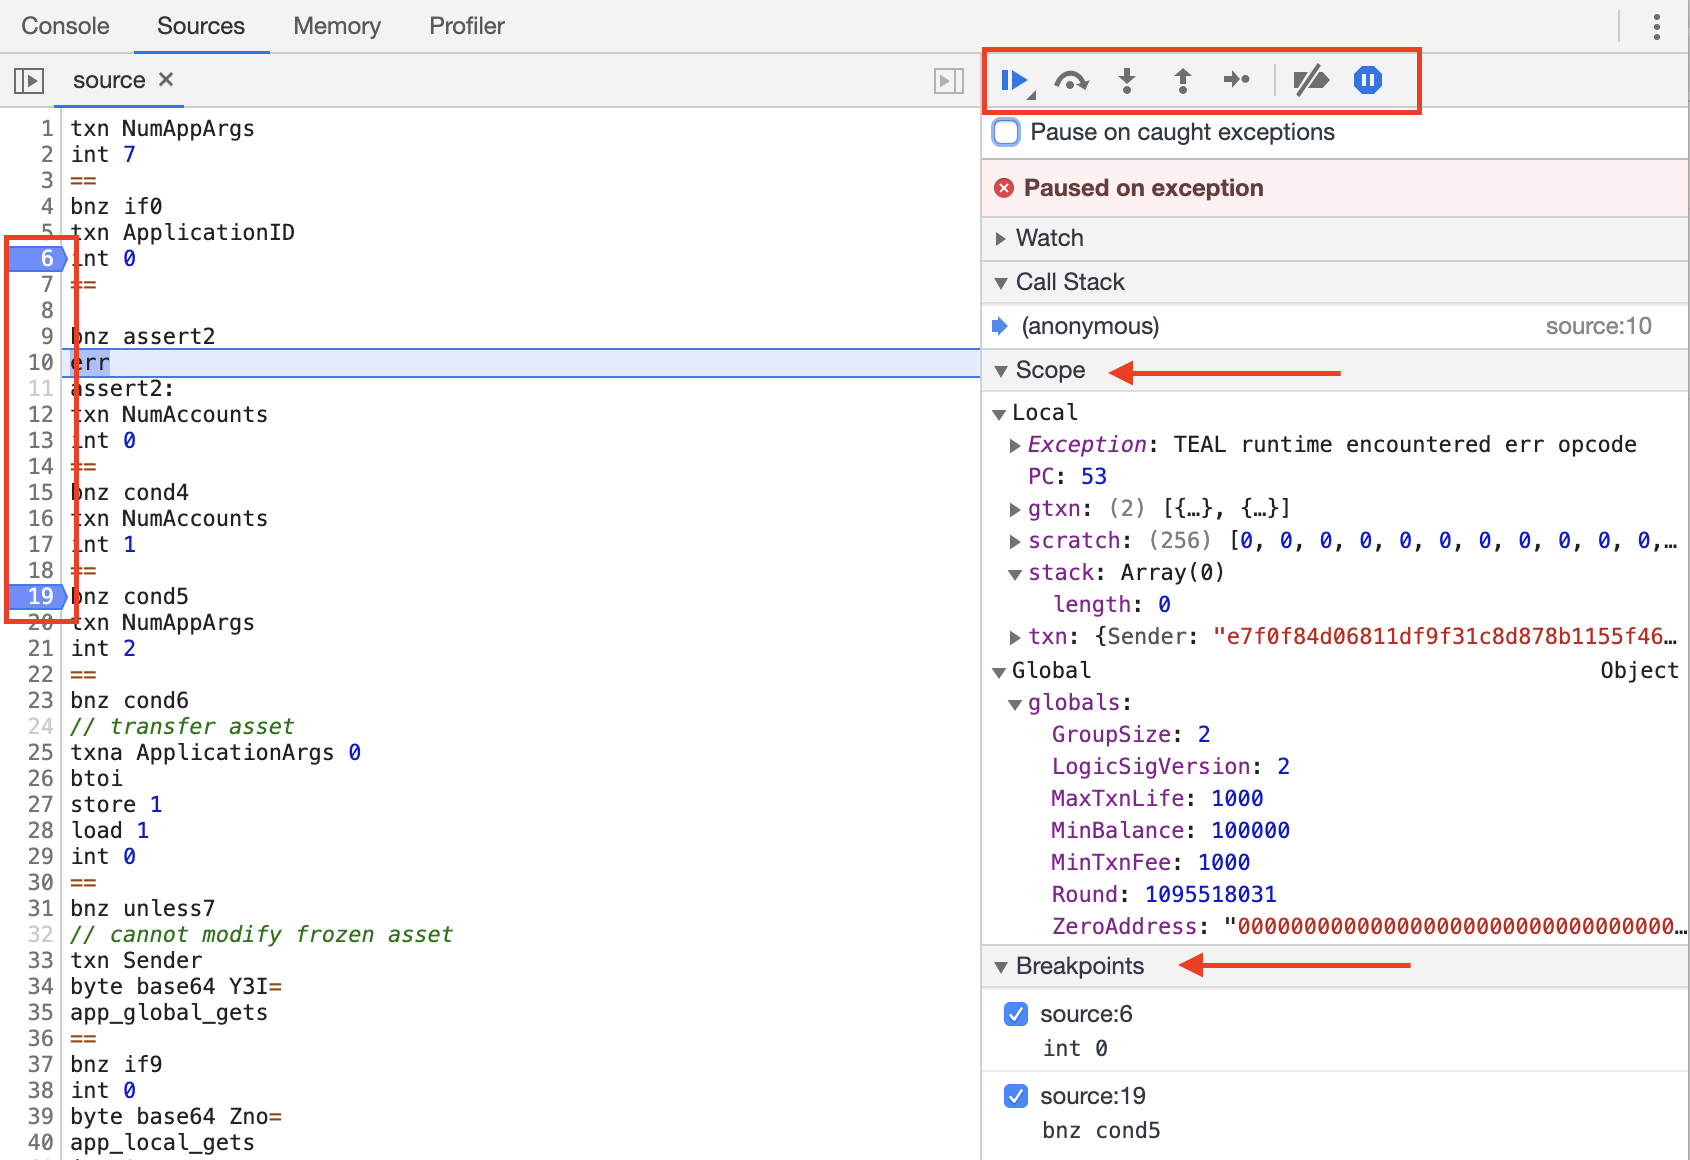
- Resume continues execution until next breakpoint if any.
- Step, Step Into, Step Over are equivalents.
- Step Out runs the program until the last instruction.
- Activate breakpoints enables or disables all the breakpoints.
- Pause on Exceptions enables breaking on evaluation error.
- Scope pane allows examination of global fields, transaction object(s), stack and scratch space. It also shows exception info if any.
- Breakpoints pane shows active breakpoints.
- Line numbers on the right allows breakpoints setting by a mouse-click.
Refer to the Chrome DevTools debugging documentation for a complete guide.
The evaluator accepts a new Debugger parameter described as the interface:
// Debugger is an interface that supports the first version of AVM debuggers.
// It consists of a set of functions called by eval function during AVM program execution.
//
// Deprecated: This interface does not support non-app call or inner transactions. Use EvalTracer
// instead.
type Debugger interface {
	// Register is fired on program creation
	Register(state *DebugState)
	// Update is fired on every step
	Update(state *DebugState)
	// Complete is called when the program exits
	Complete(state *DebugState)
}
If Debugger is set the evaluator calls Register on creation, Update on every step and Complete on exit.
The debugger consist of a core, transport adapters and debug adapters (frontends).
The core process Register, Update and Complete calls from the evaluator.
On Register it starts a new session and establish notification channel for state updates.
On Update it checks for breakpoints matches and if found, the debugger publishes the notification and waits for confirmation.
On Complete it publishes a final state update and removes the session.
An adapter must implement the following interface:
type DebugAdapter interface {
	SessionStarted(sid string, debugger Control, ch chan Notification)
	SessionEnded(sid string)
	WaitForCompletion()
}
The core calls SessionStarted for all adapters as part of dispatching Register. It is up to adapter to setup communication channel with a user. Then an adapter needs to start processing notifications from the channel and manage execution using debugger's Control interface.
The core calls SessionEnded on Complete call.
WaitForCompletion function might or might not be called by integrator (tealdbg). The main purpose is to prevent the main process termination when evaluation is done but the user is still working in UI.
WARNING: Use it only for private network for development purposes.
If one needs to debug TEAL in as much real environment as possible then do
- Add
WebDebuggertodata/transactions/logic/eval.go:cx.program = program // begin new code debugURL := os.Getenv("TEAL_DEBUGGER_URL") cx.Debugger = &WebDebugger{URL: debugURL} // end new code if cx.Debugger != nil {
- Start the remote debugger
$ tealdbg remote - Rebuild algod
$ make install - Set
TEAL_DEBUGGER_URLto debugger address and restart algod$ export TEAL_DEBUGGER_URL=http://localhost:9392 $ goal node restart


