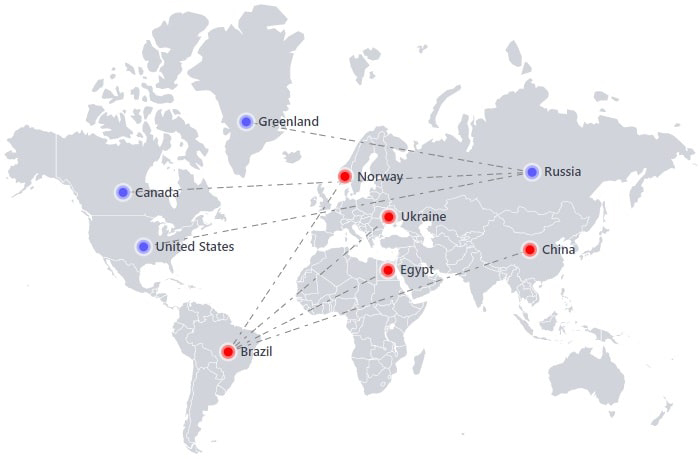
A lightweight Javascript library for creating interactive maps and pretty data visualization.
Explore docs
.
Report bug
·
View demo
·
Download
Bringing data to life with interactive maps
This project is a deeply modified version of jvectormap and was created to help developers who aren't using jQuery anymore in their projects.
Jsvectormap supports all modern browsers including IE9+
- Interactive map is a powerful tool for presentation.
- It give the ability to create layers of information that can be shown or hidden at the click of a button on a region or maybe a marker.
- Data can be quickly updated, and these updates made transparent to users.
- Zoom functions that allow users to focus on either the details of a particular region, or to gain a quick overview of a wider area.
Installing via npm
npm i jsvectormapimport your preferred map you want to work with, after importing the jsvectormap
import jsVectorMap from 'jsvectormap'
import 'jsvectormap/dist/maps/world.js'

const map = new jsVectorMap({
  selector: '#map',
  map: 'world',
})Your contributions always welcome but consider the following notes:
- The build files shouldn't be updated when sending pull requests.
### Install node via your preferred mechanism. Ensure the binaries are in your path & obtain a copy of this repository and change into the working directory
git clone https://github.com/themustafaomar/jsvectormap.git && cd jsvectormap

# Build
npm run build

# Start up the live web server (will be available on port 10001)
npm run dev
-> http://localhost:10001/index.html

# Access and test in samples dir
-> http://localhost:10001/samples/YourSampleName.htmljsvectormap licensed under MIT.


