Annotations of a sample image. Labels are shown for a subset of 15 tasks.
This repository shares a multi-annotated dataset from the following paper:
Taskonomy: Disentangling Task Transfer Learning, CVPR 2018. Amir R. Zamir, Alexander Sax*, William B. Shen*, Leonidas Guibas, Jitendra Malik, Silvio Savarese.
The dataset includes over 4.5 million images from over 500 buildings. Each image has annotations for every one of the 2D, 3D, and semantic tasks in Taskonomy's dictionary (see below). The total size of the dataset is 11.16 TB. For more details, please see the CVPR 2018 paper.
To download the full dataset, please use the Omnidata download tool (Eftekhar et al 2021).
Note: The Taskonomy dataset is a subset of the larger and more diverse Omnidata starter dataset (Omnidata: 14M images w/ indoor, outdoor, and object-focused scenes). To download only the Taskonomy component, you can use:
sudo apt-get install aria2
pip install omnidata-tools
omnitools.download all --components taskonomy --subset fullplus \
  --dest ./taskonomy_dataset/ \
  --connections_total 40 --agree
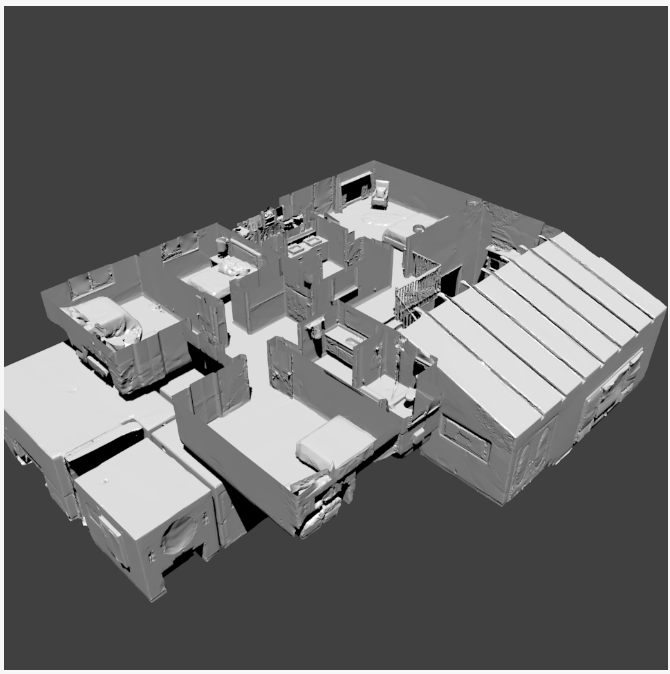
Below you can browse the data from a single sample building (out of >500 buildings in the full dataset).
See sample building (Cauthron) |
Website |
|---|---|
 |
 |
- Intro
- Downloading the Dataset
- sample building
- Data Statistics
- Image-level statistics
- Point-level statistics
- Camera-level statistics
- Model-level statistics
- Dataset Splits
- Explanation of folder structure and points
- Citation
The dataset consists of over 4.6 million images from 537 different buildings. The images are from indoor scenes. Images with people visible were exluded and we didn't include camera roll (pitch and yaw included). Below are some statistics about the images which comprise the dataset.
| Property | Mean | Distribution |
|---|---|---|
| Cameras per Point | (median) 5 | 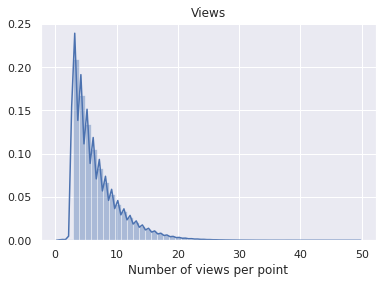 |
| Property | Mean | Distribution |
|---|---|---|
| Points/Camera | 20.8 |  |
| Property | Mean | Distribution |
|---|---|---|
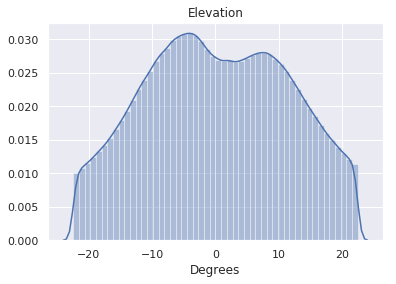
| Image Count | 0.0° |  |
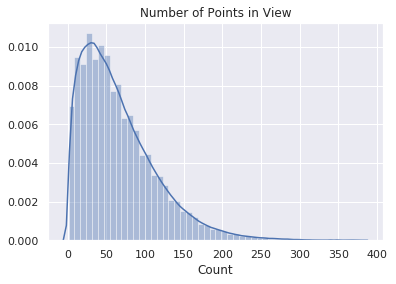
| Point Count | -0.77° |  |
| Camera Count | 75° |  |
A model, selected at random, from the training set of the paper is shared in the repository. The folder structure is described below:
class_object/
    Object classification (Imagenet 1000) annotation distilled from ResNet-152
class_scene/
    Scene classification annotations distilled from PlaceNet
depth_euclidean/
    Euclidian distance images.
           Units of 1/512m with a max range of 128m.
depth_zbuffer/
   Z-buffer depth images.
       Units of 1/512m with a max range of 128m.
edge_occlusion/
    Occlusion (3D) edge images.
edge_texture/
    2D texture edge images.
keypoints2d/
    2D keypoint heatmaps.
keypoints3d/
    3D keypoint heatmaps.
nonfixated_matches/
    All (point', view') which have line-of-sight and a view of "point" within the camera frustum
normal/
    Surface normal images.
        127-centered
points/
    Metadata about each (point, view).
    For each image, we keep track of the optical center of the image.
    This is uniquely identified by the pair (point, view).
        Contains annotations for:
             Room layout
             Vanishing point
             Point matching
             Relative camera pose esimation (fixated)
             Egomotion
        And other low-dimensional geometry tasks.
principal_curvature/
    Curvature images.
        Principal curvatures are encoded in the first two channels.
        Zero curvature is encoded as the pixel value 127
reshading/
    Images of the mesh rendered with new lighting.
rgb/
    RGB images in 512x512 resolution.
rgb_large/
    RGB images in 1024x1024 resolution.
segment_semantic/
    The semantic segmentation classes are a subset of MS COCO dataset classes. The annotations are in the form of pixel-wise object labels and are distilled from [FCIS](https://arxiv.org/pdf/1611.07709.pdf), so they should be viewed as pseudo labels, as opposed to labels done individually by human annotators (a more accurate annotation set will be released in the near future).
    The annotations have 18 unique labels, which include 16 object classes, a "background" class, and an "uncertain" class. "Background" means the FCIS classifiers were certain that those pixels belong to none of the 16 objects in the dictionary. "Uncertain" means the classifiers had too low confidence for those pixels to mark them as either an object or the background -- so they could belong to any class and they should be masked during learning to not contribute to the loss in a positive or negative way.
    The classes "0" and "1" mark "uncertain" and "background" pixels, respectively. The rest of the classes are specified in [this file](https://github.com/StanfordVL/taskonomy/blob/master/taskbank/assets/web_assets/pseudosemantics/coco_selected_classes.txt).
segment_unsup2d/
   Pixel-level unsupervised superpixel annotations based on RGB.
segment_unsup25d/
    Pixel-level unsupervised superpixel annotations based on RGB + Normals + Depth + Curvature.
We provide standard train/validation/test splits for the dataset to standardize future benchmarkings. The split files can be accessed here. Given the large size of the full dataset, we provide the standard splits for 4 partitions (Tiny, Medium, Full, Full+) with increasing sizes (see below) which the users can employ based on their storage and computation resources. Full+ is inclusive of Full, Full is inclusive of Medium, and Medium is inclusive of Tiny. The table below shows the number of buildings in each partition.
| Split Name | Train | Val | Test | Total |
|---|---|---|---|---|
| Tiny | 25 | 5 | 5 | 35 |
| Medium | 98 | 20 | 20 | 138 |
| Full | 344 | 67 | 71 | 482 |
| Full+ | 381 | 75 | 81 | 537 |
If you find the code, data, or the models useful, please cite this paper:
@inproceedings{zamir2018taskonomy,
  title={Taskonomy: Disentangling Task Transfer Learning},
  author={Zamir, Amir R and Sax, Alexander and Shen, William B and Guibas, Leonidas and Malik, Jitendra and Savarese, Silvio},
  booktitle={2018 IEEE Conference on Computer Vision and Pattern Recognition (CVPR)},
  year={2018},
  organization={IEEE}
}

