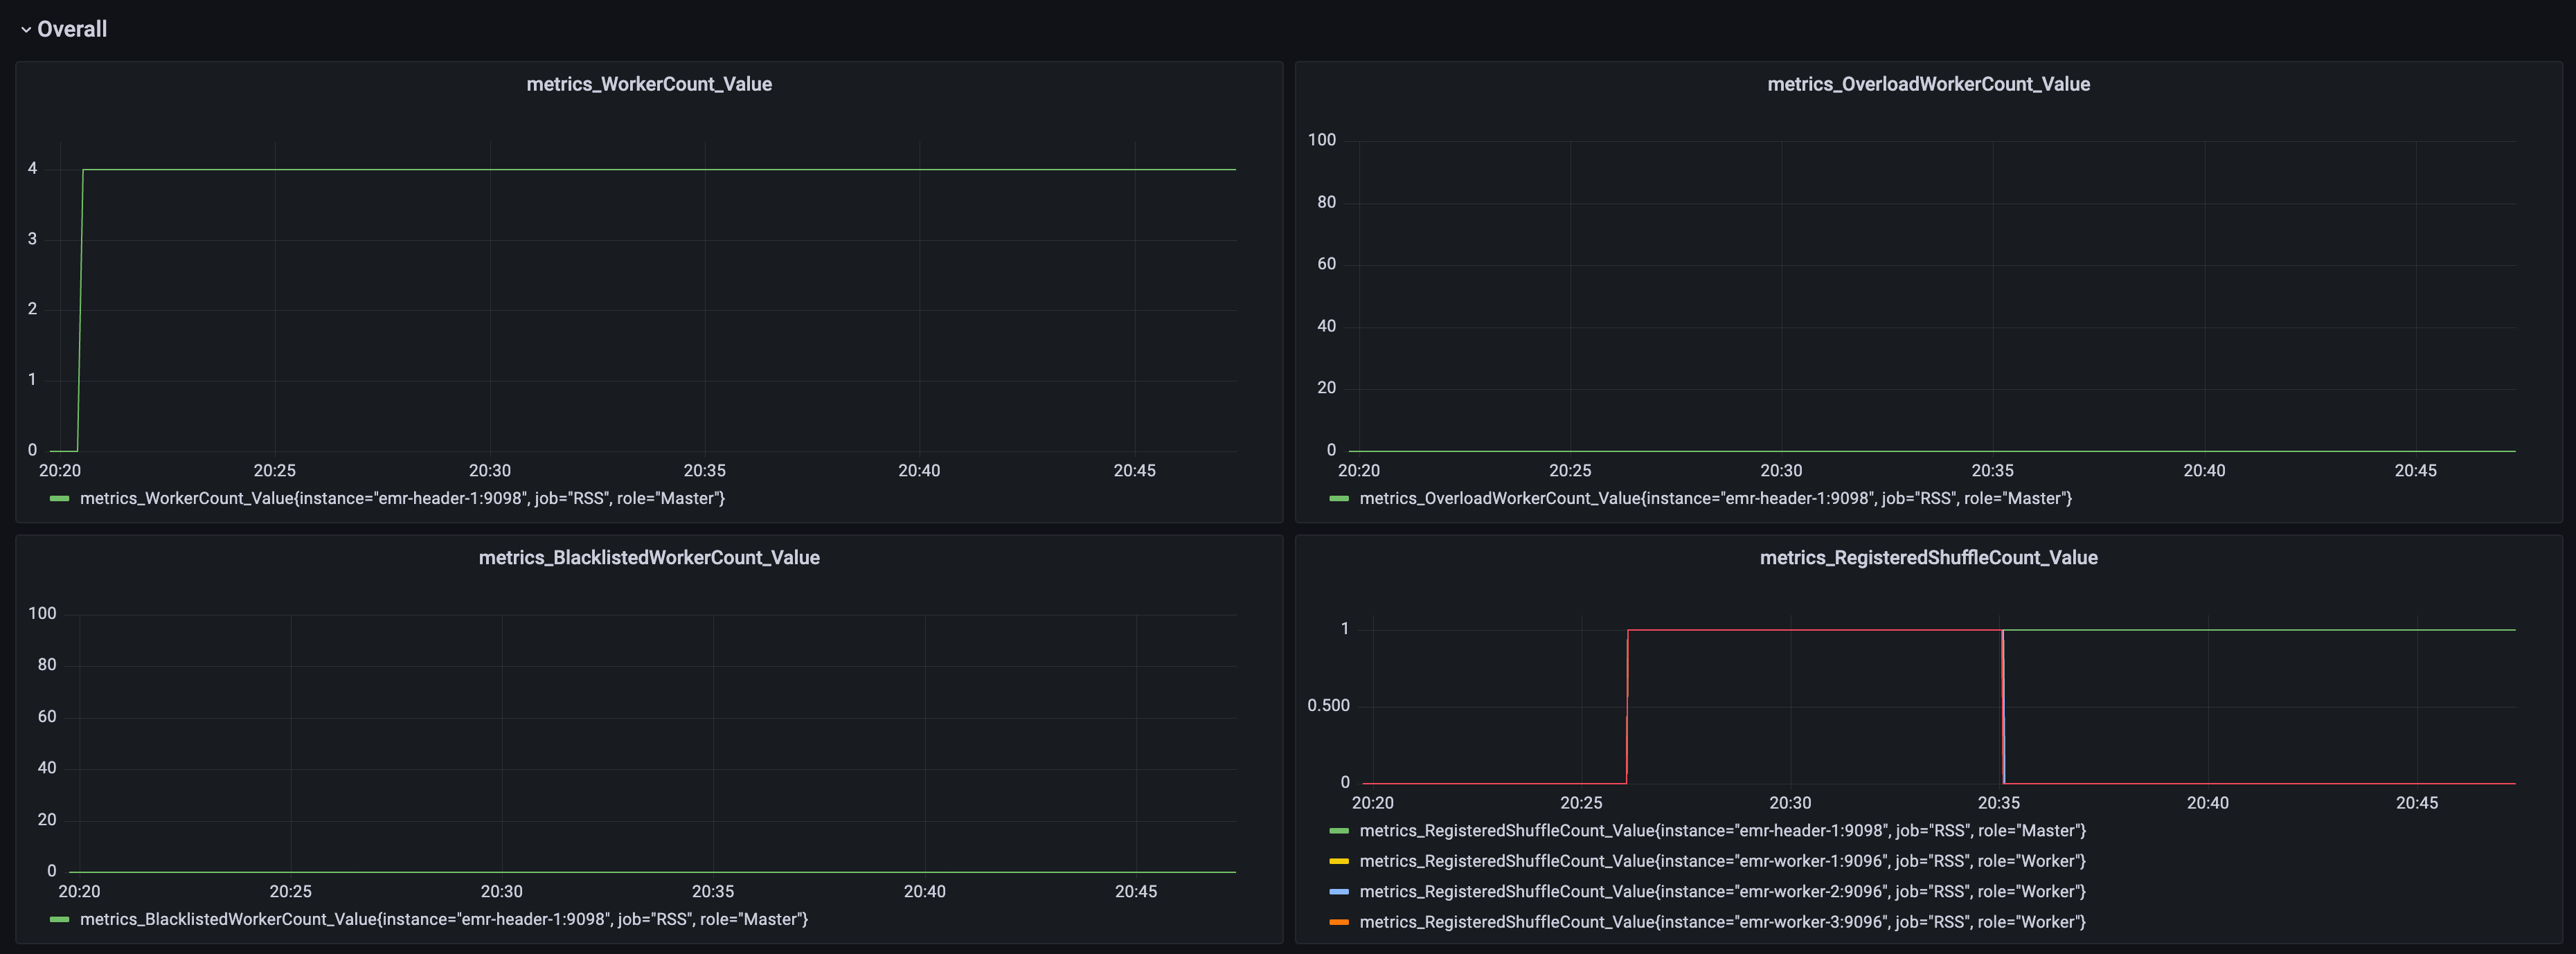
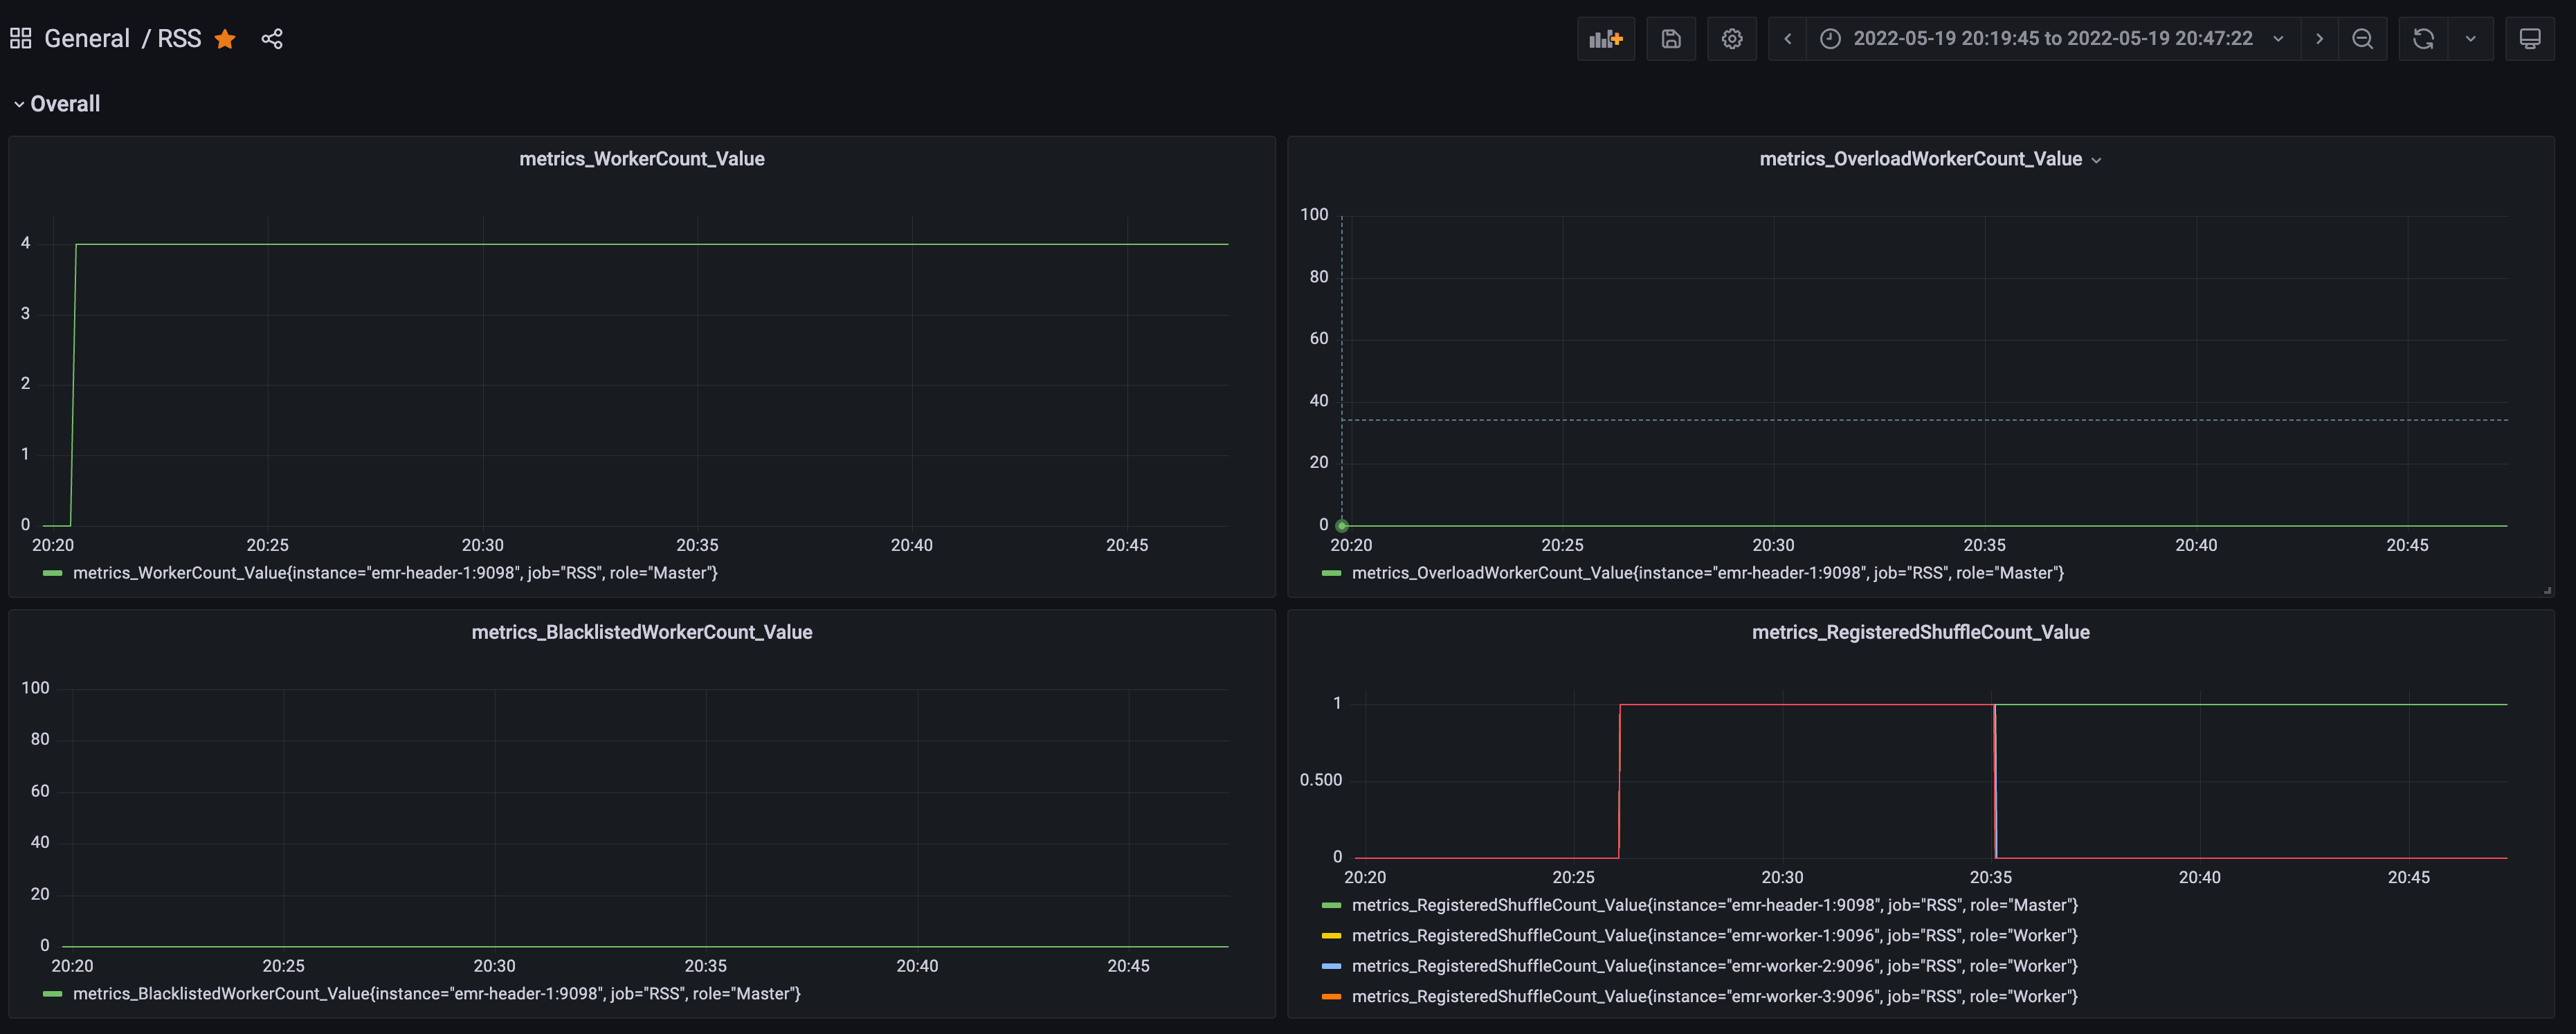
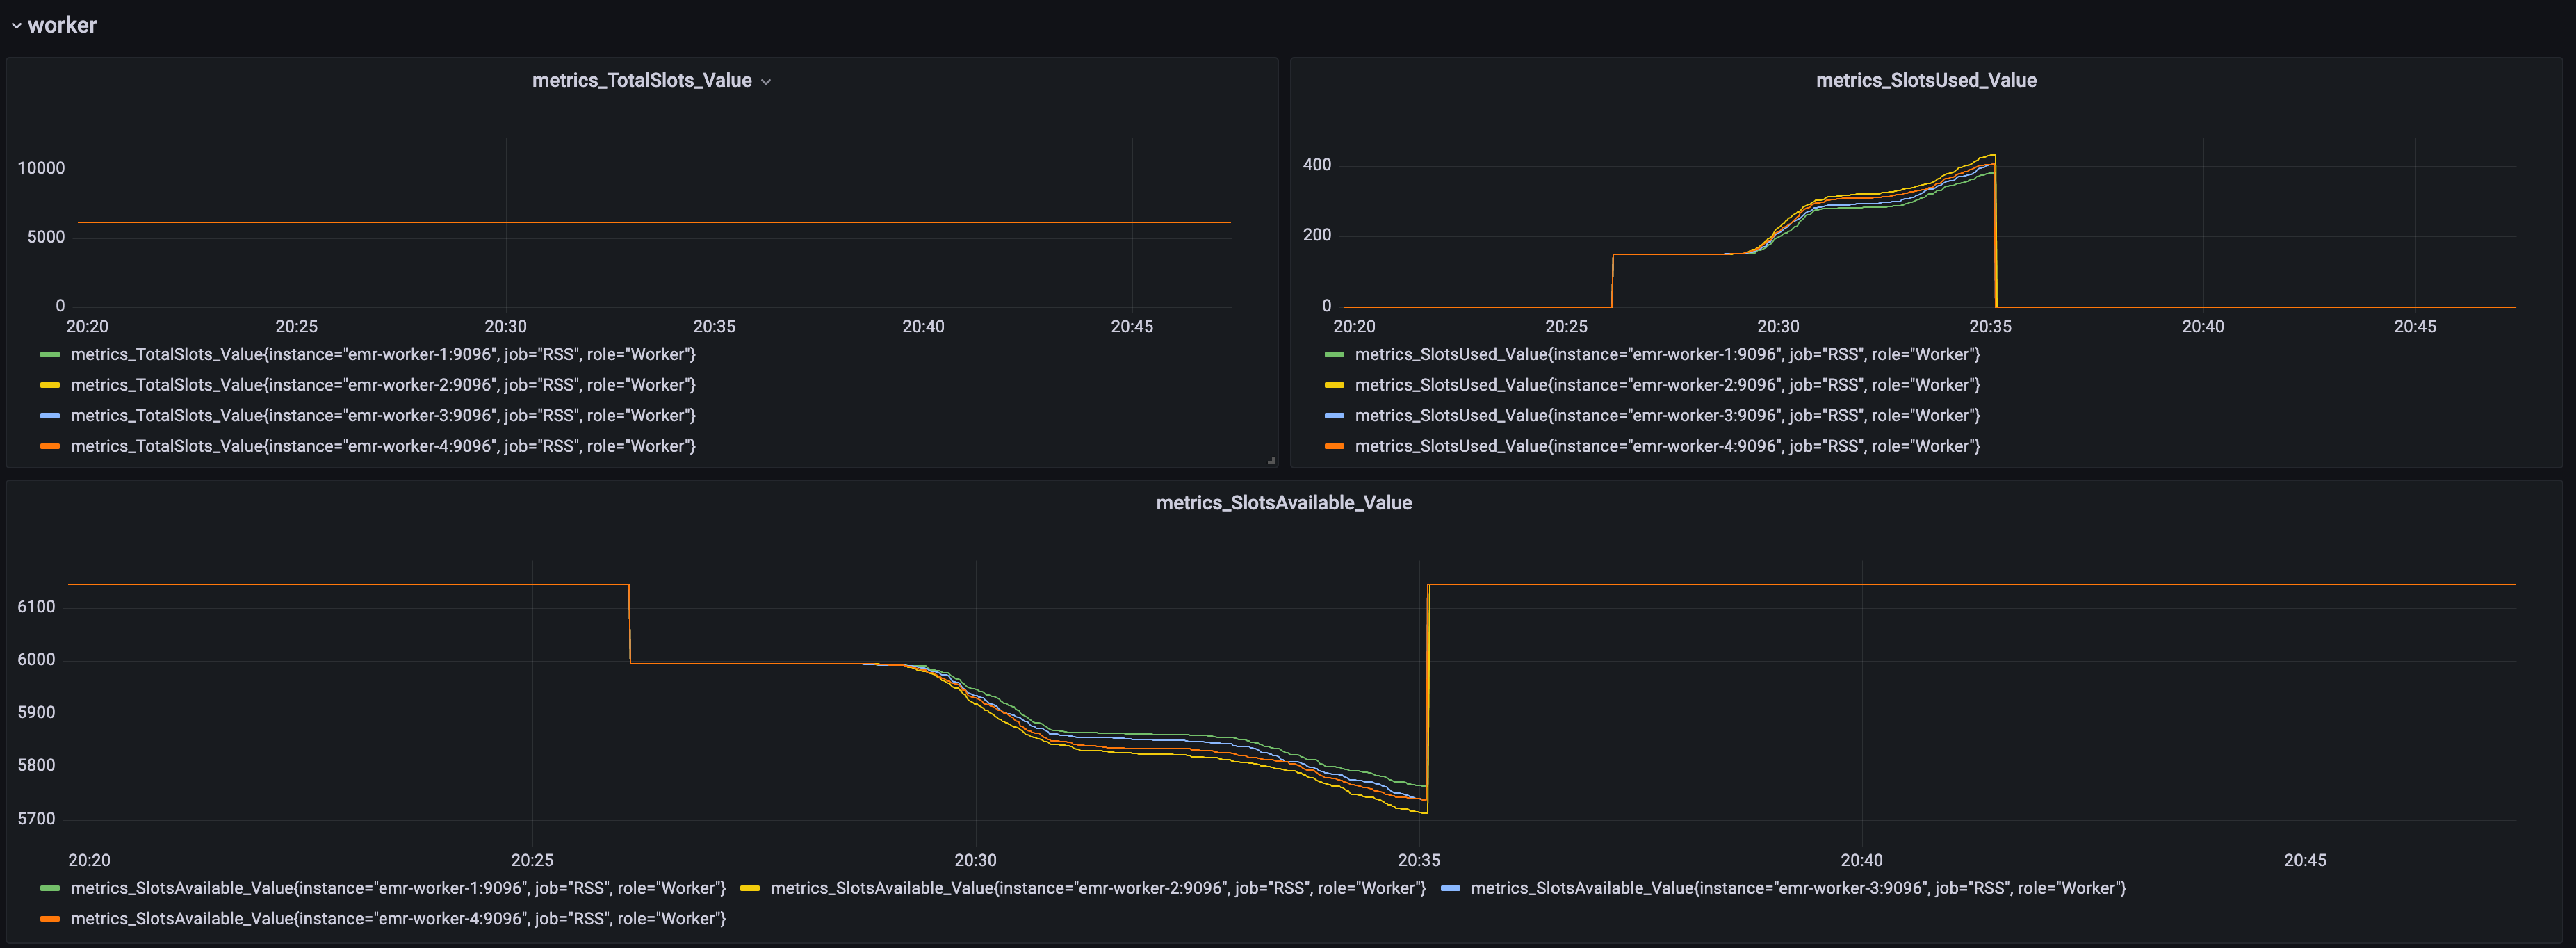
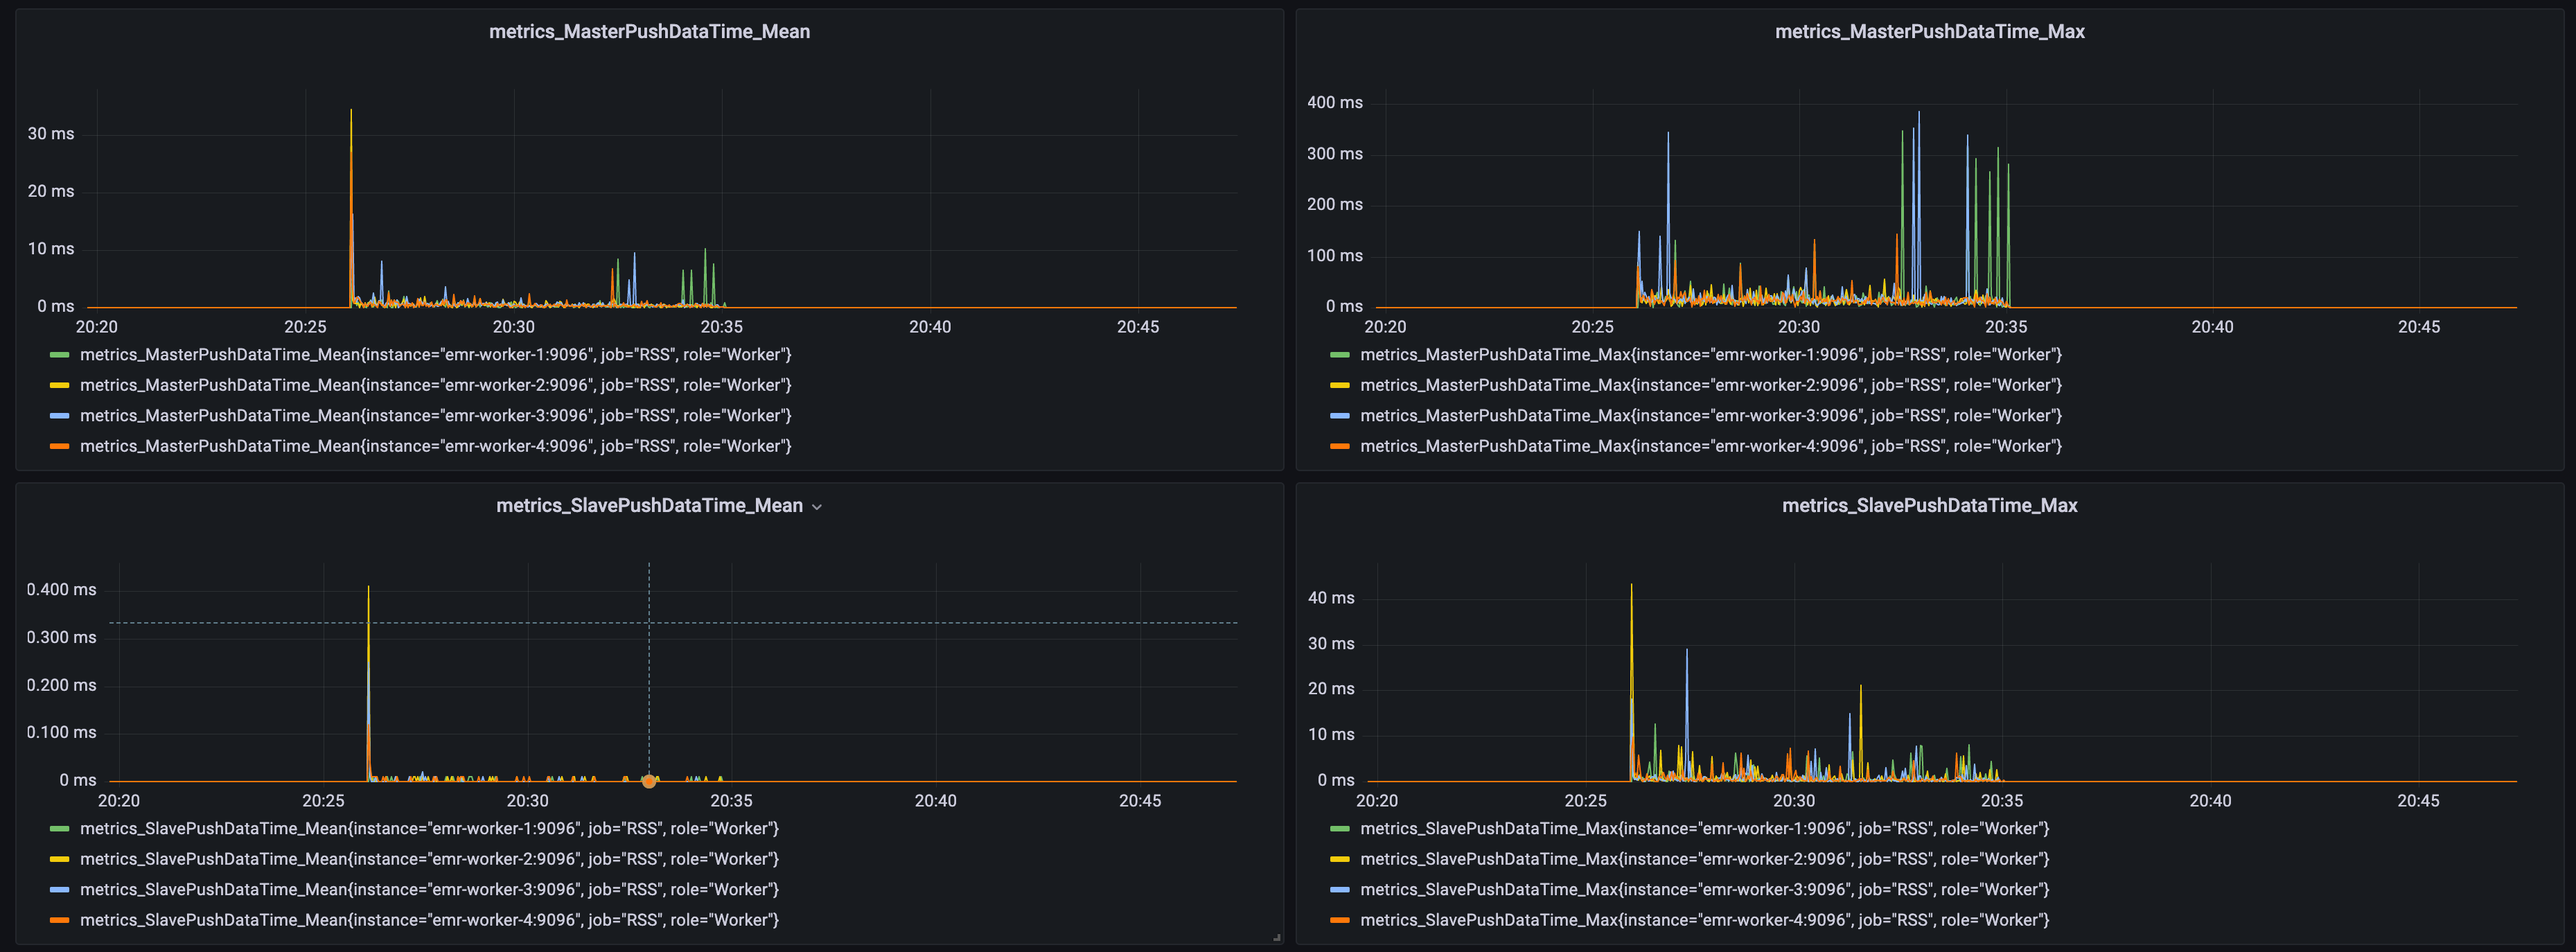
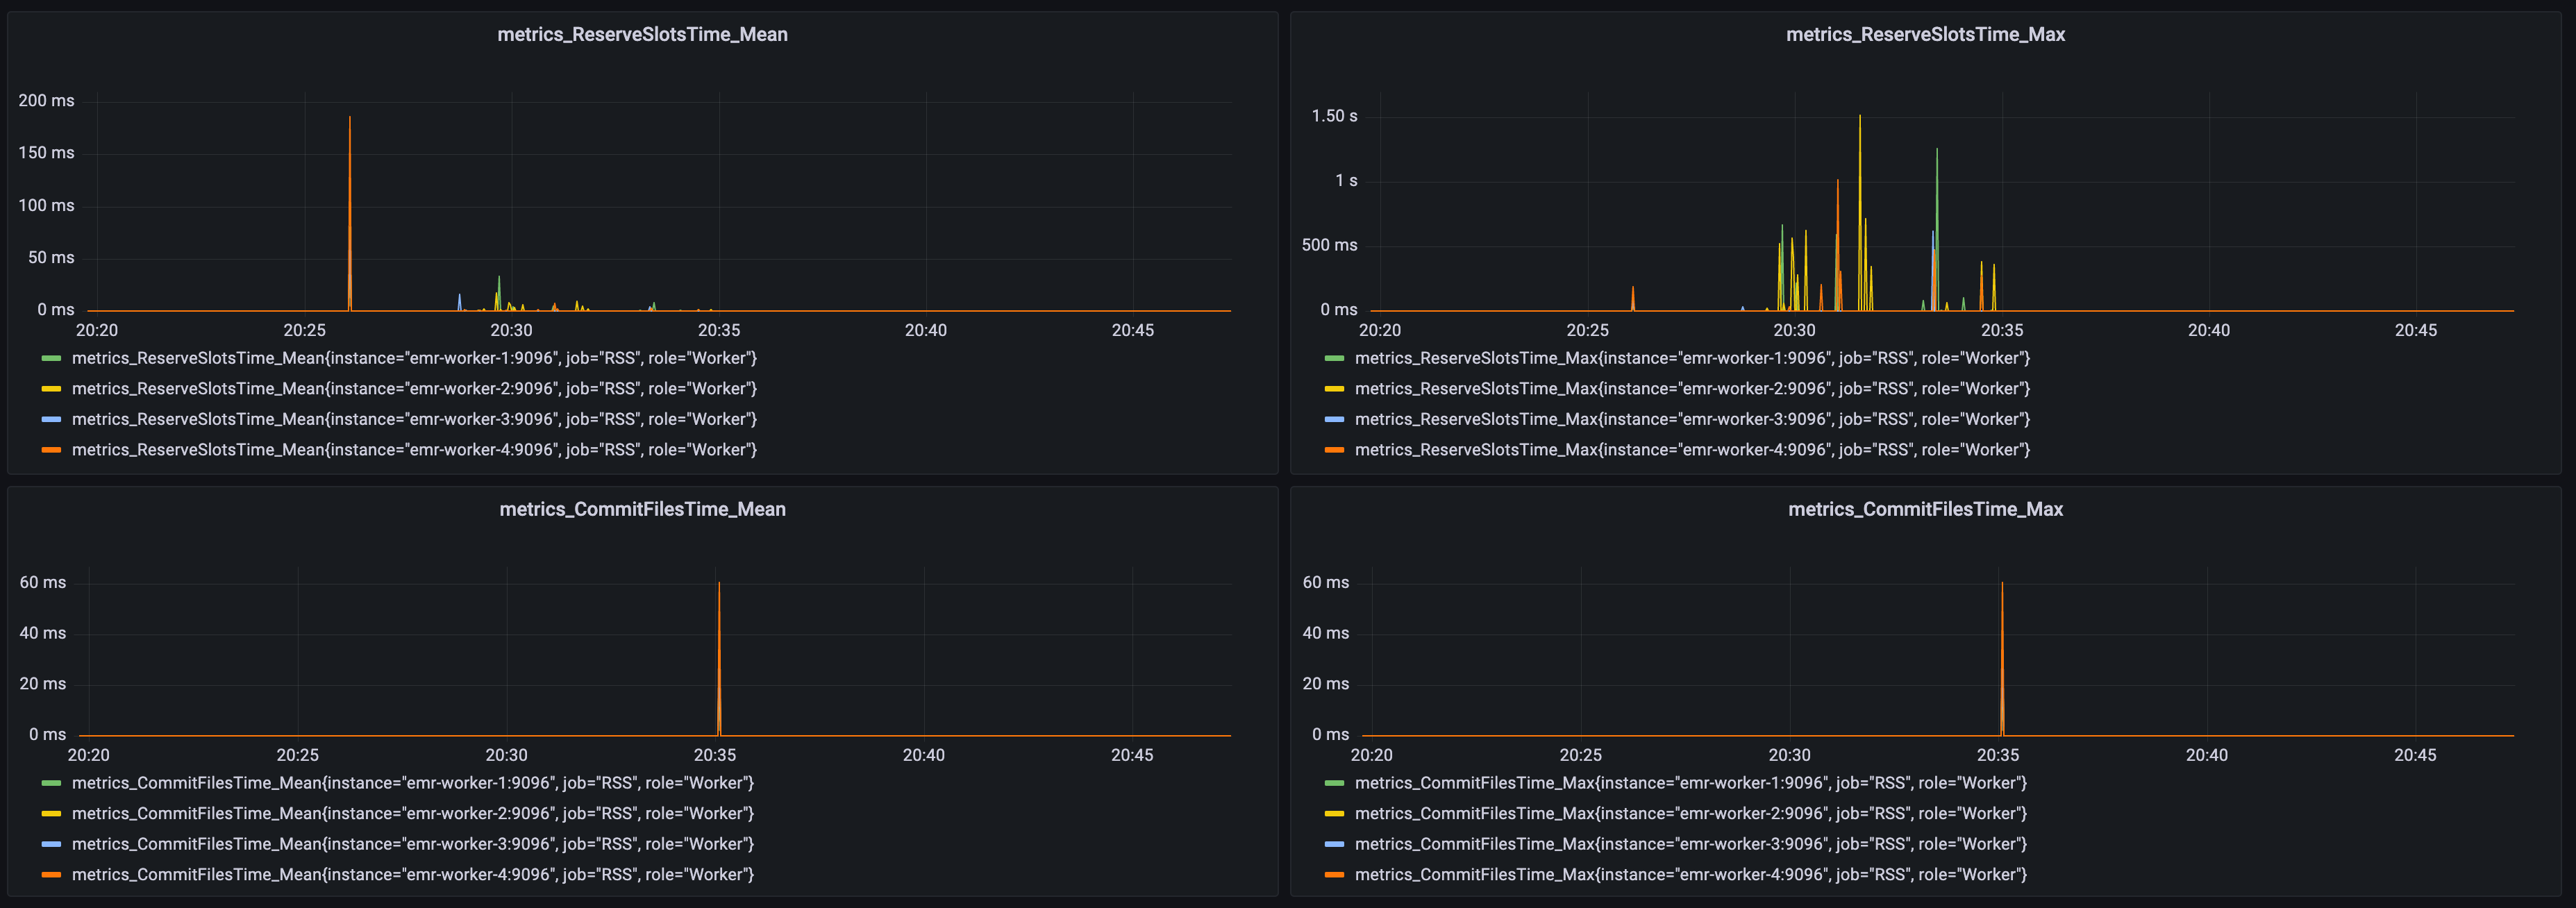
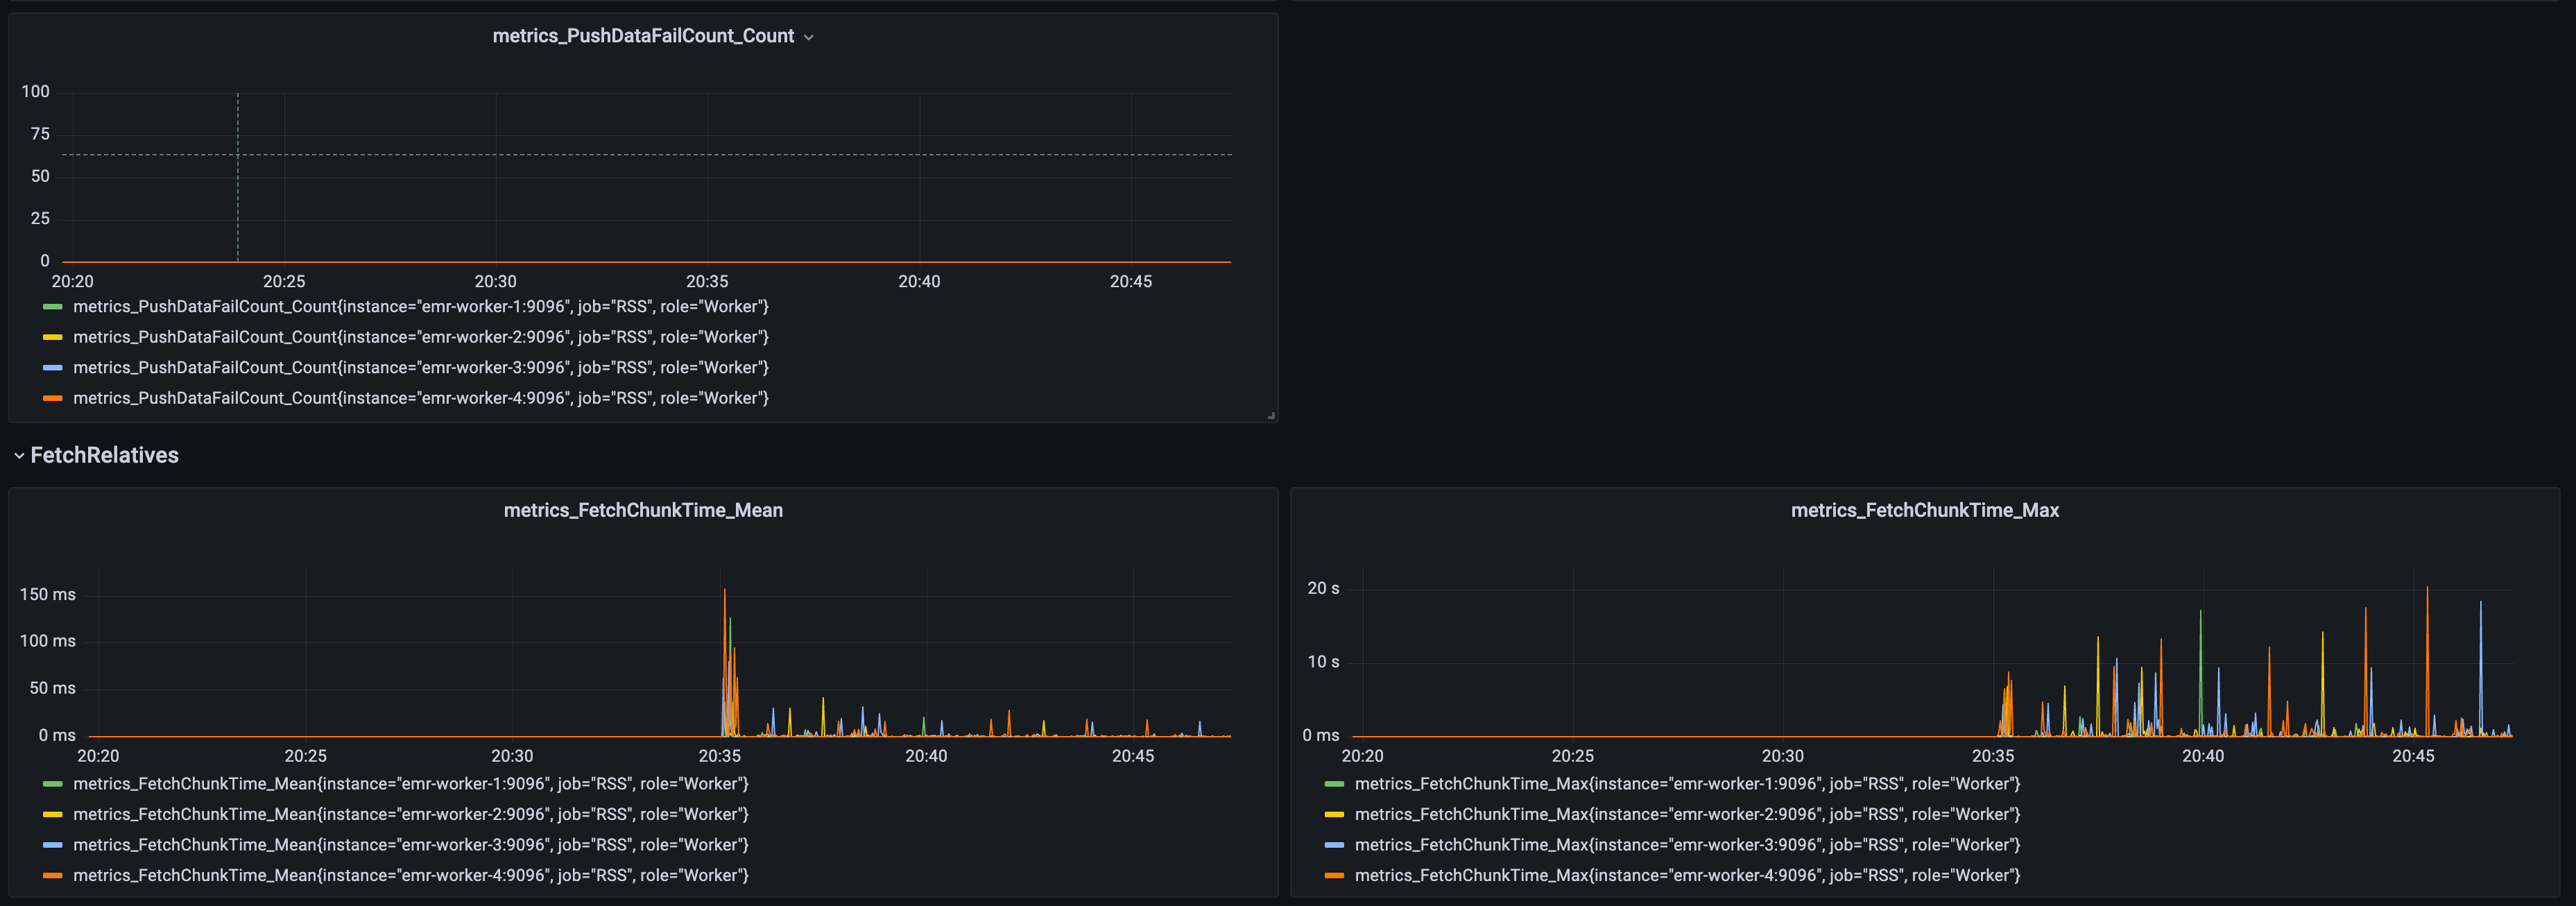
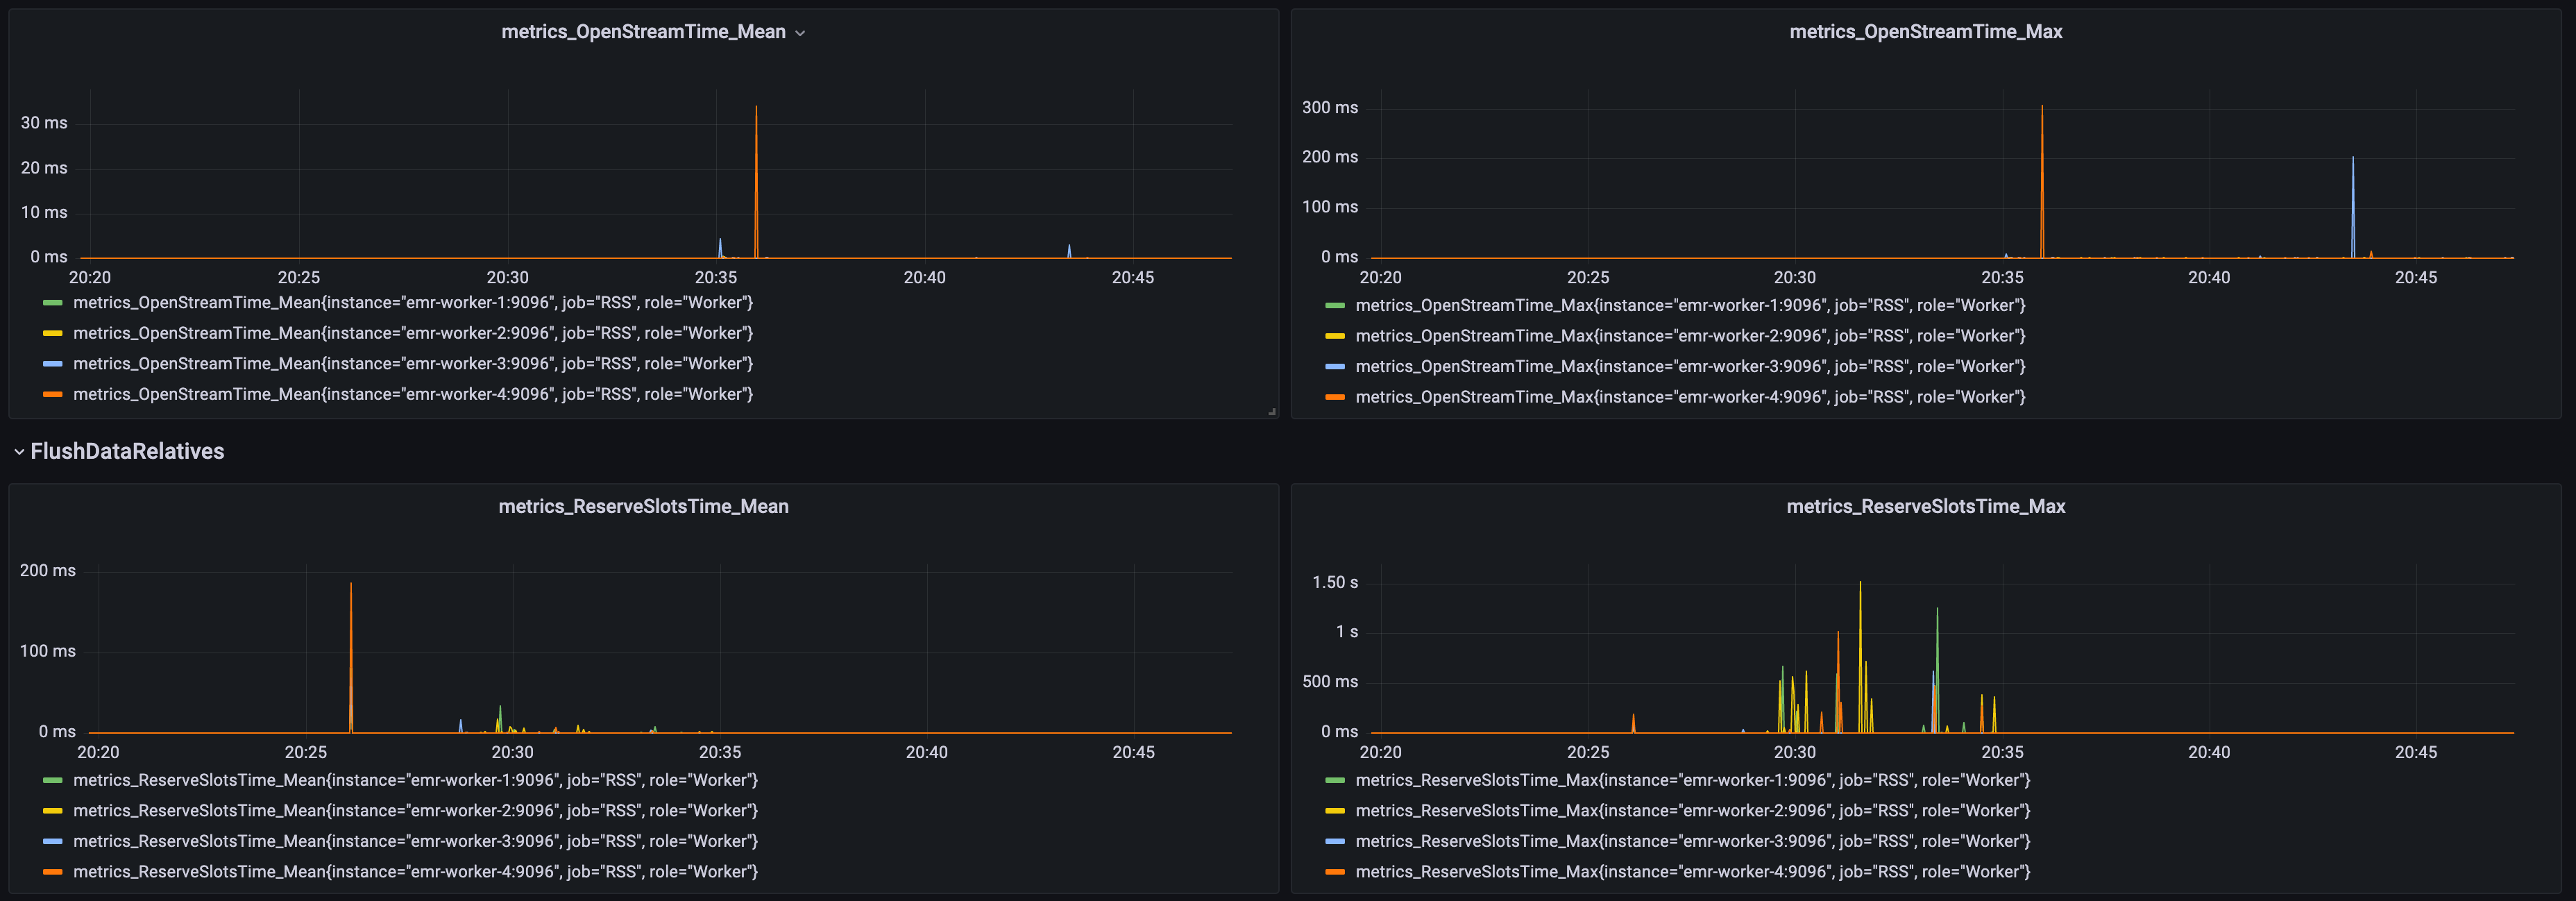
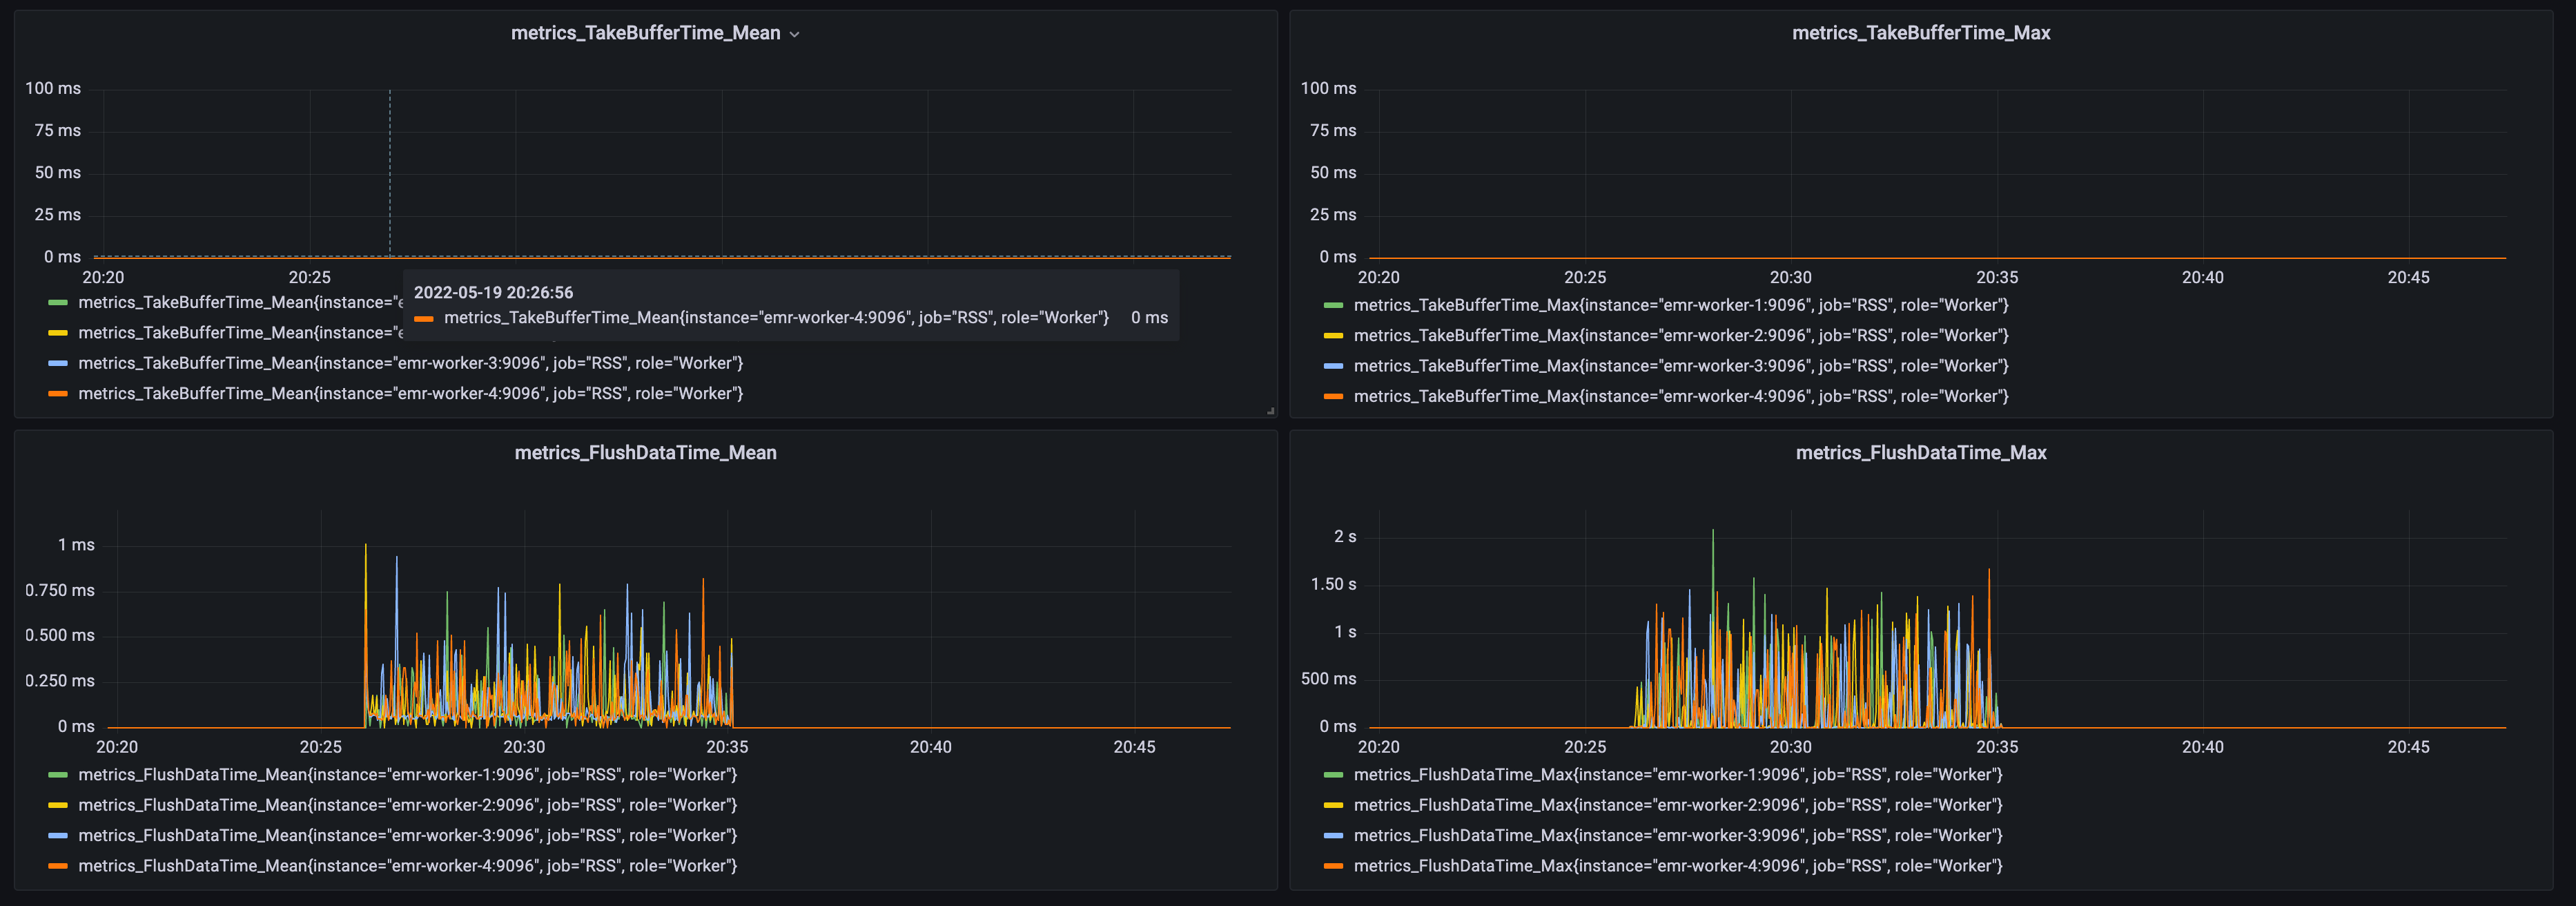
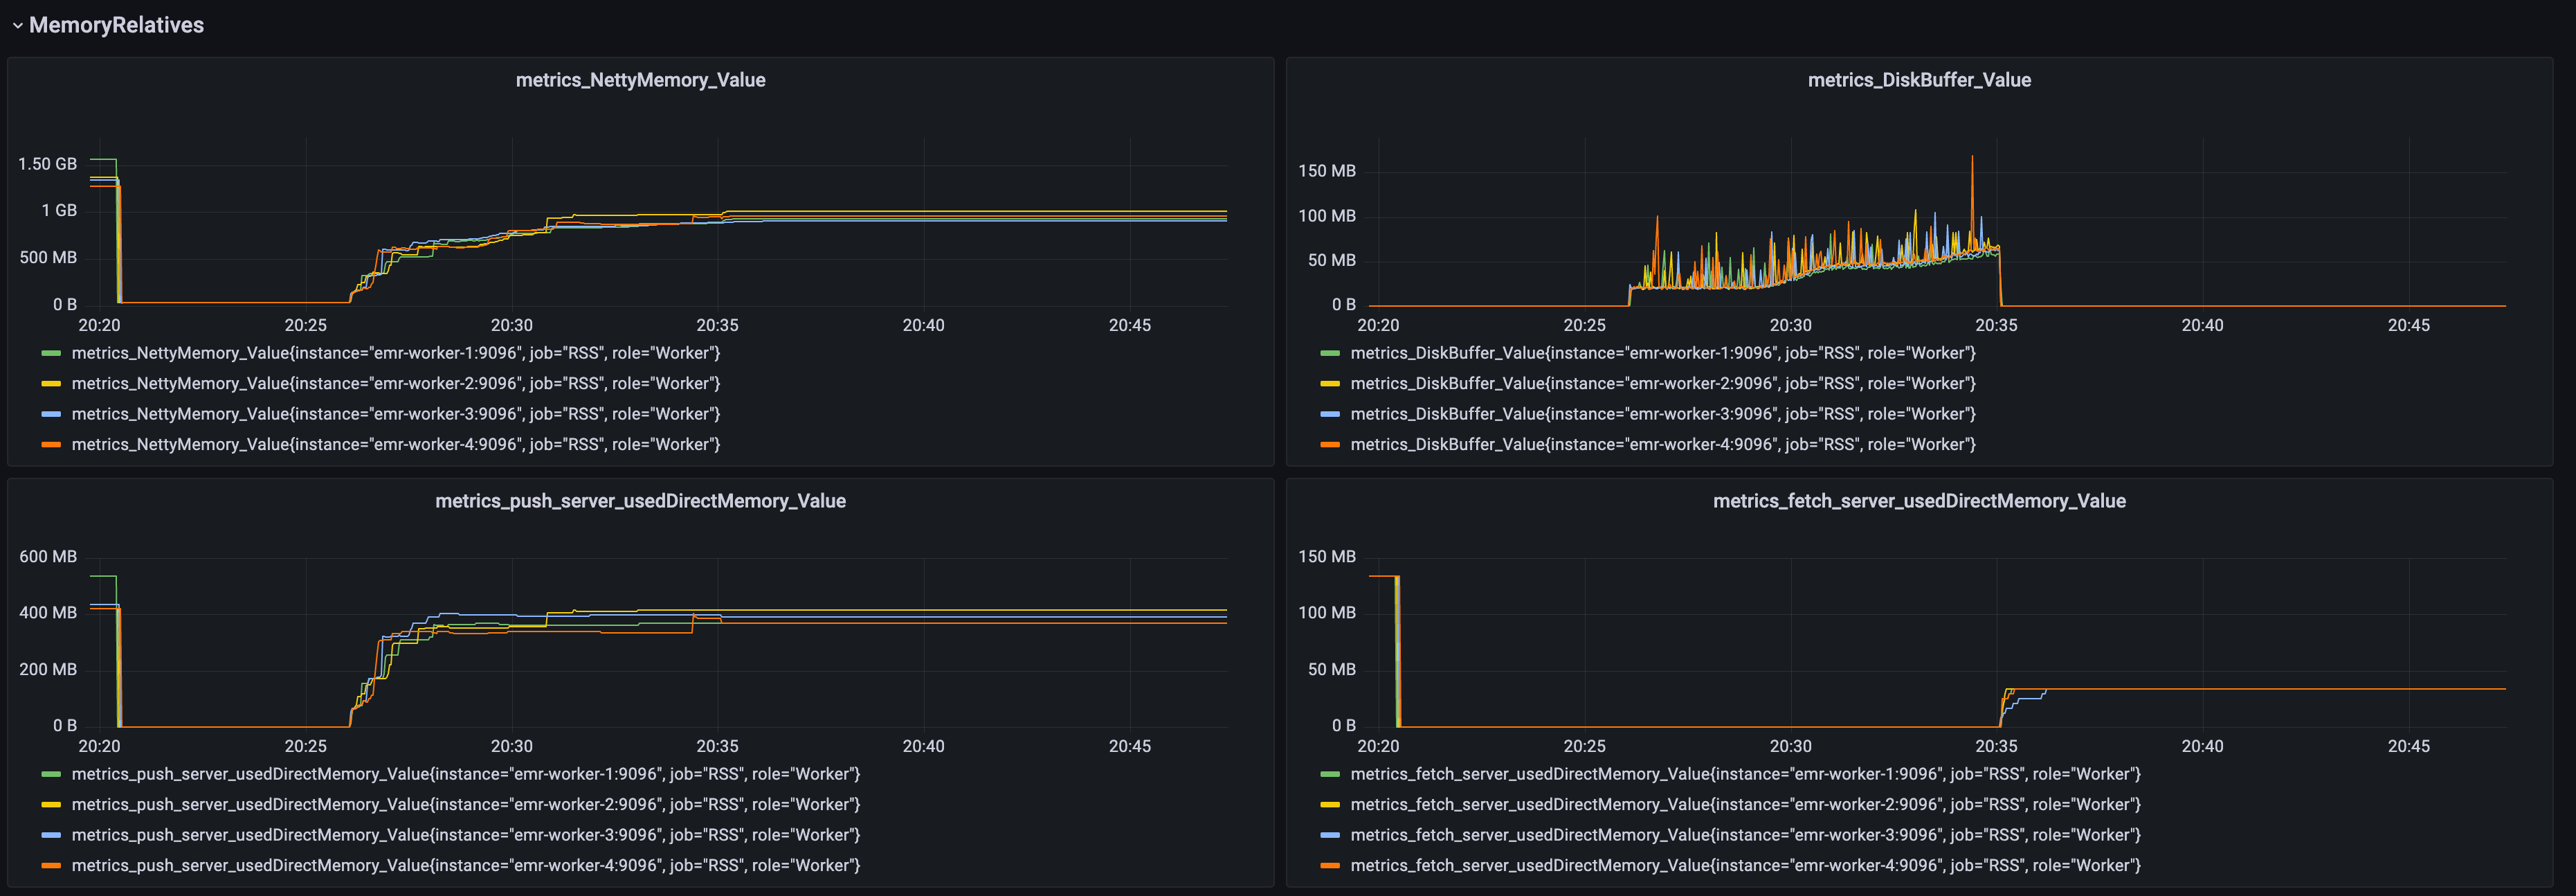
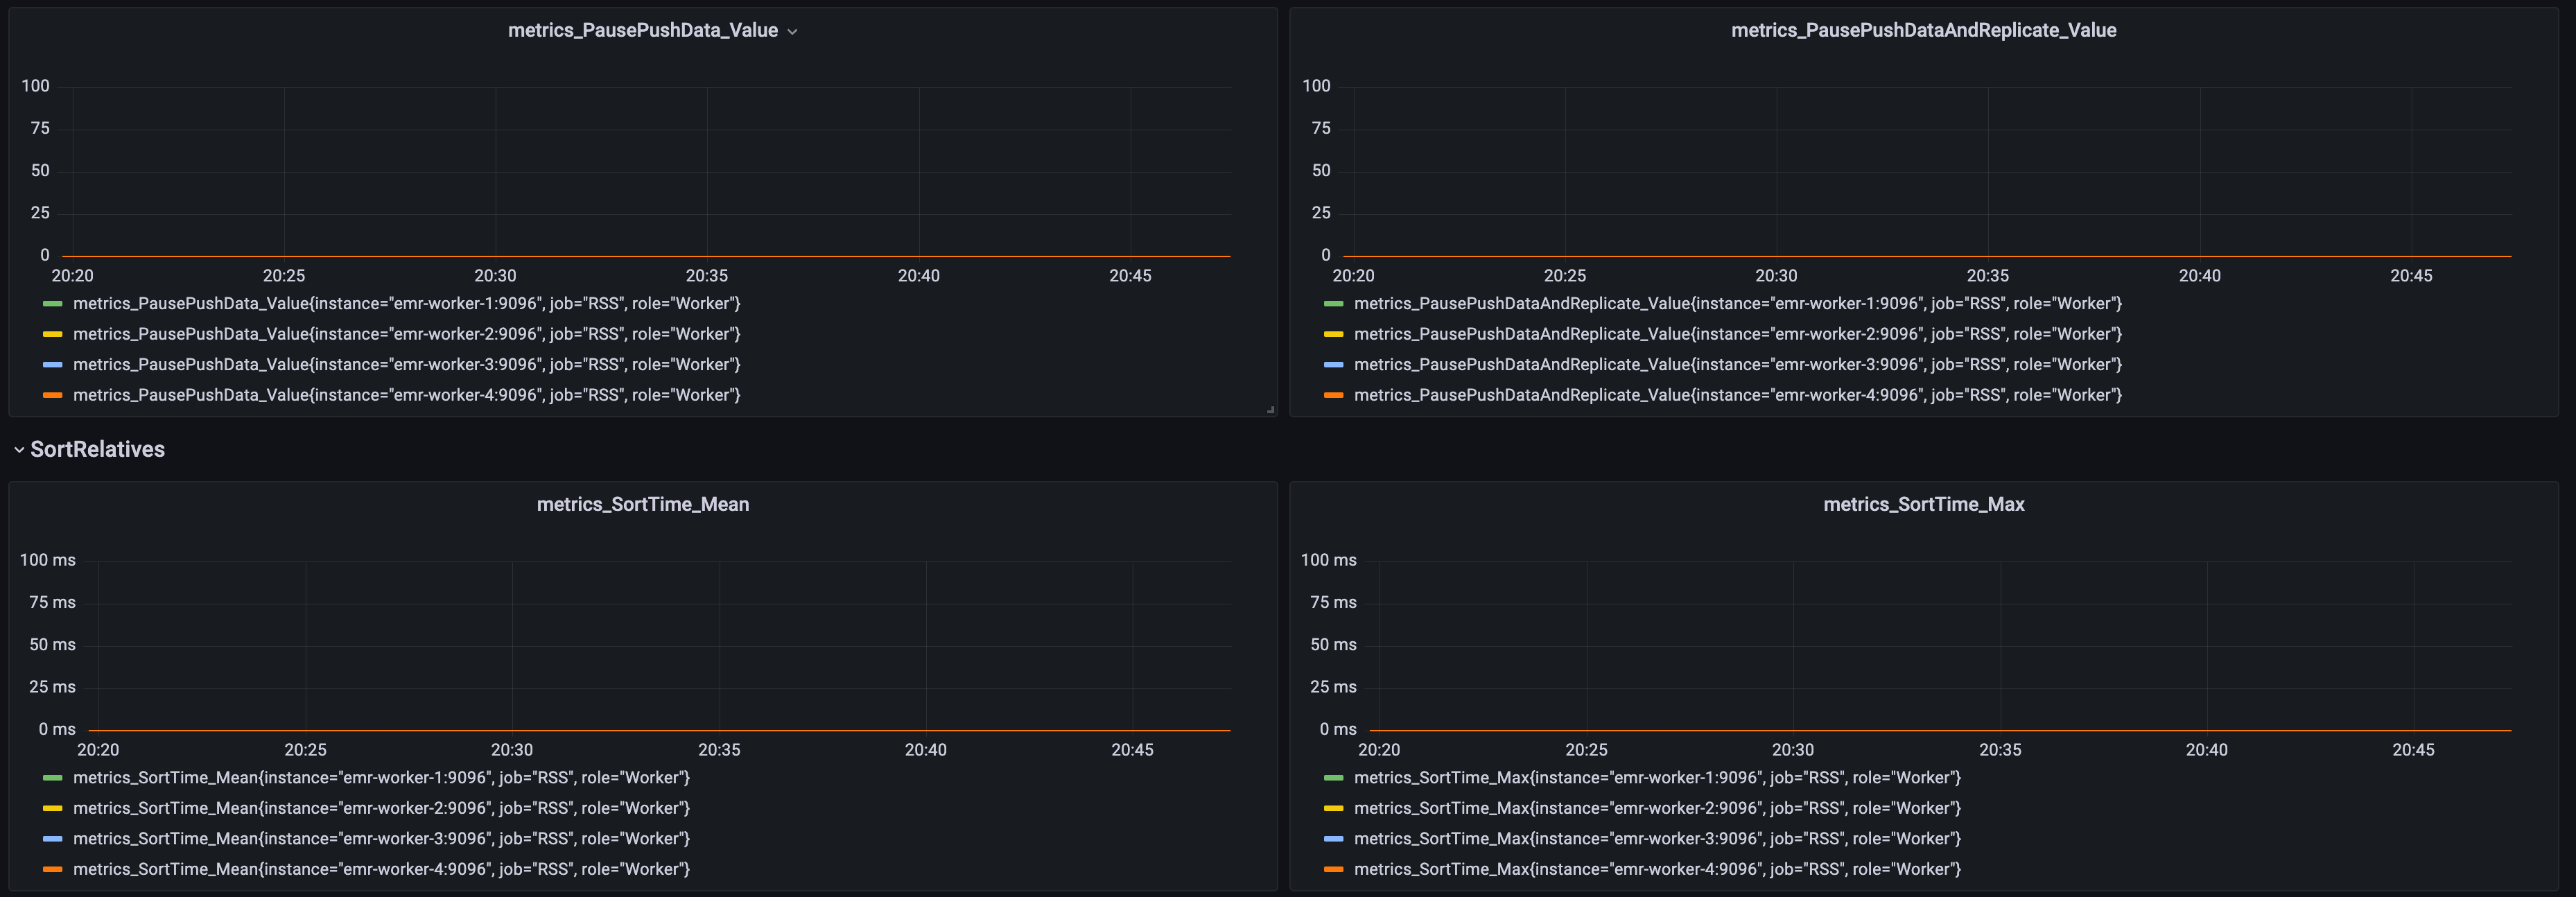
We provide various metrics about memory, disk, and important procedures. These metrics could help identify performance issue or monitor Celeborn cluster.
1.Enable Celeborn metrics.
set celeborn.metrics.enabled = true
2.You need to install prometheus(https://prometheus.io/)
We provide an example for prometheus config file
# prometheus example config
global:
  scrape_interval: 15s
  evaluation_interval: 15s

scrape_configs:
  - job_name: "Celeborn"
    metrics_path: /metrics/prometheus
    scrape_interval: 15s
    static_configs:
      - targets: [ "master-ip:9098","worker1-ip:9096","worker2-ip:9096","worker3-ip:9096","worker4-ip:9096" ]
3.You need to install Grafana server(https://grafana.com/grafana/download)
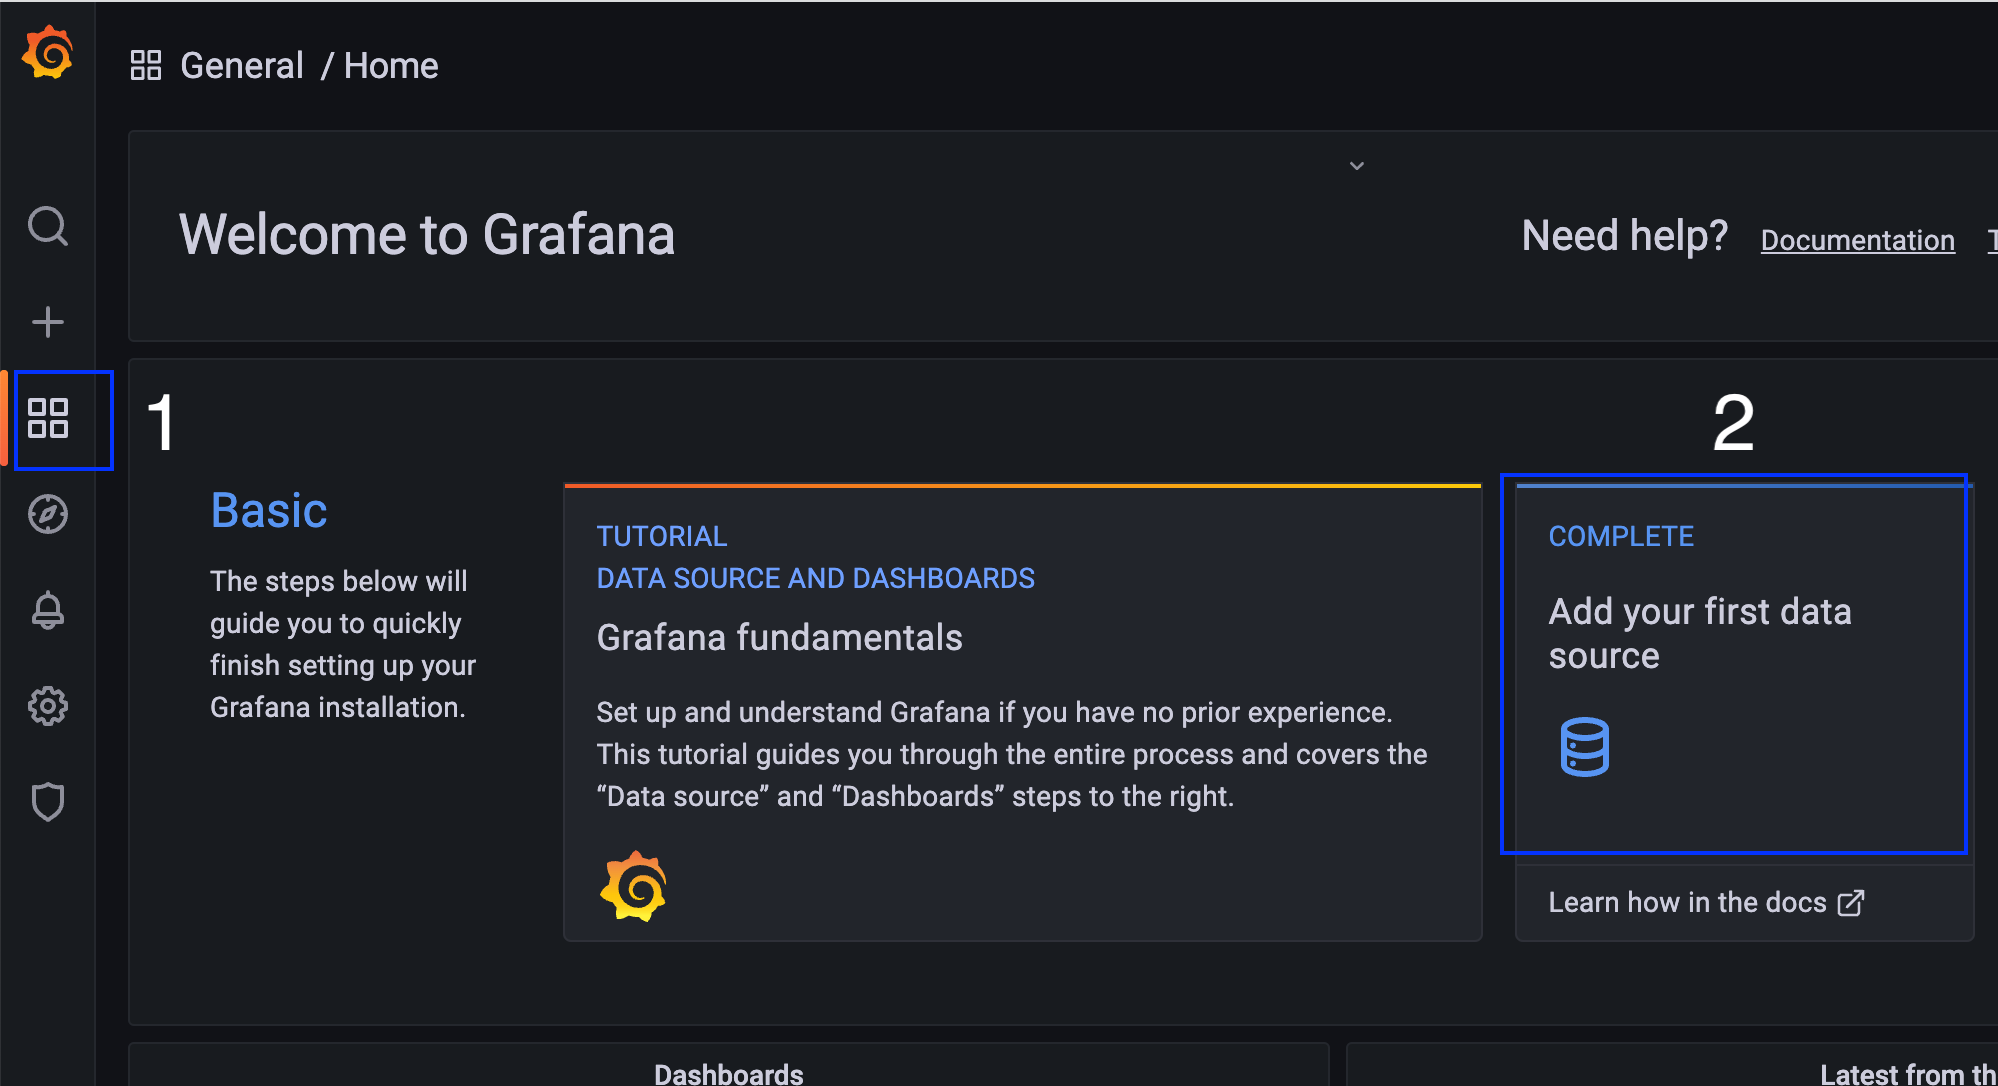
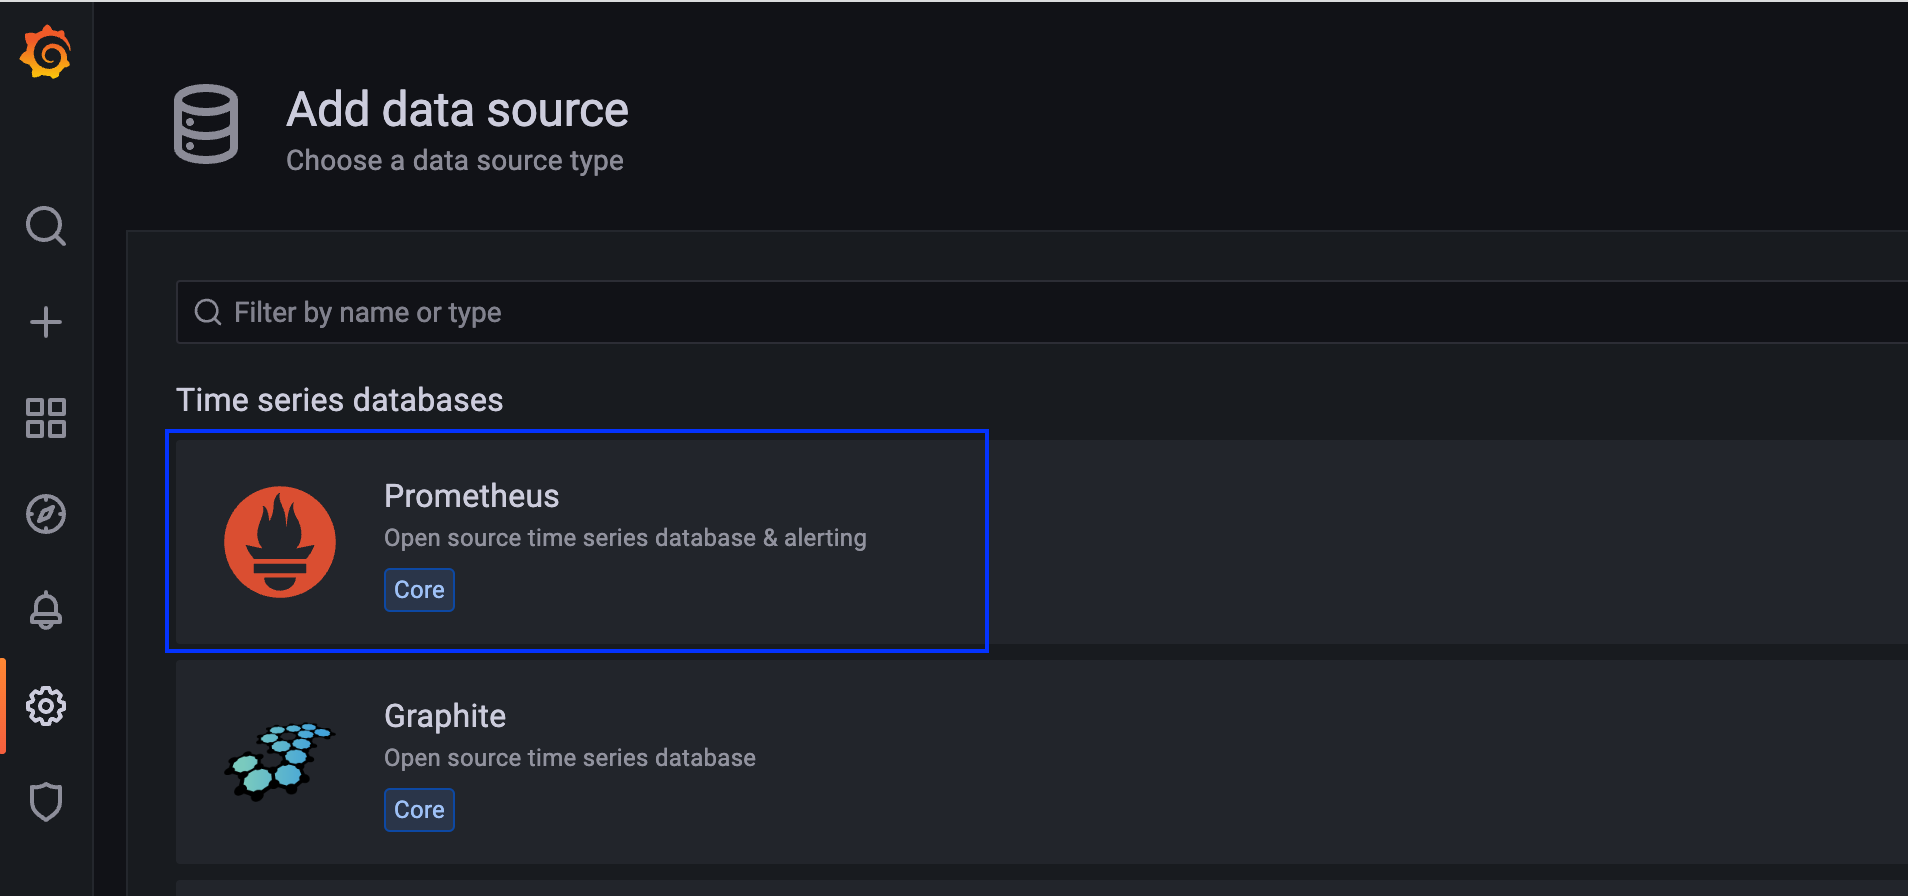
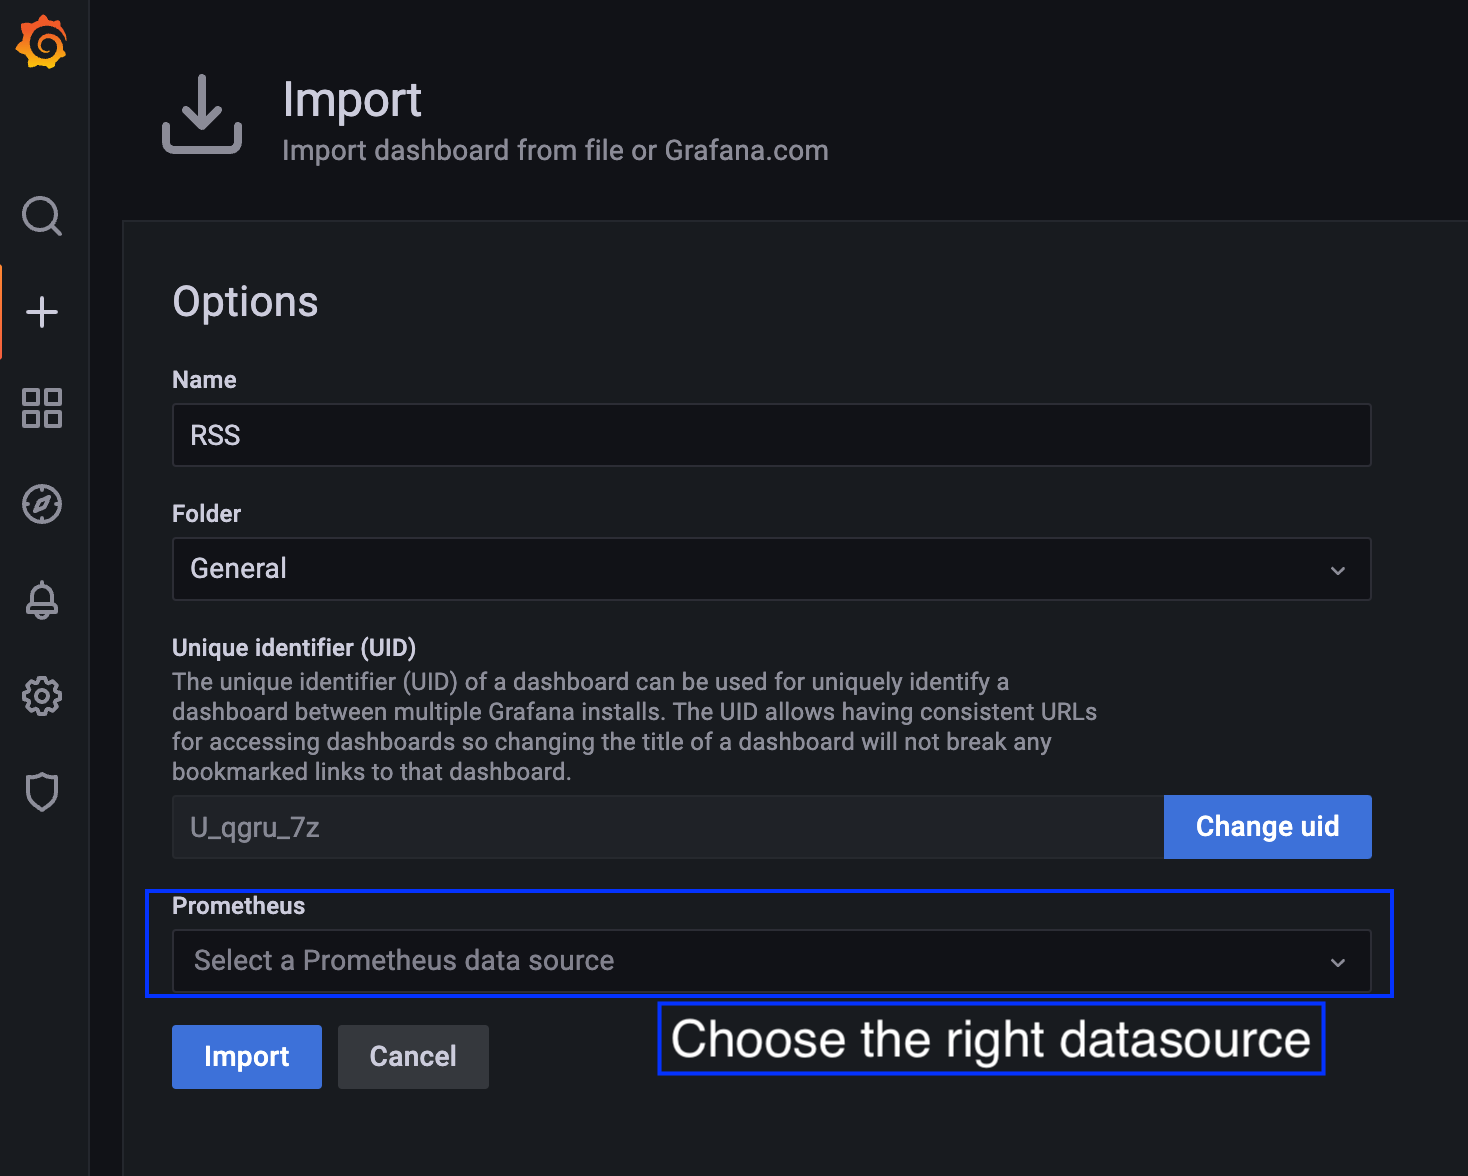
4.Import Celeborn dashboard into grafana. You can find Celeborn dashboard at assets/grafana/rss-dashboard.json.
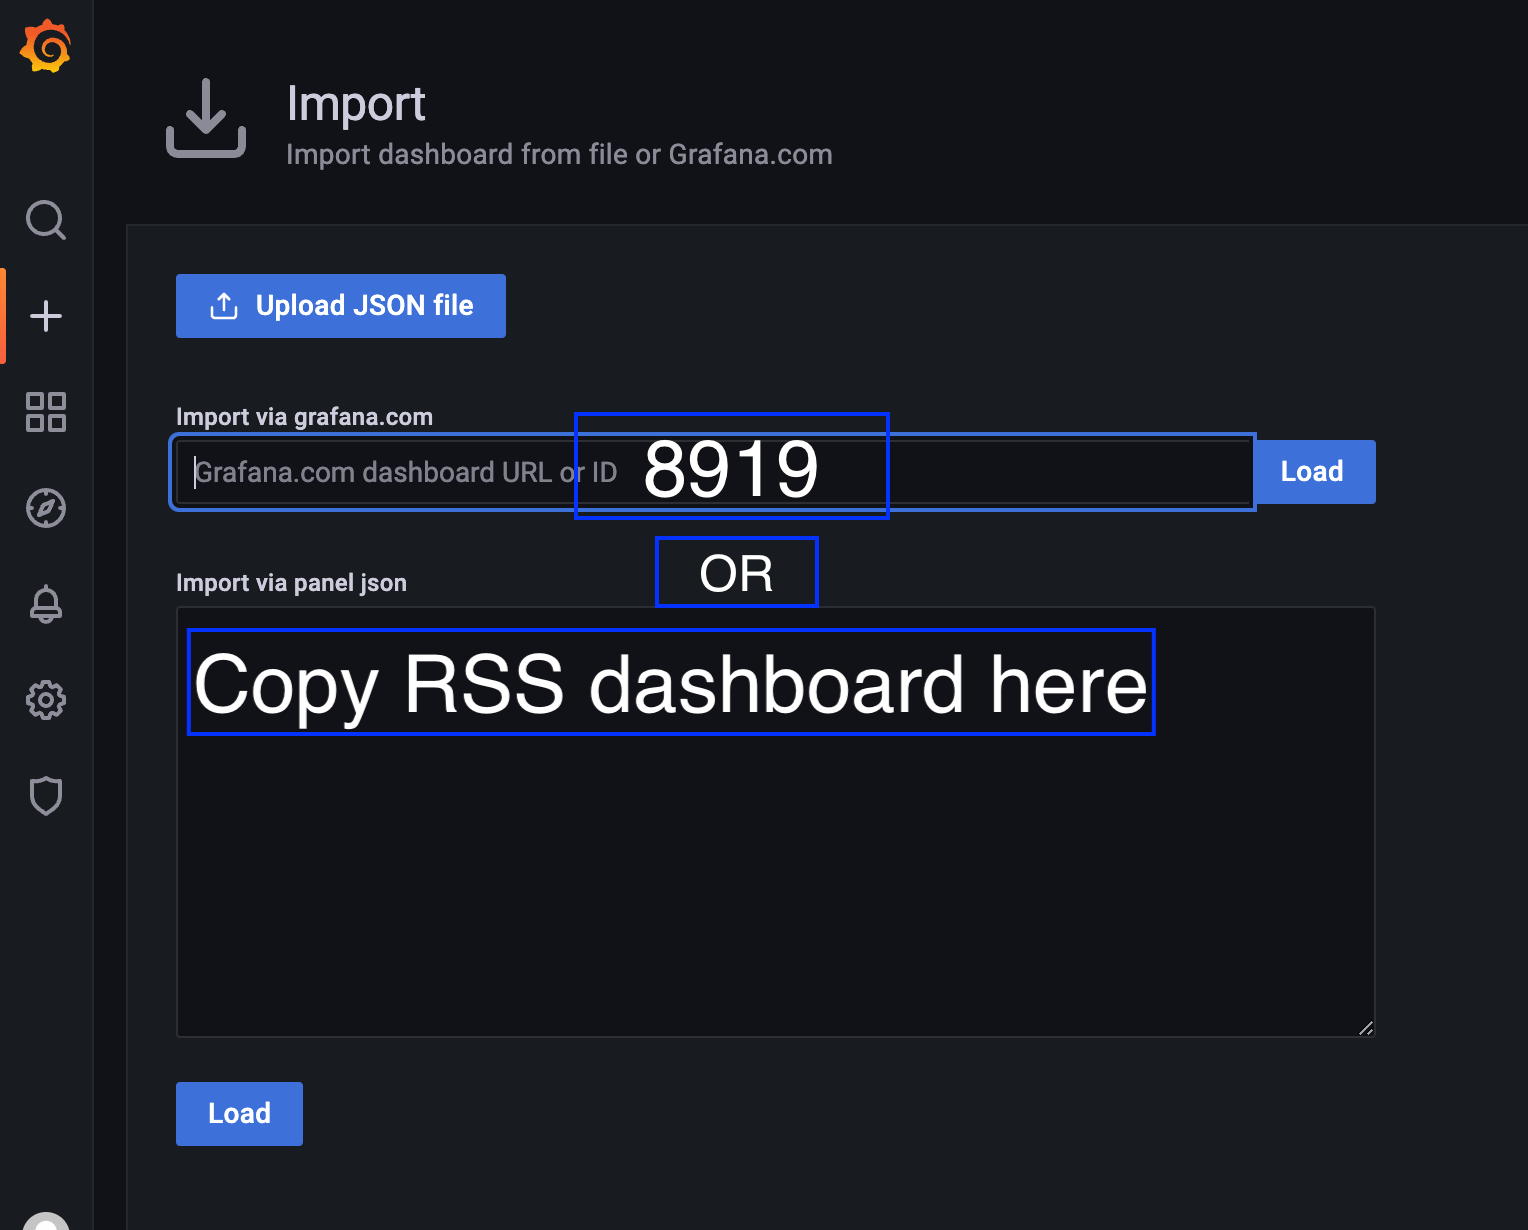
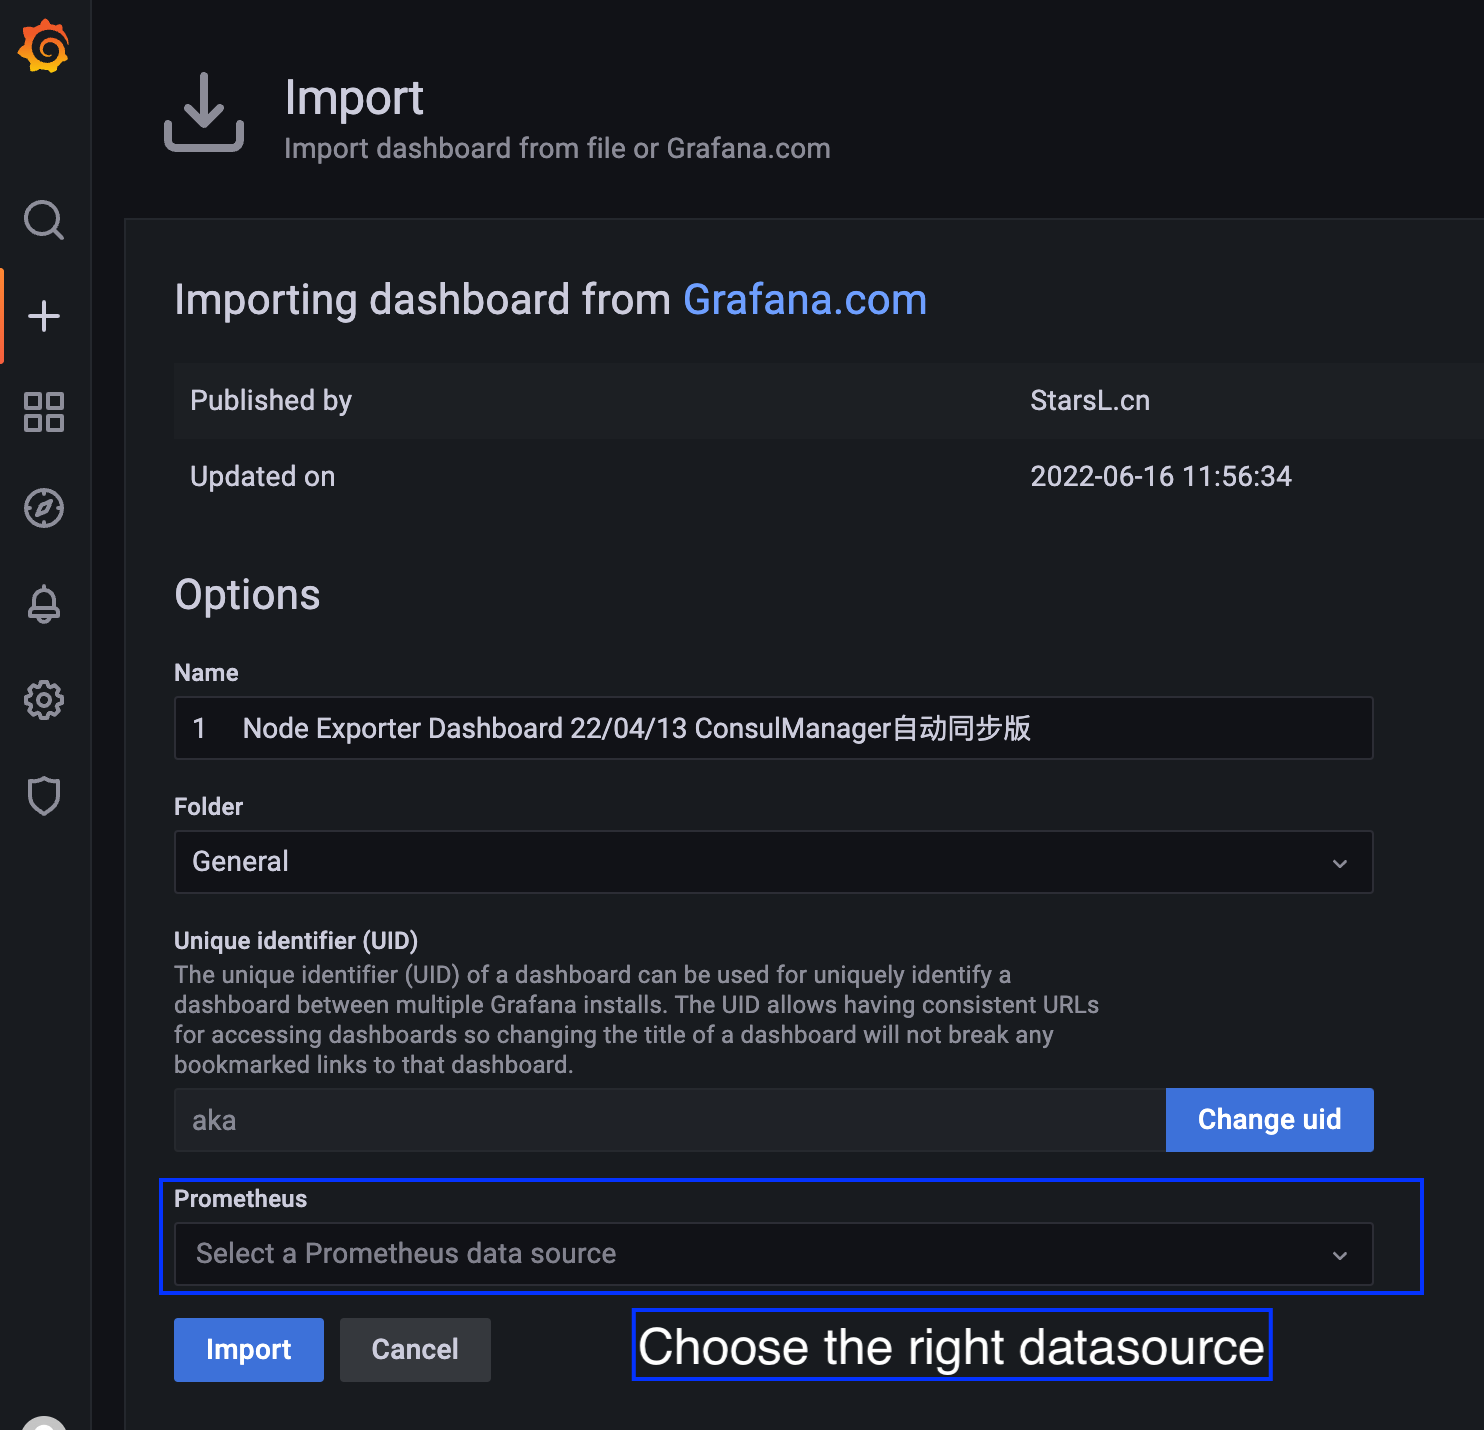
We recommend you to install node exporter (https://github.com/prometheus/node_exporter) on every host, and configure prometheus to scrape information about the host. Grafana will need a dashboard (dashboard id:8919) to display host details.
global:
  scrape_interval: 15s
  evaluation_interval: 15s

scrape_configs:
  - job_name: "Celeborn"
    metrics_path: /metrics/prometheus
    scrape_interval: 15s
    static_configs:
      - targets: [ "master-ip:9098","worker1-ip:9096","worker2-ip:9096","worker3-ip:9096","worker4-ip:9096" ]
  - job_name: "node"
    static_configs:
      - targets: [ "master-ip:9100","worker1-ip:9100","worker2-ip:9100","worker3-ip:9100","worker4-ip:9100" ]
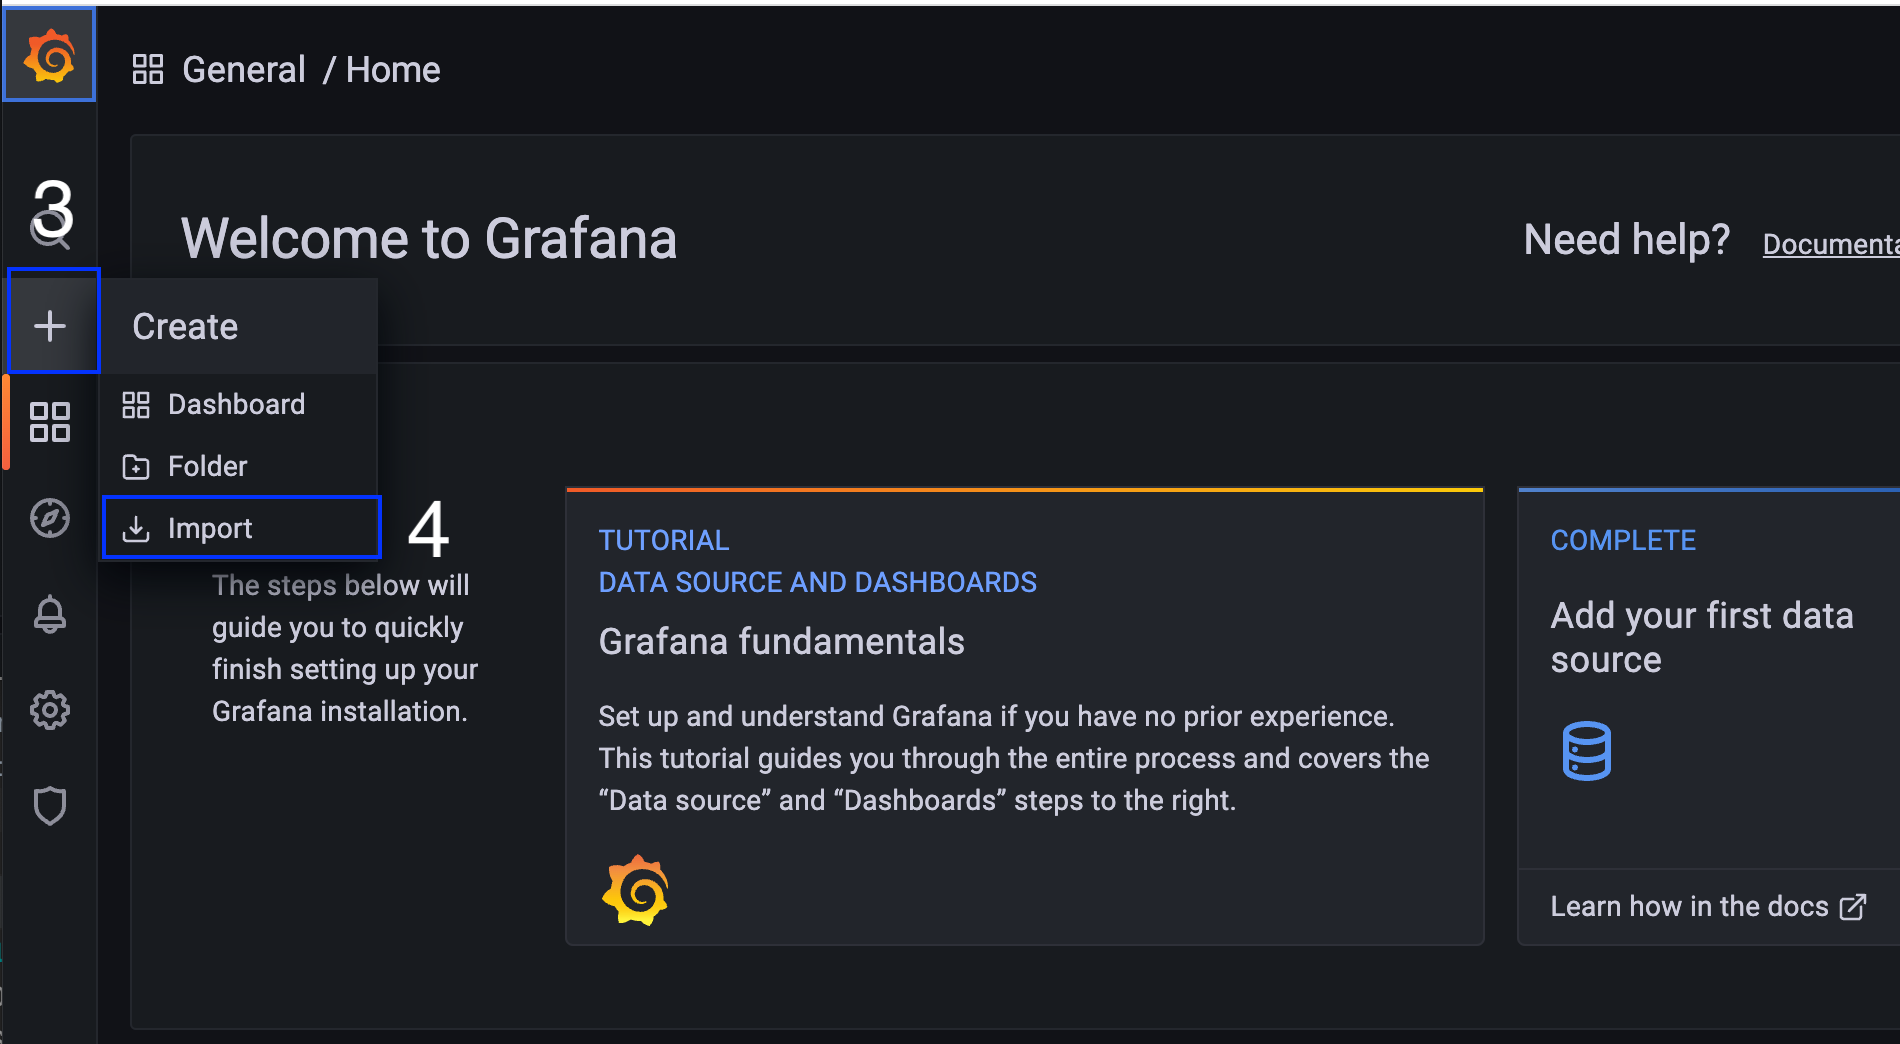
Here is an example of grafana dashboard importing.
| MetricName | Role | Description |
|---|---|---|
| WorkerCount | master | The count of active workers. |
| BlacklistedWorkerCount | master | The count of workers in blacklist. |
| OfferSlotsTime | master | The time of offer slots. |
| PartitionSize | master | The estimated partition size of last 20 flush window whose length is 15 seconds by defaults. |
| RegisteredShuffleCount | master and worker | The value means count of registered shuffle. |
| CommitFilesTime | worker | CommitFiles means flush and close a shuffle partition file. |
| ReserveSlotsTime | worker | ReserveSlots means acquire a disk buffer and record partition location. |
| FlushDataTime | worker | FlushData means flush a disk buffer to disk. |
| OpenStreamTime | worker | OpenStream means read a shuffle file and send client about chunks size and stream index. |
| FetchChunkTime | worker | FetchChunk means read a chunk from a shuffle file and send to client. |
| MasterPushDataTime | worker | MasterPushData means handle pushdata of master partition location. |
| SlavePushDataTime | worker | MasterPushData means handle pushdata of slave partition location. |
| PushDataFailCount | worker | The count of failed PushData or PushMergedData. |
| TakeBufferTime | worker | TakeBuffer means get a disk buffer from disk flusher. |
| SlotsAllocated | worker | Slots allocated in last hour |
| NettyMemory | worker | The value measures all kinds of transport memory used by netty. |
| SortTime | worker | SortTime measures the time used by sorting a shuffle file. |
| SortMemory | worker | SortMemory means total reserved memory for sorting shuffle files . |
| SortingFiles | worker | This value means the count of sorting shuffle files. |
| SortedFiles | worker | This value means the count of sorted shuffle files. |
| SortedFileSize | worker | This value means the count of sorted shuffle files 's total size. |
| DiskBuffer | worker | Disk buffers are part of netty used memory, means data need to write to disk but haven't been written to disk. |
| PausePushData | worker | PausePushData means the count of worker stopped receiving data from client. |
| PausePushDataAndReplicate | worker | PausePushDataAndReplicate means the count of worker stopped receiving data from client and other workers. |
| RPCReserveSlotsNum | worker | The count of the RPC ReserveSlots received by the worker. |
| RPCReserveSlotsSize | worker | The size of the RPC ReserveSlots 's body received by the worker. |
| RPCPushDataNum | worker | The count of the RPC PushData received by the worker. |
| RPCPushDataSize | worker | The size of the RPC PushData 's body received by the worker. |
| RPCPushMergedDataNum | worker | The count of the RPC PushMergedData RPC received by the worker. |
| RPCPushMergedDataSize | worker | The size of the RPC PushMergedData 's body received by the worker. |
| RPCCommitFilesNum | worker | The count of the RPC CommitFiles received by the worker. |
| RPCCommitFilesSize | worker | The size of the RPC CommitFiles 's body received by the worker. |
| RPCDestroyNum | worker | The count of the RPC Destroy received by the worker. |
| RPCDestroySize | worker | The size of the RPC Destroy 's body received by the worker. |
| RPCChunkFetchRequestNum | worker | The count of the RPC ChunkFetchRequest RPC received by the worker. |
Celeborn master metric : org/apache/celeborn/service/deploy/master/MasterSource.scala
Celeborn worker metric : org/apache/celeborn/service/deploy/worker/WorkerSource.scala
We provide a grafana dashboard for Celeborn Grafana-Dashboard. The dashboard was generated by grafana of version 8.5.0.
Here are some snapshots:

