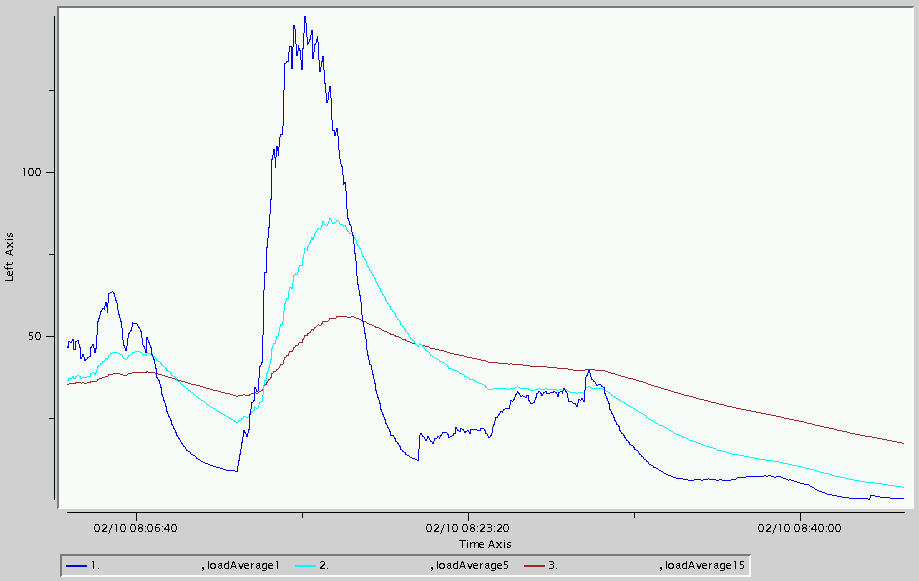
Load average shows how many processes are waiting in the run queue for a system resource (usually a processor). The higher the load average, the more processes are waiting.
One way to determine whether a machine has high load average is to use an operating system command such as uptime or top while the application is running.
The uptime output below shows that the load average is 0.40, 0.46, 0.43 over the last 1, 5 and 15 minutes, respectively.
uptime
15:37:27  up 107 days,  2:24, 32 users,  load average: 0.40, 0.46, 0.43
The top output shows, among other things, load average, CPU usage percentages and I/O wait (iowait) percentage. The iowait percentage is the percentage of time the CPU is waiting for an I/O to complete. The output below shows a fairly high load average over the past 1 minute (10.40) for the number of CPUs. It also shows that the CPUs are mostly in use (idle=3.0%) and that I/O wait percentage is low (0.4%).
 12:49:24  up 113 days, 23:36, 35 users,  load average: 10.40, 5.20, 2.30
 615 processes: 587 sleeping, 27 running, 1 zombie, 0 stopped
 CPU states:  cpu    user    nice  system    irq  softirq  iowait    idle
            total   61.7%    0.0%   31.4%   0.5%     2.5%    0.4%    3.0%

   PID USER  PRI  NI  SIZE  RSS SHARE STAT %CPU %MEM   TIME CPU COMMAND
 22523 user1  15   0 1102M 1.1G 18068 R     3.6 14.1   0:24   1 java
 22778 user1  15   0 1102M 1.1G 18068 R     2.1 14.1   0:02   1 java
 22682 user1  15   0 1102M 1.1G 18068 R     1.4 14.1   0:07   1 java
 22698 user1  15   0 1102M 1.1G 18068 R     1.4 14.1   0:10   0 java
 19286 user1  15   0 1100M 1.1G 18080 R     0.5 14.1   0:25   0 java
Another way to determine whether a machine has high load average is to use vsd to display the load average values contained in a given Geode statistics archive.
####LinuxSystemStats
The chart below shows the LinuxSystemStats loadAverage1, loadAverage5 and loadAverage15 values.

Determining that there is high load is one thing. Finding the source of the load is another (whether it be CPU or I/O). Use the output from top to help determine if the high load is due to CPU or I/O. If the high load is due to CPU, see the Action section of the [[Troubleshooting CPU]] document for actions that can help alleviate CPU issues. If the high load is due to I/O wait percentage, then it might be related to disk I/O. See the Geode Users Guide for actions that can help alleviate disk issues for persistent regions.