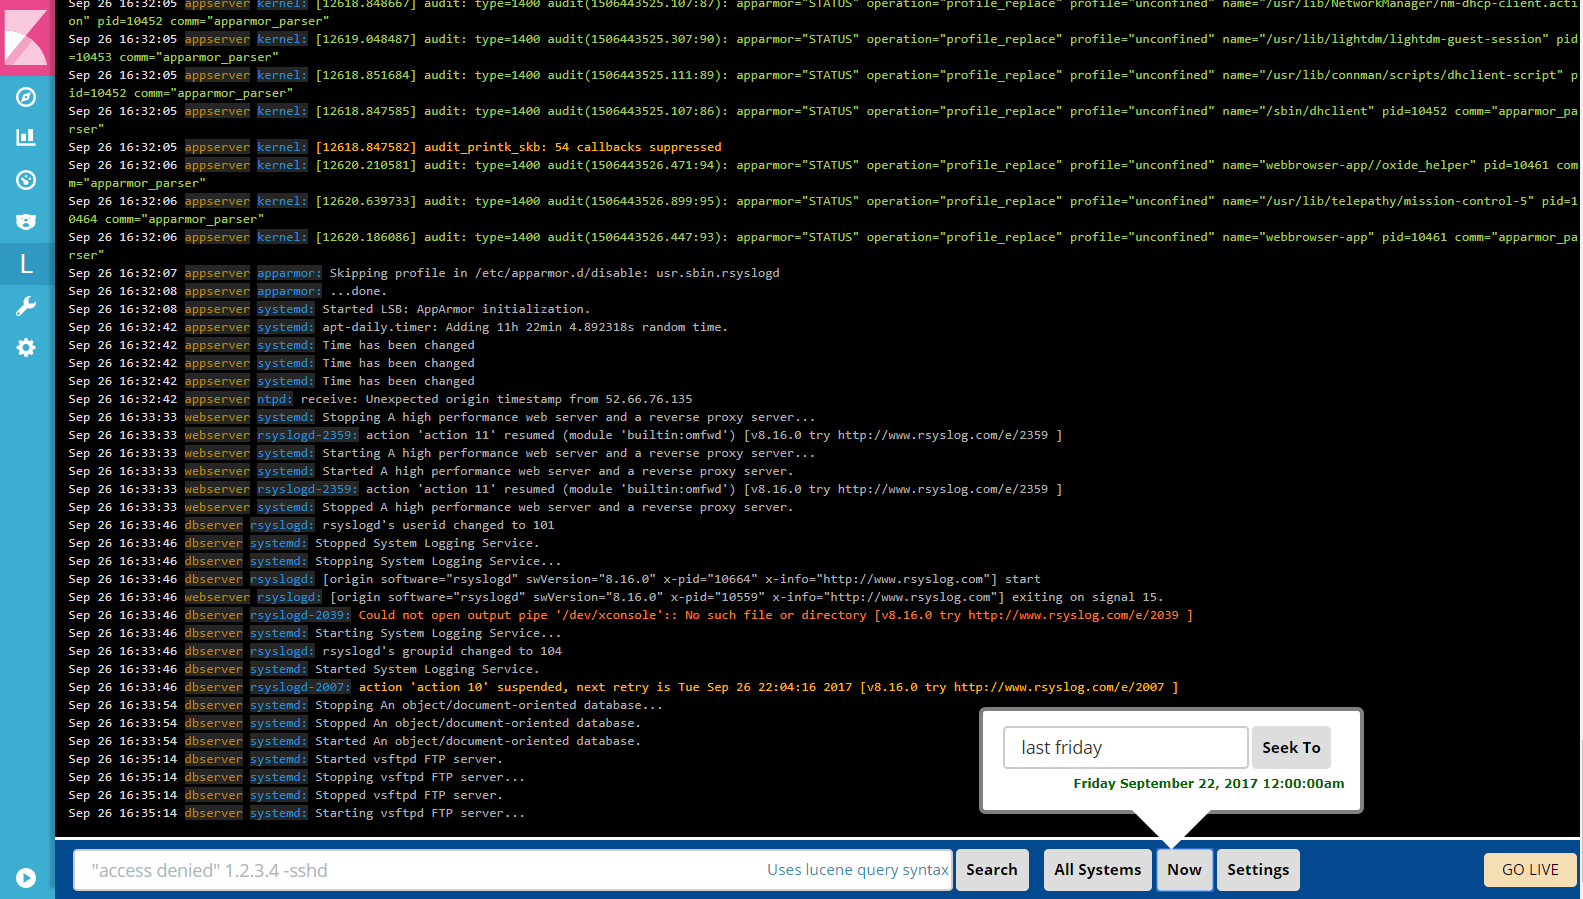
LogTrail is a plugin for Kibana to view, analyze, search and tail syslog events in realtime with a developer/sysadmin friendly interface inspired by Papertrail.
- View, analyze and search syslog events from a centralized, developer and sysadmin friendly interface
- Live tail
- Filter aggregated logs by hosts and program
- Quickly seek to logs based on time
- Supports all logs shipped in syslog format
- Prerequisites
- Download and install Elasticsearch , Logstash and Kibana
- Logtrail is supported and tested with Kibana 4.x [ support for 5.x coming soon! ]
- Install logtrail plugin
- Kibana 4.x :
./bin/kibana plugin -i logtrail -u - Configure logstash to receive syslog events
- Start logstash agent with following configuration to recieve syslog events.
input {
  tcp {
    port => 5000 # syslog port. can be changed
    type => syslog
  }
  udp { #optional. required if syslog events are sent using UDP.
    port => 5000
    type => syslog
  }
}
#Do not change the contents of filter codec
filter {
  if [type] == "syslog" {
    grok {
      match => { "message" => "%{SYSLOGTIMESTAMP:syslog_timestamp} %{SYSLOGHOST:hostname} %{DATA:program}(?:\[%{POSINT:pid}\])?: %{GREEDYDATA:syslog_message}" }
      add_field => [ "received_at", "%{@timestamp}" ]
      add_field => [ "received_from", "%{host}" ]
    }
    date {
      match => [ "syslog_timestamp", "MMM  d HH:mm:ss", "MMM dd HH:mm:ss" ]
    }
  }
}

output {
  elasticsearch {
    hosts => ["localhost:9200"]  #change host as required
  }
}
- Configure rsyslog to send data to logstash
- For Ubuntu
- As root, edit /etc/rsyslog.conf or /etc/syslog.conf to include following line at the end
- Restart rsyslog to activate the changes
- As root, edit /etc/rsyslog.conf or /etc/syslog.conf to include following line at the end
- Logs & Events from Windows, Java, Python, PHP, Perl, Ruby, Android, Docker, .Net can be shipped using syslog protocol.
- For more configuration options refer to Papertrail Configuration Help.
- For Ubuntu
- Configure logtrail plugin
- After plugin installation, the tail refresh interval (default every 10 seconds) and max events fetched per request (default 500) can be configured in
logtrail.jsonlocated at installaedPlugins/logtrail directory.
- After plugin installation, the tail refresh interval (default every 10 seconds) and max events fetched per request (default 500) can be configured in
- Event format : Each line displayed in the events view is of format:
syslog_timestamp syslog_hostname syslog_program:syslog_message - Switching back to Kibana main view from logtrail will not work (known bug).
