This document describes various ways to debug and diagnose issues when using MsQuic.
For debugging issues, logging is generally the best way to diagnose problems. MsQuic has extensive logs in the code to facilitate debugging. The logs can simply be converted to human readable text or they can be processed by various automated tools to help improve diagnostics.
Note Currently tools only support Windows ETW.
On Windows, MsQuic leverages manifested ETW for its logging. All dependencies should be included with Windows; nothing additional should be required.
On Linux, MsQuic leverages LTTng for its logging. Some dependencies, such as babeltrace, lttng, and clog2text_lttng are required. The simplest way to install all dependencies is by running ./scripts/prepare-machine.ps1 -ForTest, but if you only want to collect the traces on the machine, the minimal dependencies are:
sudo apt-add-repository ppa:lttng/stable-2.12
sudo apt-get update
sudo apt-get install -y lttng-tools
Tracing is currently unsupported on macOS.
There are a lot of general tools and ways to collect and interact with ETW. In the sections below are our recommended ways to collect and consume the MsQuic ETW logs. MsQuicEtw.man specifies all the details for each event. For instance:
   <event
       keywords="ut:Connection ut:DataFlow"
       level="win:Verbose"
       message="$(string.Etw.ConnOutFlowStats)"
       opcode="Connection"
       symbol="QuicConnOutFlowStats"
       template="tid_CONN_OUT_FLOW_STATS"
       value="5140"
       />
This details everything about the QuicConnOutFlowStats event (see ConnOutFlowStats in the code), including it's level (verbose) and it's keywords (ut:Connection and ut:DataFlow). So this event would be collected if the level is 5 or higher and either the ut:Connection or the ut:DataFlow keywords are configured.
The numeric value for the keywords is at the top of the manifest file:
    <keyword
        mask="0x0000000000000020"
        name="ut:Connection"
        />
    <keyword
        mask="0x0000000040000000"
        name="ut:DataFlow"
        />
netsh.exe (short for Net Shell, but generally pronounced "net-s-h") is an inbox Windows command line tool. It has many uses, but one of the most used is around tracing (at least for the networking community).
To start collecting a trace with netsh, use the following command:
netsh.exe trace start overwrite=yes report=dis correlation=dis traceFile=quic.etl provider={ff15e657-4f26-570e-88ab-0796b258d11c} level=0x5 keywords=0xffffffff
There are a lot of parameters being passed and if you want the complete help text explaining them all you can run netsh.exe trace start help. A few of the important parameters are:
-
traceFile - The name/path of the output ETL file that the logs will be saved to.
-
provider - The GUID of the ETW provider that should be collected. In this case,
{ff15e657-4f26-570e-88ab-0796b258d11c}is the GUID for the MsQuic provider. -
level - The level at which to collect traces.
5indicates theverboselevel.4isinformational. -
keywords - The set of flags that indicate which type of events should be collected. The command above collects all keywords (
0xffffffff) which may be too verbose for some scenarios, such as high throughput testing or large number of parallel connections. For a detailed list of the available keywords, see MsQuicEtw.man and see<keywords>.
Once you are done with collecting all the events, to stop the trace session, use the following command:
netsh.exe trace stop
This will flush and finalize the output ETL file specified in the netsh trace start command. This ETL file can either be converted to text or used in the automated tools.
wpr.exe is another inbox Windows command line tool that can be used to collect ETW traces, but it requires an additional "profile" file: MsQuic.wprp. This WPR profile file details several specifically tailored trace configurations. To use it, you must copy MsQuic.wprp to the machine you wish to collect the traces for, you can simply run the following to start trace collection:
wpr.exe -start MsQuic.wprp!PROFILE -filemode
You must replace PROFILE with the name of the profile you want to run. Some of the useful profiles are:
Stacks.Light- Collects CPU callstacks.Performance.Light- Collects performance related events useful for automated tool processing.Performance.Verbose- CollectsPerformance.Lightplus CPU callstacks.Basic.Light- Collects general, "low volume" MsQuic events. Useful for a "big picture" understanding, with as few events collected as possible.Basic.Verbose- Collects all MsQuic events. This is very verbose.Scheduling.Verbose- Collects "low volume" and scheduling related MsQuic events.Datapath.Light- Collects "low volume" and datapath related MsQuic events.Datapath.Verbose- CollectsDatapath.Lightplus CPU callstacks.Full.Light- Collects all MsQuic events as well as TAEF events. For most, this will be equivalent toBasic.Verbose.Full.Verbose- Collects all MsQuic events, TAEF events and several networking components' events. This is the most verbose possible, and should only be used for the most minimal scenarios.
When you're done and ready to collect the logs, you run:
wpr.exe -stop ETL_PATH
You must replace ETL_PATH with the path of the output ETL file that you want to be written.
If you no longer need the logs being collected, you can cancel a trace instead of saving it to file:
wpr.exe -cancel
As already indicated, there are lots of ways to collect ETW traces. Feel free to look at Configuring and Starting an Event Tracing Session for more information.
This script wraps steps bellows
WARN: This wrapper doesn't work with ./scripts/test.ps1 etc. as it is also creating lttng session internally.
./scripts/log_wrapper.sh ${Your binary}
# e.g.
./scripts/log_wrapper.sh ./artifacts/bin/linux/x64_Debug_openssl/msquictest --gtest_filter=Basic.*
To start collecting a trace, you can use the following commands:
mkdir msquic_lttng
lttng create msquic -o=./msquic_lttng
lttng enable-event --userspace "CLOG_*"
lttng add-context --userspace --type=vpid --type=vtid
lttng start
And to stop log the trace session, you can use the following command:
lttng stop msquic
To convert an ETL file to human-readable text, you can use the following netsh.exe command:
netsh.exe trace convert quic.etl overwrite=yes
If you're using a version of MsQuic that uses an ETW manifest version more recent than the one built into the Windows image, decoding may not provide correct output. To solve this issue, newer versions of Windows (11 and Server 2022) support a manpath parameter that can be used to manually specify a manifest. This will likely always be needed for apps using MsQuic in user mode.
netsh.exe trace convert quic.etl manpath=path/to/manifest/MsQuicEtw.man
For older versions of Windows that don't support the manpath parameter, you can manually update the installed manifest that is used to decode the file. You can run the following wevtutil.exe commands in an Admin window:
wevtutil.exe um path\to\MsQuicEtw.man
wevtutil.exe im path\to\MsQuicEtw.man /rf:path\to\msquic.dll /mf:path\to\msquic.dll
Replace path\to with the actual paths to the respective files. With the latest manifests installed, now the normal netsh.exe convert command should work.
To convert the trace, you can use the following commands:
babeltrace --names all ./msquic_lttng/* > quic.babel.txt
~/.dotnet/tools/clog2text_lttng -i quic.babel.txt -s clog.sidecar -o quic.log --showTimestamp --showCpuInfo
Note The
clog.sidecarfile that was used to build MsQuic must be used. It can be found in the./src/manifestdirectory of the repository.
MsQuic supports a custom plugin for Windows Performance Analyzer (WPA) to detailed analysis of ETW traces. See the WPA instructions for more details.
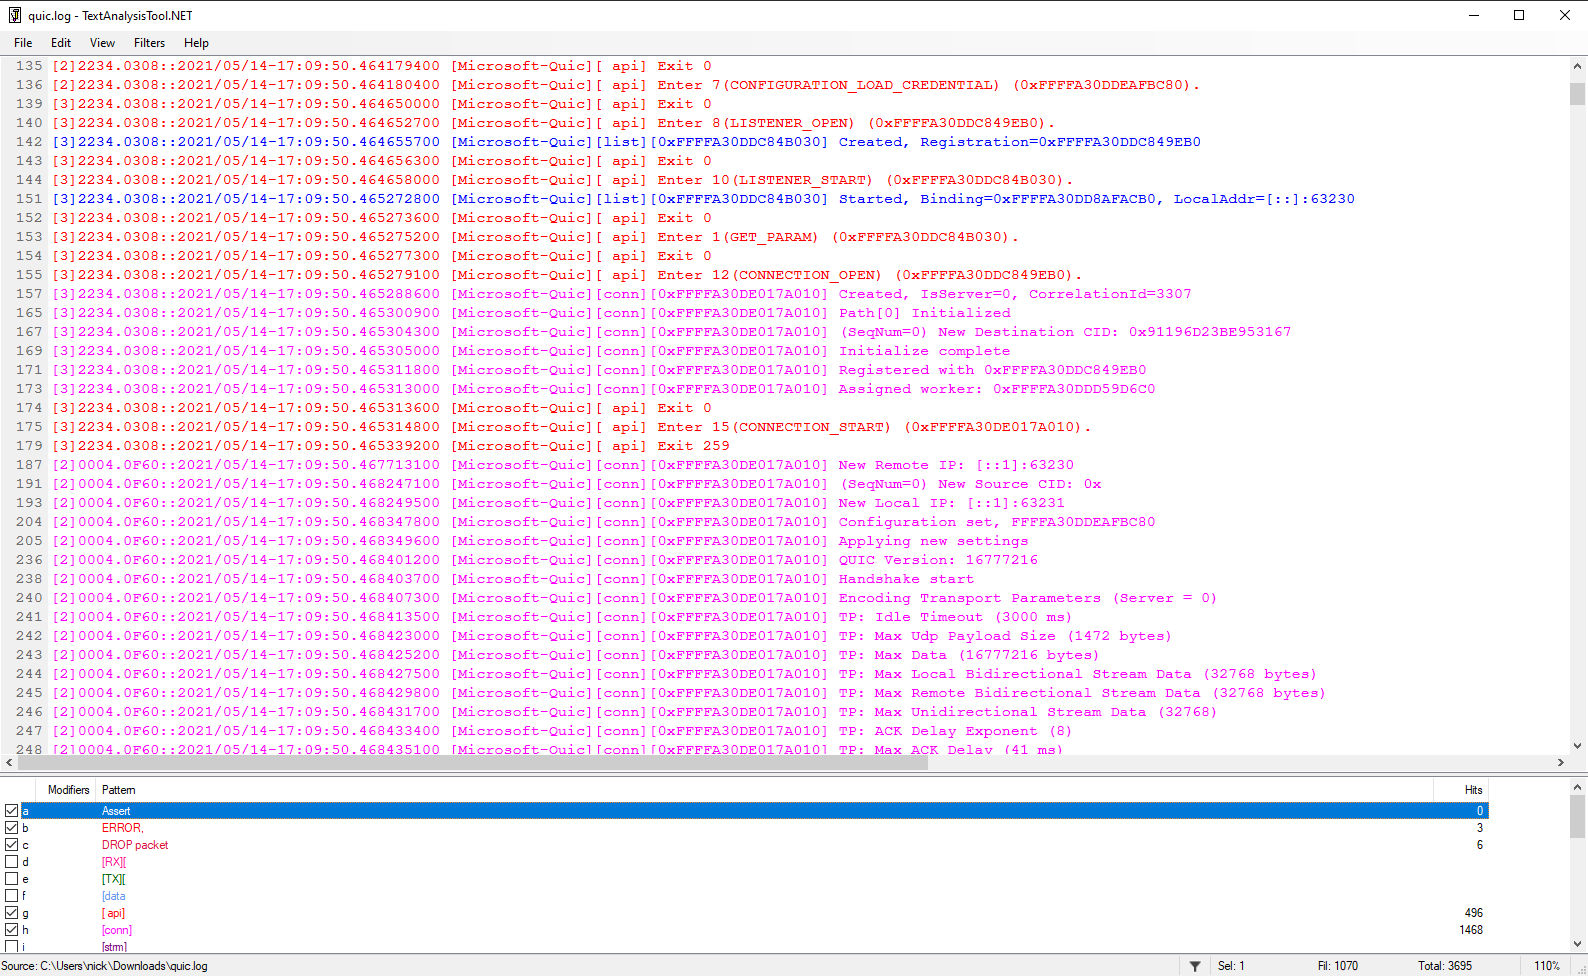
When viewing the traces as text, we recommend TextAnalysisTool.NET (Windows only) and we have several filter files we maintain for it (folder). The different filters are meant to quickly highlight and color code important information.
You may also open the trace in Windows Performance Analyzer. See the WPA instructions for more details.
Note WPA support for LTTng based logs is not yet available but will be supported in the future.
To assist investigations into running systems, MsQuic has a number of performance counters that are updated during runtime. These counters are exposed as an array of unsigned 64-bit integers, via a global GetParam parameter.
Sample code demonstrating how to query the performance counters:
uint64_t Counters[QUIC_PERF_COUNTER_MAX];
uint32_t BufferLength = sizeof(Counters);
MsQuic->GetParam(
    NULL,
    QUIC_PARAM_GLOBAL_PERF_COUNTERS,
    &BufferLength,
    Counters);
Each of the counters available is described here:
| Counter | Description |
|---|---|
| QUIC_PERF_COUNTER_CONN_CREATED | Total connections ever allocated |
| QUIC_PERF_COUNTER_CONN_HANDSHAKE_FAIL | Total connections that failed during handshake |
| QUIC_PERF_COUNTER_CONN_APP_REJECT | Total connections rejected by the application |
| QUIC_PERF_COUNTER_CONN_RESUMED | Total connections resumed |
| QUIC_PERF_COUNTER_CONN_ACTIVE | Connections currently allocated |
| QUIC_PERF_COUNTER_CONN_CONNECTED | Connections currently in the connected state |
| QUIC_PERF_COUNTER_CONN_PROTOCOL_ERRORS | Total connections shutdown with a protocol error |
| QUIC_PERF_COUNTER_CONN_NO_ALPN | Total connection attempts with no matching ALPN |
| QUIC_PERF_COUNTER_STRM_ACTIVE | Current streams allocated |
| QUIC_PERF_COUNTER_PKTS_SUSPECTED_LOST | Total suspected packets lost |
| QUIC_PERF_COUNTER_PKTS_DROPPED | Total packets dropped for any reason |
| QUIC_PERF_COUNTER_PKTS_DECRYPTION_FAIL | Total packets with decryption failures |
| QUIC_PERF_COUNTER_UDP_RECV | Total UDP datagrams received |
| QUIC_PERF_COUNTER_UDP_SEND | Total UDP datagrams sent |
| QUIC_PERF_COUNTER_UDP_RECV_BYTES | Total UDP payload bytes received |
| QUIC_PERF_COUNTER_UDP_SEND_BYTES | Total UDP payload bytes sent |
| QUIC_PERF_COUNTER_UDP_RECV_EVENTS | Total UDP receive events |
| QUIC_PERF_COUNTER_UDP_SEND_CALLS | Total UDP send API calls |
| QUIC_PERF_COUNTER_APP_SEND_BYTES | Total bytes sent by applications |
| QUIC_PERF_COUNTER_APP_RECV_BYTES | Total bytes received by applications |
| QUIC_PERF_COUNTER_CONN_QUEUE_DEPTH | Current connections queued for processing |
| QUIC_PERF_COUNTER_CONN_OPER_QUEUE_DEPTH | Current connection operations queued |
| QUIC_PERF_COUNTER_CONN_OPER_QUEUED | Total connection operations queued ever |
| QUIC_PERF_COUNTER_CONN_OPER_COMPLETED | Total connection operations processed ever |
| QUIC_PERF_COUNTER_WORK_OPER_QUEUE_DEPTH | Current worker operations queued |
| QUIC_PERF_COUNTER_WORK_OPER_QUEUED | Total worker operations queued ever |
| QUIC_PERF_COUNTER_WORK_OPER_COMPLETED | Total worker operations processed ever |
| QUIC_PERF_COUNTER_PATH_VALIDATED | Total path challenges that succeed ever |
| QUIC_PERF_COUNTER_PATH_FAILURE | Total path challenges that fail ever |
| QUIC_PERF_COUNTER_SEND_STATELESS_RESET | Total stateless reset packets sent ever |
| QUIC_PERF_COUNTER_SEND_STATELESS_RETRY | Total stateless retry packets sent ever |
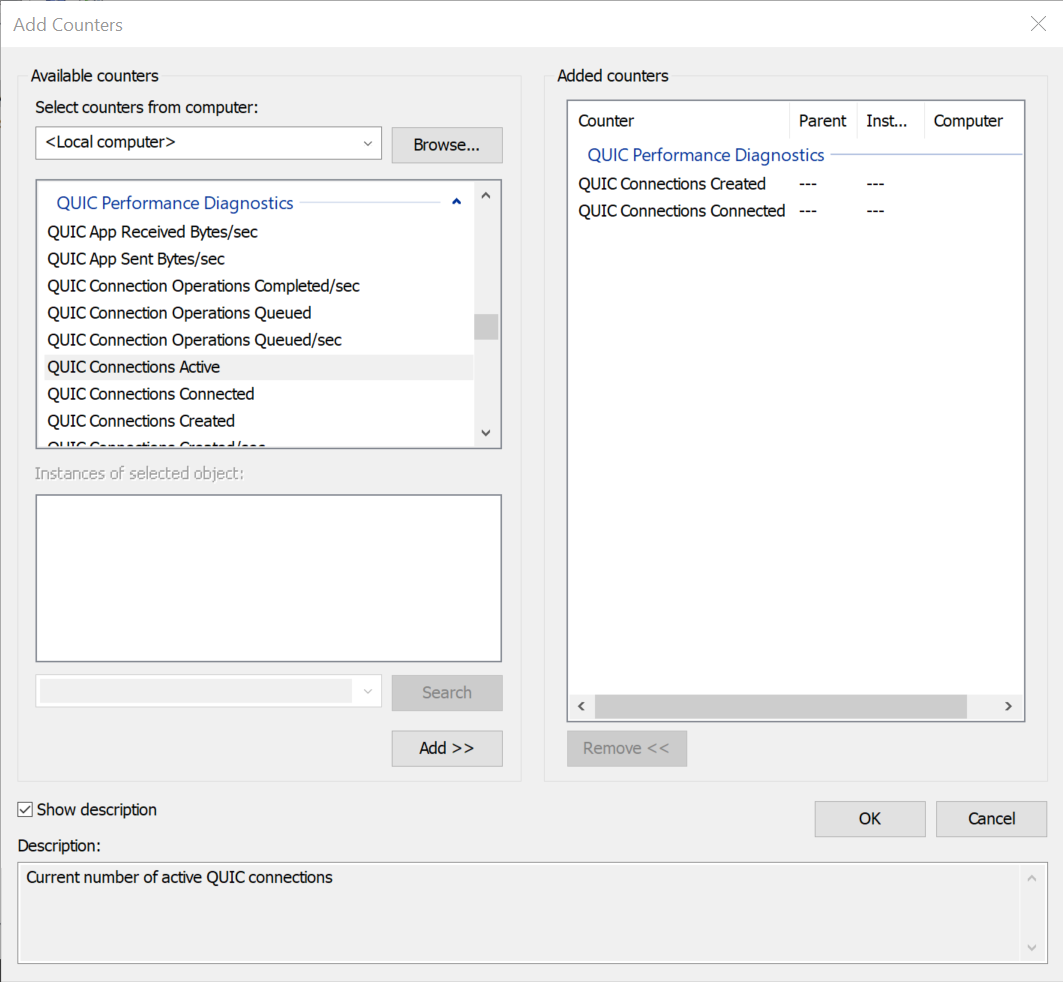
On the latest version of Windows, these counters are also exposed via PerfMon.exe under the QUIC Performance Diagnostics category. The values exposed via PerfMon only represent kernel mode usages of MsQuic, and do not include user mode counters.
Counters are also captured at the beginning of MsQuic ETW traces, and unlike PerfMon, includes all MsQuic instances running on the system, both user and kernel mode.
For detailed trouble shooting steps please see the MsQuic Trouble Shooting Guide.

