The Cloudera Self Driving Vehicle (CSDV) is a miniature autonomous car which is trained to follow markers along a race track, the team achieved this by rapidly sampling photographs and using them to run inference to adjust the steering angle of the vehicle.
-
Lab 1 - On the Gateway host, run a simulator to send IoT sensors data to the MQTT broker.
-
Lab 2 - On the Gateway host, configure and start MiNiFi, which will read from the MQTT broker, filter and forward to the NiFi cluster.
-
Lab 3 - Create the MiNiFi flow on the Edge Flow Manager and publish it for the MiNiFi agent to start sending data to the NiFi cluster.
-
Lab 4 - On Schema Registry, register the schema describing the data generated by the IoT sensors.
-
Lab 5 - On the NiFi cluster, prepare the data and send it to the Kafka cluster.
-
Lab 6 - On the Streams Messaging Manager (SMM) Web UI, monitor the Kafka cluster and confirm data is being ingested correctly.
-
Lab 7 - Use the Edge Flow Manager to update existing edge flows and perform additional processing on the edge
-
Lab 8 - Use NiFi to process each record, calling the Model endpoint and save results to Kudu.
-
Lab 9 - On the CDH cluster, process each record using Spark Streaming, calling the Model endpoint and save results to Kudu.
-
Lab 10 - On the CDH cluster, pull reports on upcoming predicted machine failures using Impala and Hue.
-
Lab 11 - On the CDSW cluster, train your model with the Experiment feature.
-
Lab 12 - On the CDSW cluster, deploy the model into production with the Model feature.
-
Laptop with a supported OS (Windows 7 not supported).
-
Ability to SSH into remote hosts from Windows or Mac. For Windows machines, install Putty or even better install OpenSSH for PowerShell.
-
A modern browser like Google Chrome (IE not supported).
You should have 2 addresses for you one-node cluster: the public DNS name and the public IP address. With those addresses you can test the following connectivity to your cluster:
-
It is convenient to export the DNS, IP, and path to the PEM of your cluster for future use:
export WDNS=<Cluster FQDN>
export WIP=<Cluster IP>
export WPEM=<Path to Pem>
-
Ensure you can SSH into the cluster (using either the DNS name or IP address)
ssh -i $WPEM centos@$WDNS
-
Ensure you can connect to the following service using your browser:
Service URL Credentials Cloudera Manager
admin/adminEdge Flow Manager
NiFi
NiFi Registry
Schema Registry
SMM
Hue
CDSW
admin/Supersecret1 -
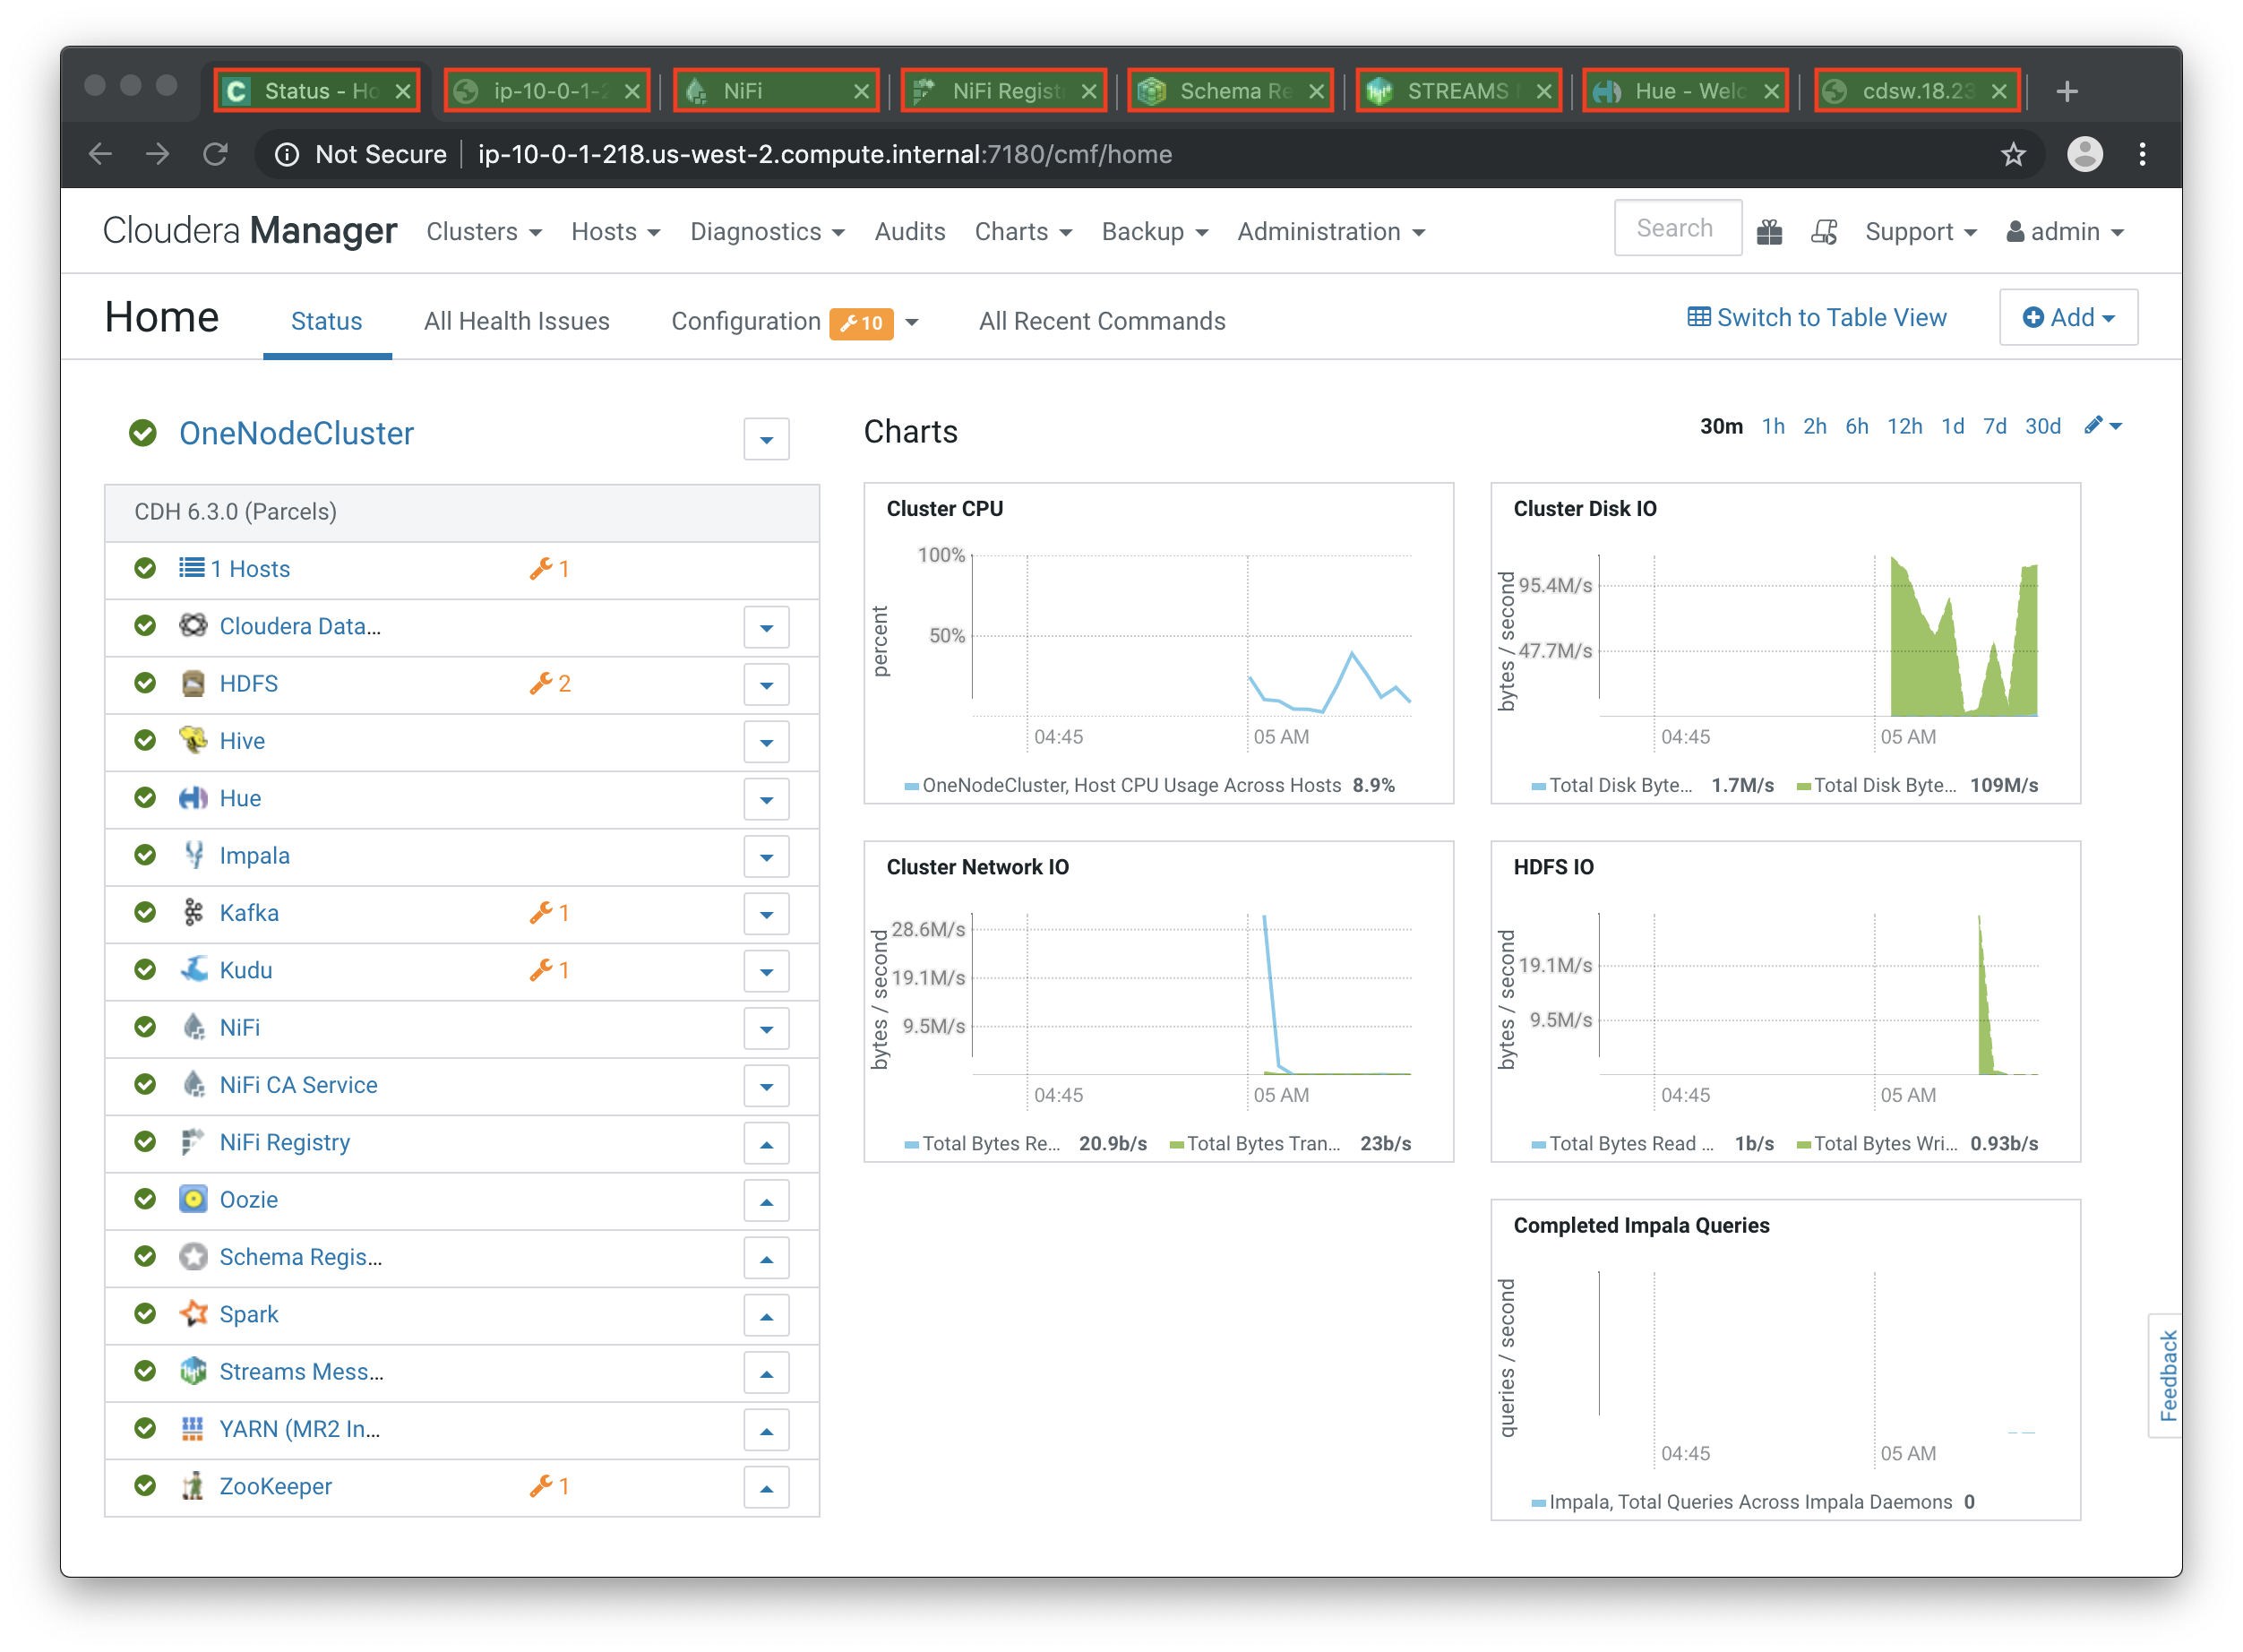
Login into Cloudera Manager and familiarize yourself with the services installed
-
Login into Hue. As you are the first user to login into Hue, you are granted admin privileges. At this point, you won’t need to do anything on Hue, but by logging in, CDH has created your HDFS user and folder.
Below a screenshot of Chrome open with 8 tabs, one for each service.
MiNiFi is installed on the host. In this lab you will configure and run MiNiFi to read from the MQTT broker and forward to the NiFi cluster, but it’s only in the next lab that you will provide the flow to execute.
-
Sudo to the root user
sudo su -
-
Start the MiNiFi agent:
systemctl start minifi
-
Exit the root session
exit
In order to connect MiNiFi to NiFi we need to know where we are going so let’s create a path for our data to slowly build a flow.
Open NiFi UI on your CDF cluster and create a new input source named AWS_MiNiFi_CSV leave it alone for now, we will need the input id to set our connection from MiNiFi processor to NiFi Remote Process Group (RPG)
Cloudera Edge Flow Management gives you a visual overview of all MiNiFi agents in your environment, and allows you to update the flow configuration for each one, with versioning control thanks to the NiFi Registry integration. In this lab, you will create the MiNiFi flow and publish it for the MiNiFi agent to pick it up.
-
Open the EFM Web UI at http://<public_dns>:10088/efm/ui/. Ensure you see your minifi agent’s heartbeat messages in the Events Monitor.
-
You can then select the Flow Designer tab (
 ). To build a dataflow, select the desired class (
iot-1) from the table and click OPEN. Alternatively, you can double-click on the desired class. -
Add a GetFile processor onto canvas to get csv data:
Update processor name to GetCSVFile.
-
Add a Remote Process Group (RPG) to the canvas and configure it as follows:
URL: http://edge2ai-1.dim.local:8080/nifi -
At this point you need to connect the ConsumerMQTT processor to the RPG. For this, you first need to add an Input Port to the remote NiFi server. Open the NiFi Web UI at
http://<public_dns>:8080/nifi/and drag the Input Port to the canvas. Call it something like "from Gateway". -
To terminate the NiFI Input Port let’s, for now, add a Funnel to the canvas…
-
… and setup a connection from the Input Port to it. To setup a connection, hover the mouse over the Input Port until an arrow symbol is shown in the center. Click on the arrow, drag it and drop it on the Funnel to connect the two elements.
-
Right-click on the Input Port and start it. Alternatively, click on the Input Port to select it and then press the start ("play") button on the Operate panel:
-
You will need the ID of the Input Port to complete the connection of the ConsumeMQTT processor to the RPG (NiFi). Double-click on the Input Port and copy its ID.
-
Back to the Flow Designer, connect the ConsumeMQTT processor to the RPG. The connection requires an ID and you can paste here the ID you copied from the Input Port.
-
The Flow is now complete, but before publishing it, create the Bucket in the NiFi Registry so that all versions of your flows are stored for review and audit. Open the NiFi Registry at
http://<public_dns>:18080/nifi-registry, click on the wrench/spanner icon ( ) on the top-right corner on and create a bucket called
 IoT. -
You can now publish the flow for the MiNiFi agent to automatically pick up. Click Publish, add a descriptive comment for your changes and click Apply.
-
Go back to the NiFi Registry Web UI and click on the NiFi Registry name, next to the Cloudera logo. If the flow publishing was successful, you should see the flow’s version details in the NiFi Registry.
-
At this point, you can test the edge flow up until NiFi. Start the simulator again and confirm you can see the messages queued in NiFi.
python mqtt.iot_simulator.py mqtt.iot.config -
You can stop the simulator once you confirm that the flow is working correctly.
The data produced by the temperature sensors is described by the schema in file sensor.avsc. In this lab we will register this schema in Schema Registry so that our flows in NiFi can refer to schema using an unified service. This will also allow us to evolve the schema in the future, if needed, keeping older versions under version control, so that existing flows and flowfiles will continue to work.
-
Go the following URL, which contains the schema definition we’ll use for this lab. Select all contents of the page and copy it.
-
In the Schema Registry Web UI, click the
+sign to register a new schema. -
Click on a blank area in the Schema Text field and paste the contents you copied.
-
Complete the schema creation by filling the following properties:
Name:          SensorReading
Description:   Schema for the data generated by the IoT sensors
Type:          Avro schema provider
Schema Group:  Kafka
Compatibility: Backward
Evolve:        checked
-
Save the schema
In this lab, you will create a NiFi flow to receive the data from all gateways and push it to Kafka.
Before we start building our flow, let’s create a Process Group to help organizing the flows in the NiFi canvas and also to enable flow version control.
-
Open the NiFi Web UI, create a new Process Group and name it something like Process Sensor Data.
-
We want to be able to version control the flows we will add to the Process Group. In order to do that, we first need to connect NiFi to the NiFi Registry. On the NiFi global menu, click on "Controller Services", navigate to the "Registry Clients" tab and add a Registry client with the following URL:
Name: NiFi Registry
URL:  http://edge2ai-1.dim.local:18080
-
On the NiFi Registry Web UI, add another bucket for storing the Sensor flow we’re about to build'. Call it
SensorFlows: -
Back on the NiFi Web UI, to enable version control for the Process Group, right-click on it and select Version > Start version control and enter the details below. Once you complete, a
 will appear on the Process Group, indicating that version control is now enabled for it.
Registry: NiFi Registry Bucket: SensorFlows Flow Name: SensorProcessGroup -
Let’s also enable processors in this Process Group to use schemas stored in Schema Registry. Right-click on the Process Group, select Configure and navigate to the Controller Services tab. Click the
+icon and add a HortonworksSchemaRegistry service. After the service is added, click on the service’s cog icon ( ), go to the Properties tab and configure it with the following Schema Registry URL and click Apply.
URL: http://edge2ai-1.dim.local:7788/api/v1 -
Click on the lightning bolt icon (
 ) to enable the HortonworksSchemaRegistry Controller Service.
 -
Still on the Controller Services screen, let’s add two additional services to handle the reading and writing of JSON records. Click on the
 button and add the following two services:
-
JsonTreeReader, with the following properties:Schema Access Strategy: Use 'Schema Name' Property Schema Registry: HortonworksSchemaRegistry Schema Name: ${schema.name} -> already set by default! -
JsonRecordSetWriter, with the following properties:Schema Write Strategy: HWX Schema Reference Attributes Schema Access Strategy: Inherit Record Schema Schema Registry: HortonworksSchemaRegistry
-
-
Enable the JsonTreeReader and the JsonRecordSetWriter Controller Services you just created, by clicking on their respective lightning bolt icons (
 ).
).
-
Double-click on the newly created process group to expand it.
-
Inside the process group, add a new Input Port and name it "Sensor Data"
-
We need to tell NiFi which schema should be used to read and write the Sensor data. For this we’ll use an UpdateAttribute processor to add an attribute to the FlowFile indicating the schema name.
Add an UpdateAttribute processor by dragging the processor icon to the canvas:
-
Double-click the UpdateAttribute processor and configure it as follows:
-
Connect the Sensor Data input port to the Set Schema Name processor.
-
Add a PublishKafkaRecord_2.0 processor and configure it as follows:
SETTINGS tab:
Name: Publish to Kafka topic: iotPROPERTIES tab:
Kafka Brokers: edge2ai-1.dim.local:9092 Topic Name: iot Record Reader: JsonTreeReader Record Writer: JsonRecordSetWriter Use Transactions: false Attributes to Send as Headers (Regex): schema.*NoteMake sure you use the PublishKafkaRecord_2.0 processor and not the PublishKafka_2.0 one -
While still in the PROPERTIES tab of the PublishKafkaRecord_2.0 processor, click on the
 button and add the following property:
Property Name:  client.id
Property Value: nifi-sensor-data
Later, this will help us clearly identify who is producing data into the Kafka topic.
-
Connect the Set Schema Name processor to the Publish to Kafka topic: iot processor.
-
Add a new Funnel to the canvas and connect the PublishKafkaRecord processor to it. When the "Create connection" dialog appears, select "failure" and click Add.
-
Double-click on the Publish to Kafka topic: iot processor, go to the SETTINGS tab, check the "success" relationship in the AUTOMATICALLY TERMINATED RELATIONSHIPS section. Click Apply.
-
Start the input port and the two processors. Your canvas should now look like the one below:
-
The only thing that remains to be configured now is to finally connect the "from Gateway" Input Port to the flow in the "Processor Sensor Data" group. To do that, first go back to the root canvas by clicking on the NiFi Flow link on the status bar.
-
Connect the Input Port to the Process Sensor Data Process Group by dragging the destination of the current connection from the funnel to the Process Group. When prompted, ensure the "To input" fields is set to the Sensor data Input Port.
-
Refresh the screen (
Ctrl+Ron Linux/Windows;Cmd+Ron Mac) and you should see that the records that were queued on the "from Gateway" Input Port disappeared. They flowed into the Process Sensor Data flow. If you expand the Process Group you should see that those records were processed by the PublishKafkaRecord processor and there should be no records queued on the "failure" output queue.At this point, the messages are already in the Kafka topic. You can add more processors as needed to process, split, duplicate or re-route your FlowFiles to all other destinations and processors.
-
To complete this Lab, let’s commit and version the work we’ve just done. Go back to the NiFi root canvas, clicking on the "Nifi Flow" breadcrumb. Right-click on the Process Sensor Data Process Group and select Version > Commit local changes. Enter a descriptive comment and save.
Now that our NiFi flow is pushing data to Kafka, it would be good to have a confirmation that everything is running as expected. In this lab you will use Streams Messaging Manager (SMM) to check and monitor Kafka.
-
Start the simulator again and confirm you can see the messages queued in NiFi. Leave it running.
python mqtt.iot_simulator.py mqtt.iot.config -
Go to the Stream Messaging Manager (SMM) Web UI and familiarize yourself with the options there. Notice the filters (blue boxes) at the top of the screen.
-
Click on the Producers filter and select only the
nifi-sensor-dataproducer. This will hide all the irrelevant topics and show only the ones that producer is writing to. -
If you filter by Topic instead and select the
iottopic, you’ll be able to see all the producers and consumers that are writing to and reading from it, respectively. Since we haven’t implemented any consumers yet, the consumer list should be empty. -
Click on the topic to explore its details. You can see more details, metrics and the break down per partition. Click on one of the partitions and you’ll see additional information and which producers and consumers interact with that partition.
-
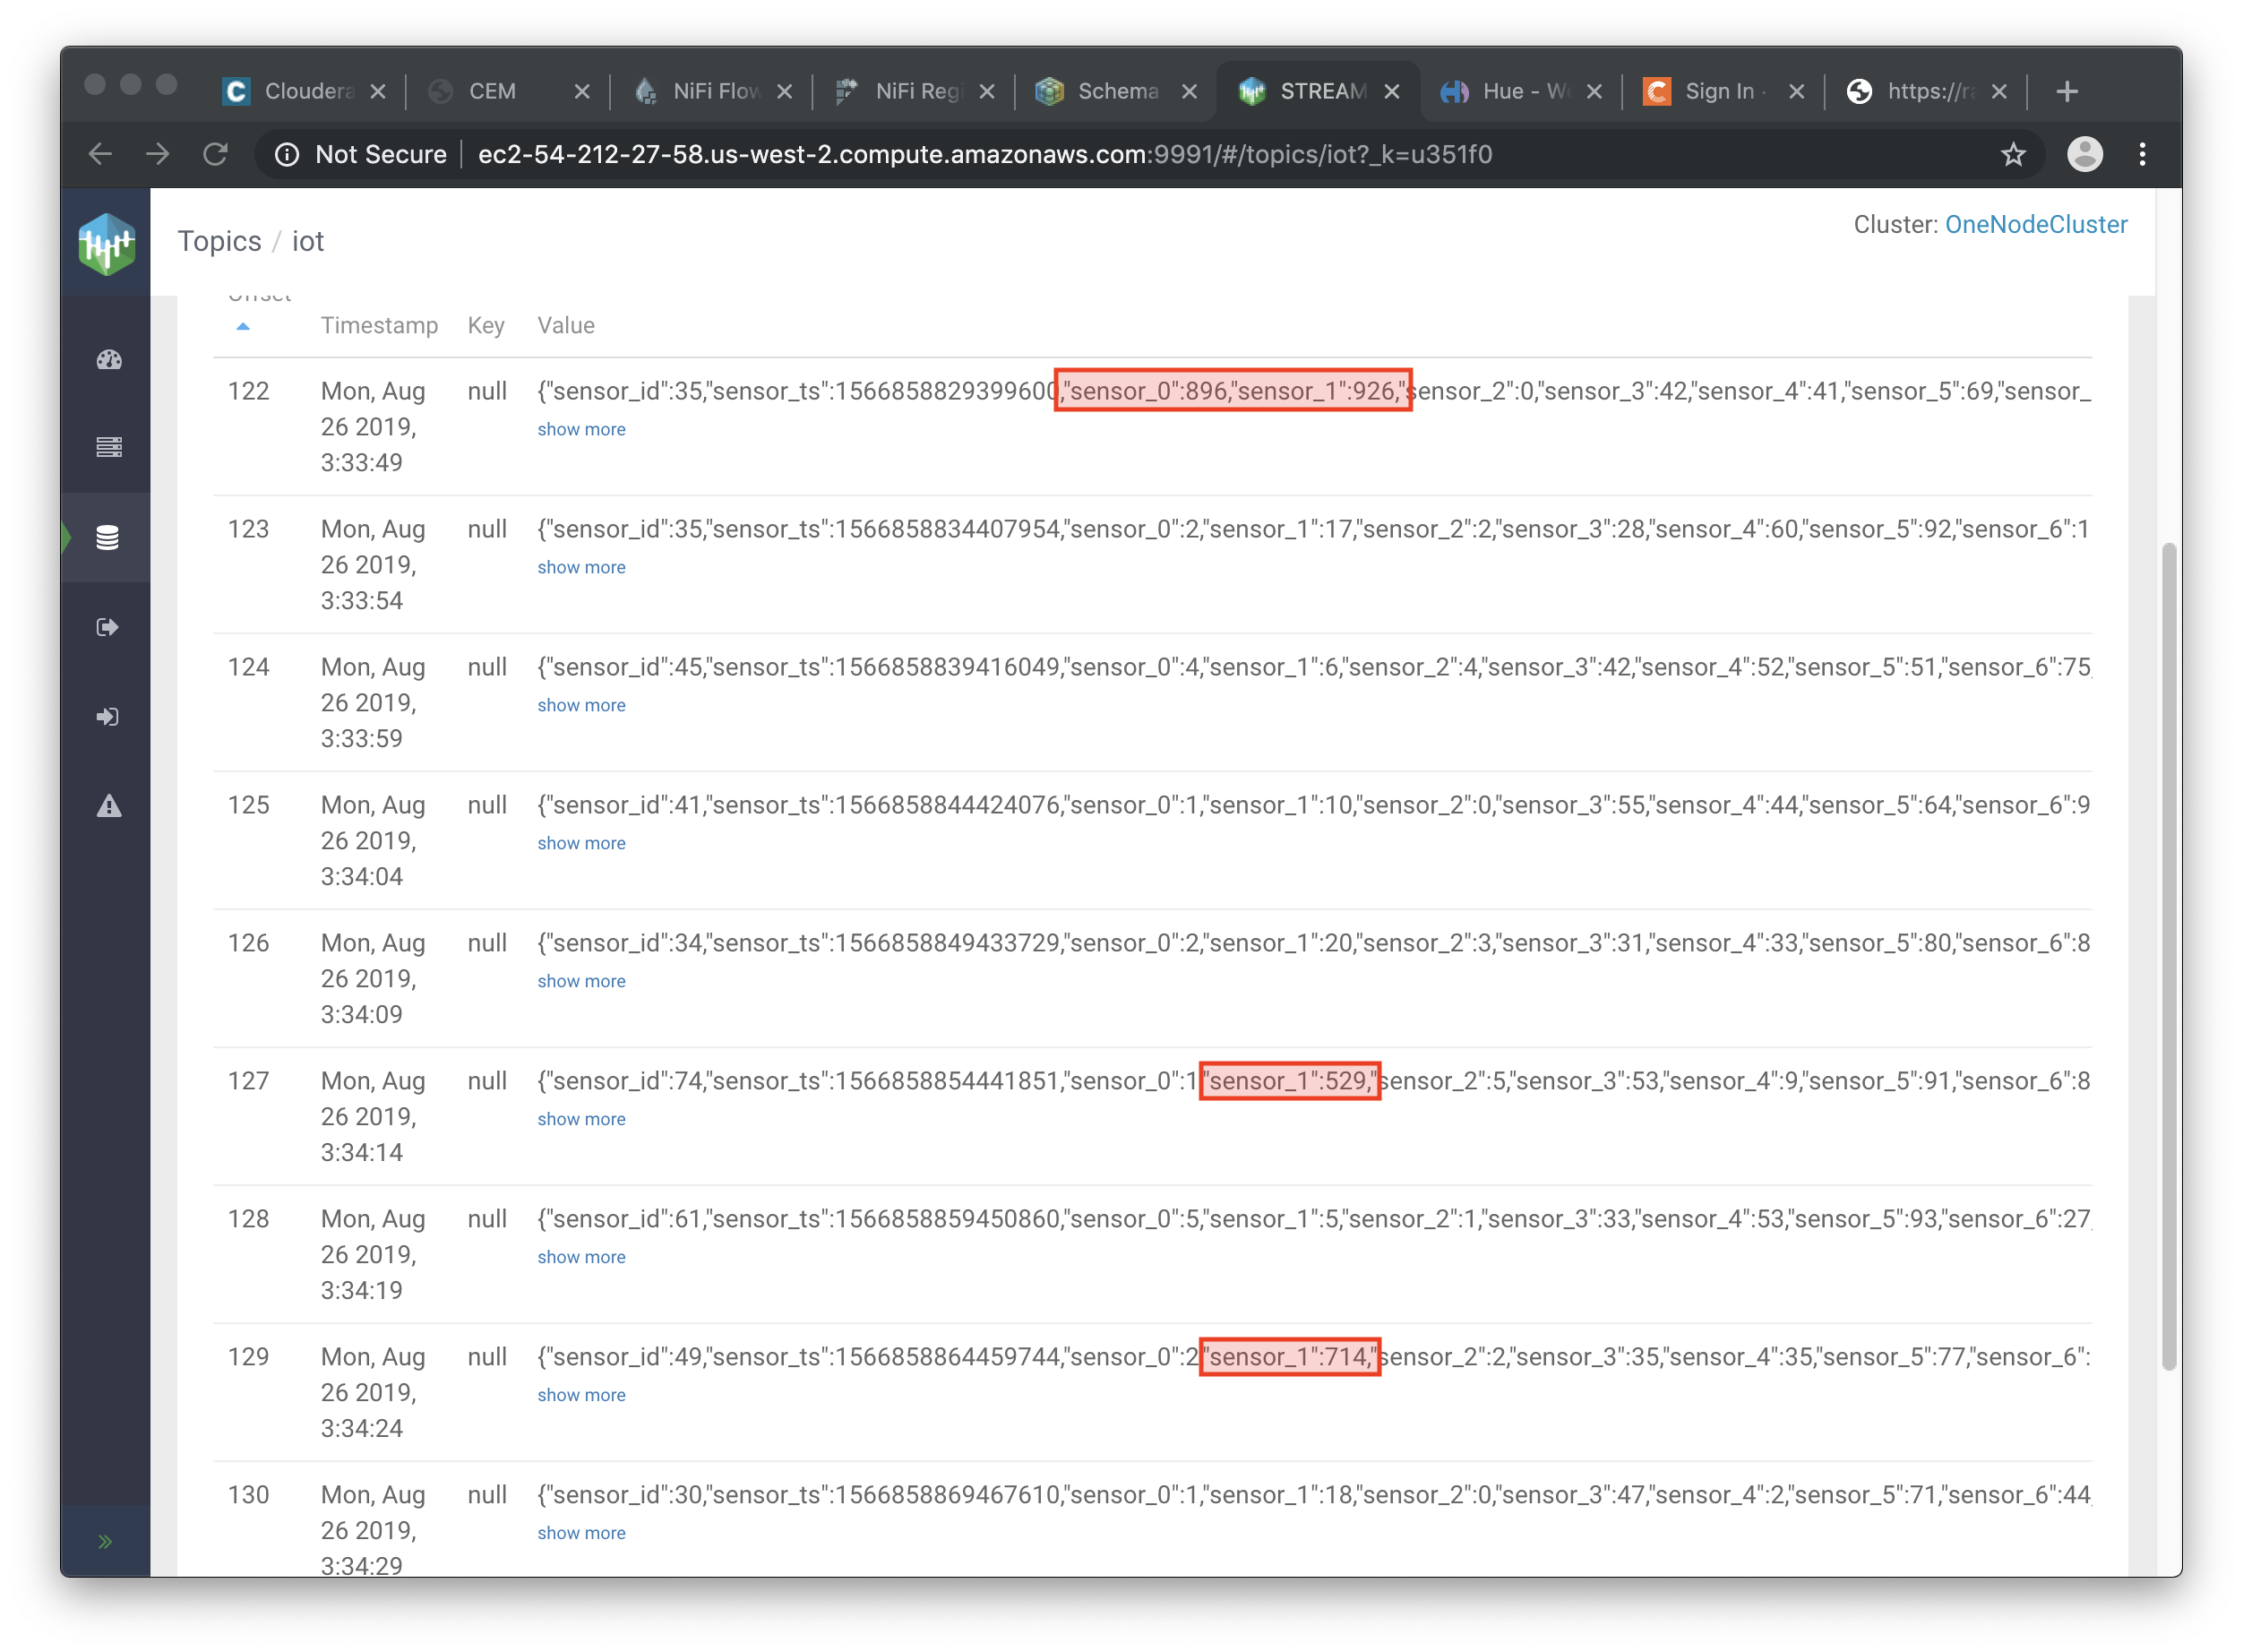
Click on the EXPLORE link to visualize the data in a particular partition. Confirm that there’s data in the Kafka topic and it looks like the JSON produced by the sensor simulator.
-
Check the data from the partition. You’ll notice something odd. These are readings from temperature sensors and we don’t expect any of the sensors to measure temperatures greater than 150 degrees in the conditions they are used. It seems, though, that
sensor_0andsensor_1are intermittently producing noise and some of the measurements have very high values for these measurements. -
Stop the simulator with CTRL-C.
-
In the next Lab we’ll eliminate with these problematic measurements to avoid problems later in our data flow.
In the previous lab we noticed that some of the sensors were sending erroneous measurements intermittently. If we let these measurements to be processed by our data flow we might have problems with the quality of our flow output and we want to avoid that.
We could use our Process Sensor Data flow in NiFi to filter out those problematic measurements. However, if their volume is large we could be wasting network bandwidth and causing additional overhead in NiFi to process the bogus data. What we’d like to do instead is to push additional logic to the edge to identify and filter those problems in place and avoiding sending them to NiFi in the first place.
We’ve noticed that the problem always happen with the temperatures in measurements sensor_0 and sensor_1, only. If any of these two temperatures are greater than 500 we must discard the entire sensor reading. If both of these temperatures are in the normal range (< 500) we can guarantee that all temperatures reported are correct and can be sent to NiFi.
-
Go to the CEM Web UI and add a new processor to the canvas. In the Filter box of the dialog that appears, type "JsonPath". Select the EvaluateJSONPath processor and click Add.
-
Double-click on the new processor and configure it with the following properties:
Processor Name: Extract sensor_0 and sensor1 values
Destination:    flowfile-attribute
-
Click on the Add Property button and enter the following properties:
Property Name Property Value sensor_0$.sensor_0sensor_1$.sensor_1 -
Click Apply to save the processor configuration.
-
Drag one more new processor to the canvas. In the Filter box of the dialog that appears, type "Route". Select the RouteOnAttribute processor and click Add.
-
Double-click on the new processor and configure it with the following properties:
Processor Name: Filter Errors
Route Strategy: Route to Property name
-
Click on the Add Property button and enter the following properties:
Property Name Property Value error${sensor_0:ge(500):or(${sensor_1:ge(500)})} -
Click Apply to save the processor configuration.
-
Reconnect the ConsumeMQTT processor to the Extract sensor_0 and sensor1 values processor:
-
Connect the Extract sensor_0 and sensor1 values to the Filter errors processor. When the Create Connection dialog appear, select "matched" and click Create.
-
Double-click the Extract sensor_0 and sensor1 values and check the following values in the AUTOMATICALLY TERMINATED RELATIONSHIPS section and click Apply:
-
failure
-
unmatched
-
sensor_0
-
sensor_1
-
-
Before creating the last connection, you will need (again) the ID of the NiFi Input Port. Go to the NiFi Web UI , double-click on the "from Gateway" Input Port and copy its ID.
-
Back on the CEM Web UI, connect the Filter errors processor to the RPG:
-
In the Create Connection dialog, check the "unmatched" checkbox and enter the copied input port ID, and click on Create:
-
To ignore the errors, double-click on the Filter errors processor, check the error checkbox under the AUTOMATICALLY TERMINATED RELATIONSHIPS section and click Apply:
-
Finally, click on ACTIONS > Publish… on the CEM canvas, enter a descriptive comment like "Added filtering of erroneous readings" and click Publish.
-
Start the simulator again.
-
Go to the NiFi Web UI and confirm that the data is flowing without errors within the Process Sensor Data process group. Refresh a few times and check that the numbers are changing.
-
Use the EXPLORE feature on the SMM Web UI to confirm that the bogus readings have been filtered out.
-
Stop the simulator once you have verified the data.
In this lab, you will use NiFi to consume the Kafka messages containing the IoT data we ingested in the previous lab, call a CDSW model API endpoint to predict whether the machine where the readings came from is likely to break or not.
In preparation for the workshop we trained and deployed a Machine Learning model on the Cloudera Data Science Workbench (CDSW) running on your cluster. The model API can take a feature vector with the reading for the 12 temperature readings provided by the sensor and predict, based on that vector, if the machine is likely to break or not.
When the sensor data was sent to Kafka using the PublishKafkaRecord processor, we chose to attach the schema information in the header of Kafka messages. Now, instead of hard-coding which schema we should use to read the message, we can leverage that metadata to dynamically load the correct schema for each message.
To do this, though, we need to configure a different JsonTreeReader that will use the schema properties in the header, instead of the ${schema.name} attribute, as we did before.
We’ll also add a new RestLookupService controller service to perform the calls to the CDSW model API endpoint.
-
If you’re not in the Process Sensor Data process group, double-click on it to expand it. On the Operate panel (left-hand side), click on the cog icon (
 ) to access the Process Sensor Data process group’s configuration page.
 -
Click on the plus button (
 ), add a new JsonTreeReader, configure it as shown below and click Apply when you’re done:
On the SETTINGS tab:
Name: JsonTreeReader - With schema identifierOn the PROPERTIES tab:
Schema Access Strategy: HWX Schema Reference Attributes Schema Registry: HortonworksSchemaRegistry -
Click on the lightning bolt icon (
 ) to enable the JsonTreeReader - With schema identifier controller service.
 -
Click again on the plus button (
 ), add a RestLookupService controller service, configure it as shown below and click Apply when you’re done:
On the PROPERTIES tab:
URL: http://cdsw.<YOUR_CLUSTER_PUBLIC_IP>.nip.io/api/altus-ds-1/models/call-model Record Reader: JsonTreeReader Record Path: /responseNote<YOUR_CLUSTER_PUBLIC_IP>above must be replaced with your cluster’s public IP, not DNS name. The final URL should look something like this:http://cdsw.12.34.56.78.nip.io/api/altus-ds-1/models/call-model -
Click on the lightning bolt icon (
 ) to enable the RestLookupService controller service.
 -
Close the Process Sensor Data Configuration page.
We’ll now create the flow to read the sensor data from Kafka, execute a model prediction for each of them and write the results to Kudu. At the end of this section you flow should look like the one below:
-
We’ll add a new flow to the same canvas we were using before (inside the Process Sensor Data Process Group). Click on an empty area of the canvas and drag it to the side to give you more space to add new processors.
-
Add a ConsumeKafkaRecord_2_0 processor to the canvas and configure it as shown below:
SETTINGS tab:
Name: Consume Kafka iot messagesPROPERTIES tab:
Kafka Brokers: edge2ai-1.dim.local:9092 Topic Name(s): iot Topic Name Format: names Record Reader: JsonTreeReader - With schema identifier Record Writer: JsonRecordSetWriter Honor Transactions: false Group ID: iot-sensor-consumer Offset Reset: latest Headers to Add as Attributes (Regex): schema.* -
Add a new Funnel to the canvas and connect the Consume Kafka iot messages to it. When prompted, check the parse.failure relationship for this connection:
-
Add a LookupRecord processor to the canvas and configure it as shown below:
SETTINGS tab:
Name: Predict machine healthPROPERTIES tab:
Record Reader: JsonTreeReader - With schema identifier Record Writer: JsonRecordSetWriter Lookup Service: RestLookupService Result RecordPath: /response Routing Strategy: Route to 'success' Record Result Contents: Insert Entire Record -
Add 3 more user-defined properties by clicking on the plus button (
 ) for each of them:
mime.type: toString('application/json', 'UTF-8') request.body: concat('{"accessKey":"', '${cdsw.access.key}', '","request":{"feature":"', /sensor_0, ', ', /sensor_1, ', ', /sensor_2, ', ', /sensor_3, ', ', /sensor_4, ', ', /sensor_5, ', ', /sensor_6, ', ', /sensor_7, ', ', /sensor_8, ', ', /sensor_9, ', ', /sensor_10, ', ', /sensor_11, '"}}') request.method: toString('post', 'UTF-8') -
Click Apply to save the changes to the Predict machine health processor.
-
Connect the Consume Kafka iot messages processor to the Predict machine health one. When prompted, check the success relationship for this connection.
-
Connect the Predict machine health to the same Funnel you had created above. When prompted, check the failure relationship for this connection.
-
Add a UpdateRecord processor to the canvas and configure it as shown below:
SETTINGS tab:
Name: Update health flagPROPERTIES tab:
Record Reader: JsonTreeReader - With schema identifier Record Writer: JsonRecordSetWriter Replacement Value Strategy: Record Path Value -
Add one more user-defined propertie by clicking on the plus button (
 ):
):/is_healthy: /response/result -
Connect the Predict machine health processor to the Update health flag one. When prompted, check the success relationship for this connection.
-
Connect the Update health flag to the same Funnel you had created above. When prompted, check the failure relationship for this connection.
-
Add a PutKudu processor to the canvas and configure it as shown below:
SETTINGS tab:
Name: Write to KuduPROPERTIES tab:
Kudu Masters: edge2ai-1.dim.local:7051 Table Name: impala::default.sensors Record Reader: JsonTreeReader - With schema identifier -
Connect the Update health flag processor to the Write to Kudu one. When prompted, check the success relationship for this connection.
-
Connect the Write to Kudu to the same Funnel you had created above. When prompted, check the failure relationship for this connection.
-
Double-click on the Write to Kudu processor, go to the SETTINGS tab, check the "success" relationship in the AUTOMATICALLY TERMINATED RELATIONSHIPS section. Click Apply.
When we added the Predict machine health above, you may have noticed that one of the properties (request.body) makes a reference to a variable called cdsw.access.key. This is an application key required to authenticate with the CDSW Model API when requesting predictions. So, we need to provide the key to the LookupRecord processor by setting a variable with its value.
-
To get the Access Key, go to the CDSW Web UI and click on Models > Iot Prediction Model > Settings. Copy the Access Key.
-
Go back to the NiFi Web UI, right-click on an empty area of the Process Sensor Data canvas, and click on Variables.
-
Click on the plus button (
 ) and add the following variable:
Variable Name: cdsw.access.key Variable Value: <key copied from CDSW> -
Click Apply
-
Go to the Hue Web UI and login. The first user to login to a Hue installation is automatically created and granted admin privileges in Hue.
-
The Hue UI should open with the Impala Query Editor by default. If it doesn’t, you can always find it by clicking on Query button > Editor → Impala:
-
First, create the Kudu table. Login into Hue, and in the Impala Query, run this statement:
CREATE TABLE sensors
(
 sensor_id INT,
 sensor_ts TIMESTAMP,
 sensor_0 DOUBLE,
 sensor_1 DOUBLE,
 sensor_2 DOUBLE,
 sensor_3 DOUBLE,
 sensor_4 DOUBLE,
 sensor_5 DOUBLE,
 sensor_6 DOUBLE,
 sensor_7 DOUBLE,
 sensor_8 DOUBLE,
 sensor_9 DOUBLE,
 sensor_10 DOUBLE,
 sensor_11 DOUBLE,
 is_healthy INT,
 PRIMARY KEY (sensor_ID, sensor_ts)
)
PARTITION BY HASH PARTITIONS 16
STORED AS KUDU
TBLPROPERTIES ('kudu.num_tablet_replicas' = '1');
We’re ready not to run and test our flow. Follow the steps below:
-
Start all the processors in your flow.
-
If the simulator is not already running, start it again on your SSH window:
python mqtt.iot_simulator.py mqtt.iot.config -
Refresh your NiFi page and you should see messages passing through your flow. The failure queues should have no records queued up.
-
On Lab 10, you will learn how to query and verify the records inserted into Kudu.
|
Note
|
This lab is optional, since it does the same processing we performed in Lab 8 but using Spark instead of NiFi. If you want to run this lab, stop the flow created in Lab 8 first, to avoid duplicated data being sent into Kudu. Otherwise, just skip to Lab 10 |
Spark Streaming is a processing framework for (near) real-time data. In this lab, you will use Spark to consume Kafka messages which contains the IoT data from the machine, and call the model API endpoint to predict whether, with those IoT values the machine sent, the machine is likely to break. Then save the results to Kudu for fast analytics.
|
Note
|
If you already executed this step in the previous lab, please skip the table creation here. |
-
Go to the Hue Web UI and login. The first user to login to a Hue installation is automatically created and granted admin privileges in Hue.
-
The Hue UI should open with the Impala Query Editor by default. If it doesn’t, you can always find it by clicking on Query button > Editor → Impala:
-
First, create the Kudu table. Login into Hue, and in the Impala Query, run this statement:
CREATE TABLE sensors
(
 sensor_id INT,
 sensor_ts TIMESTAMP,
 sensor_0 DOUBLE,
 sensor_1 DOUBLE,
 sensor_2 DOUBLE,
 sensor_3 DOUBLE,
 sensor_4 DOUBLE,
 sensor_5 DOUBLE,
 sensor_6 DOUBLE,
 sensor_7 DOUBLE,
 sensor_8 DOUBLE,
 sensor_9 DOUBLE,
 sensor_10 DOUBLE,
 sensor_11 DOUBLE,
 is_healthy INT,
 PRIMARY KEY (sensor_ID, sensor_ts)
)
PARTITION BY HASH PARTITIONS 16
STORED AS KUDU
TBLPROPERTIES ('kudu.num_tablet_replicas' = '1');
-
Open a second Terminal and SSH into the VM. The first is running the sensor data simulator, so you can’t use it.
ACCESS_KEY=<put here your cdsw model access key>
PUBLIC_IP=$(curl https://api.ipify.org/)
mv ~/edge2ai-workshop/spark.iot.py ~
sed -i "s/YourHostname/$(hostname -f)/" spark.iot.py
sed -i "s/YourCDSWDomain/cdsw.$PUBLIC_IP.nip.io/" spark.iot.py
sed -i "s/YourAccessKey/$ACCESS_KEY/" spark.iot.py
wget http://central.maven.org/maven2/org/apache/kudu/kudu-spark2_2.11/1.9.0/kudu-spark2_2.11-1.9.0.jar

wget https://raw.githubusercontent.com/swordsmanliu/SparkStreamingHbase/master/lib/spark-core_2.11-1.5.2.logging.jar

rm -rf ~/.m2 ~/.ivy2/
spark-submit \
  --master local[2] \
  --jars kudu-spark2_2.11-1.9.0.jar,spark-core_2.11-1.5.2.logging.jar \
  --packages org.apache.spark:spark-streaming-kafka_2.11:1.6.3 \
  spark.iot.py
-
Spark Streaming will flood your screen with log messages, however, at a 5 seconds interval, you should be able to spot a table: these are the messages that were consumed from Kafka and processed by Spark. You can configure Spark for a smaller time window, however, for this exercise 5 seconds is sufficient.
In this lab, you will run some SQL queries using the Impala engine. You can run a report to inform you which machines are likely to break in the near future.
-
Login into Hue and run the following queries in the Impala Query Editor:
SELECT sensor_id, sensor_ts
FROM sensors
WHERE is_healthy = 0;
SELECT is_healthy, count(*) as occurrences
FROM sensors
GROUP BY is_healthy;
-
Run a few times the SQL statements and verify that the number of occurrences are increasing as the data is ingested by either NiFi or the Spark job. This allows you to build real-time reports for fast action.
In this and the following lab, you will wear the hat of a Data Scientist. You will write the model code, train it several times and finally deploy the model to Production. All within 30 minutes!
-
Open CDSW Web UI and log in as
admin, if you haven’t yet done so. -
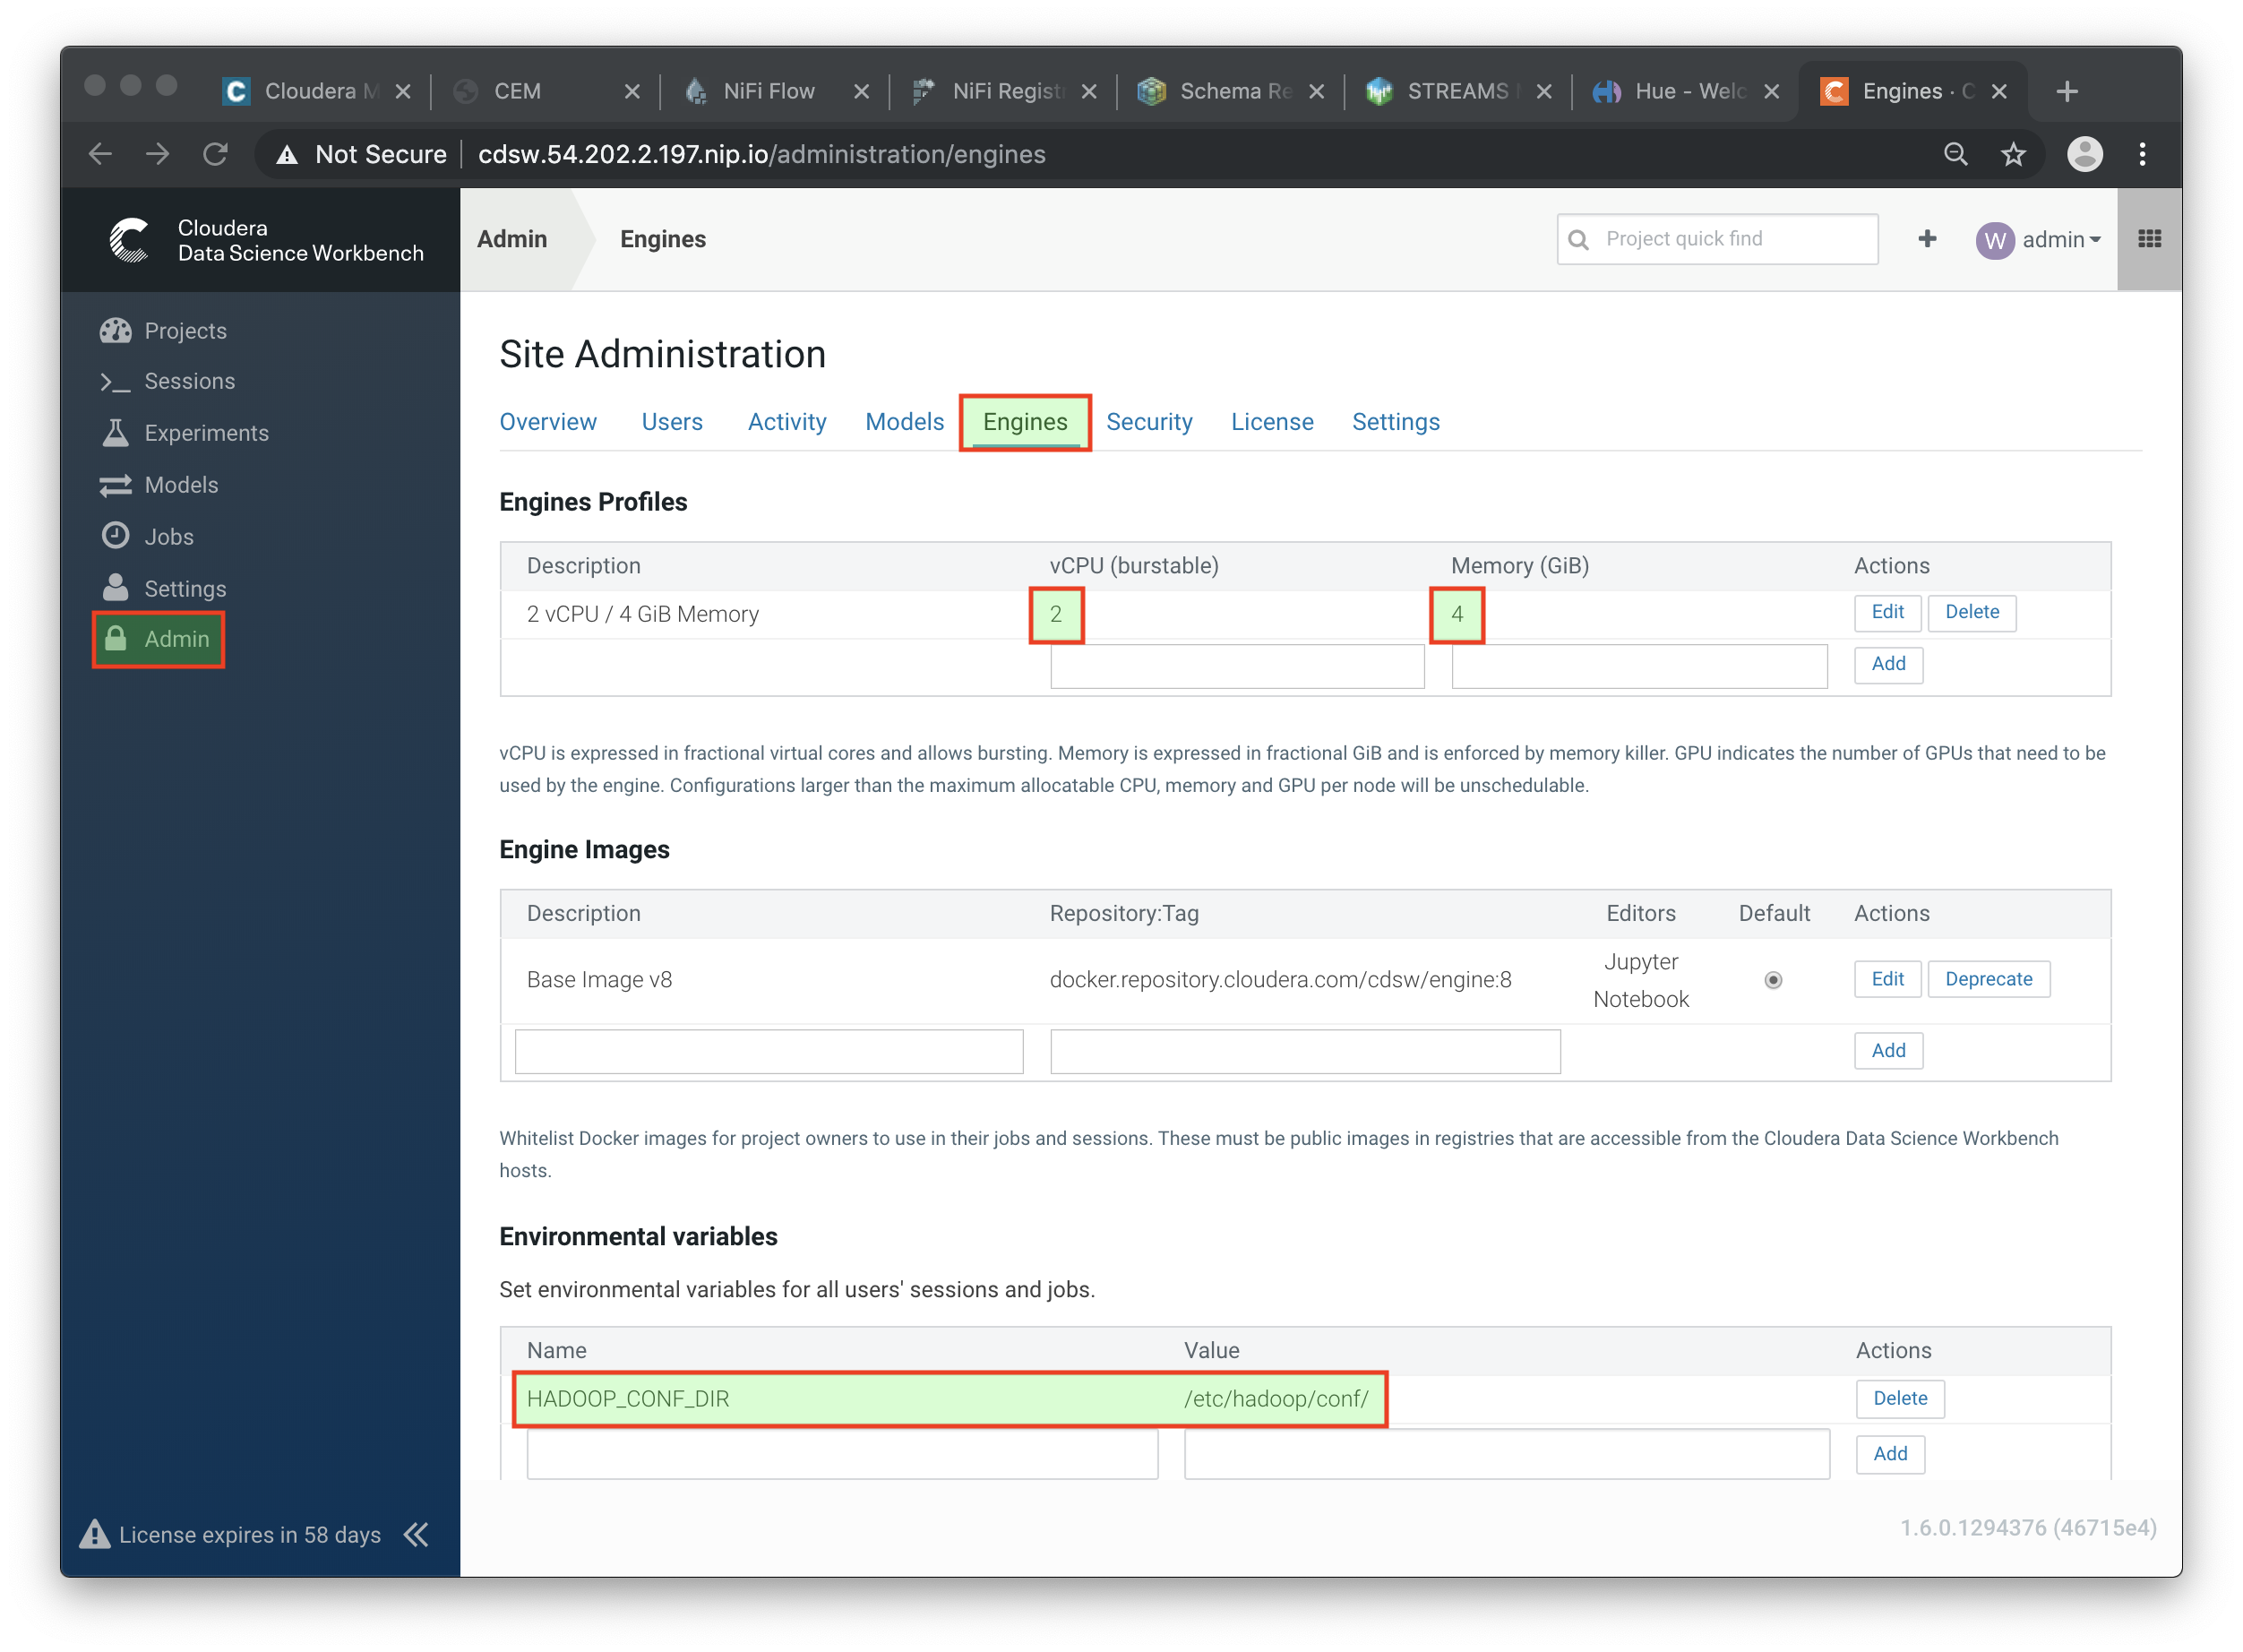
Navigate to the CDSW Admin page to fine tune the environment:
-
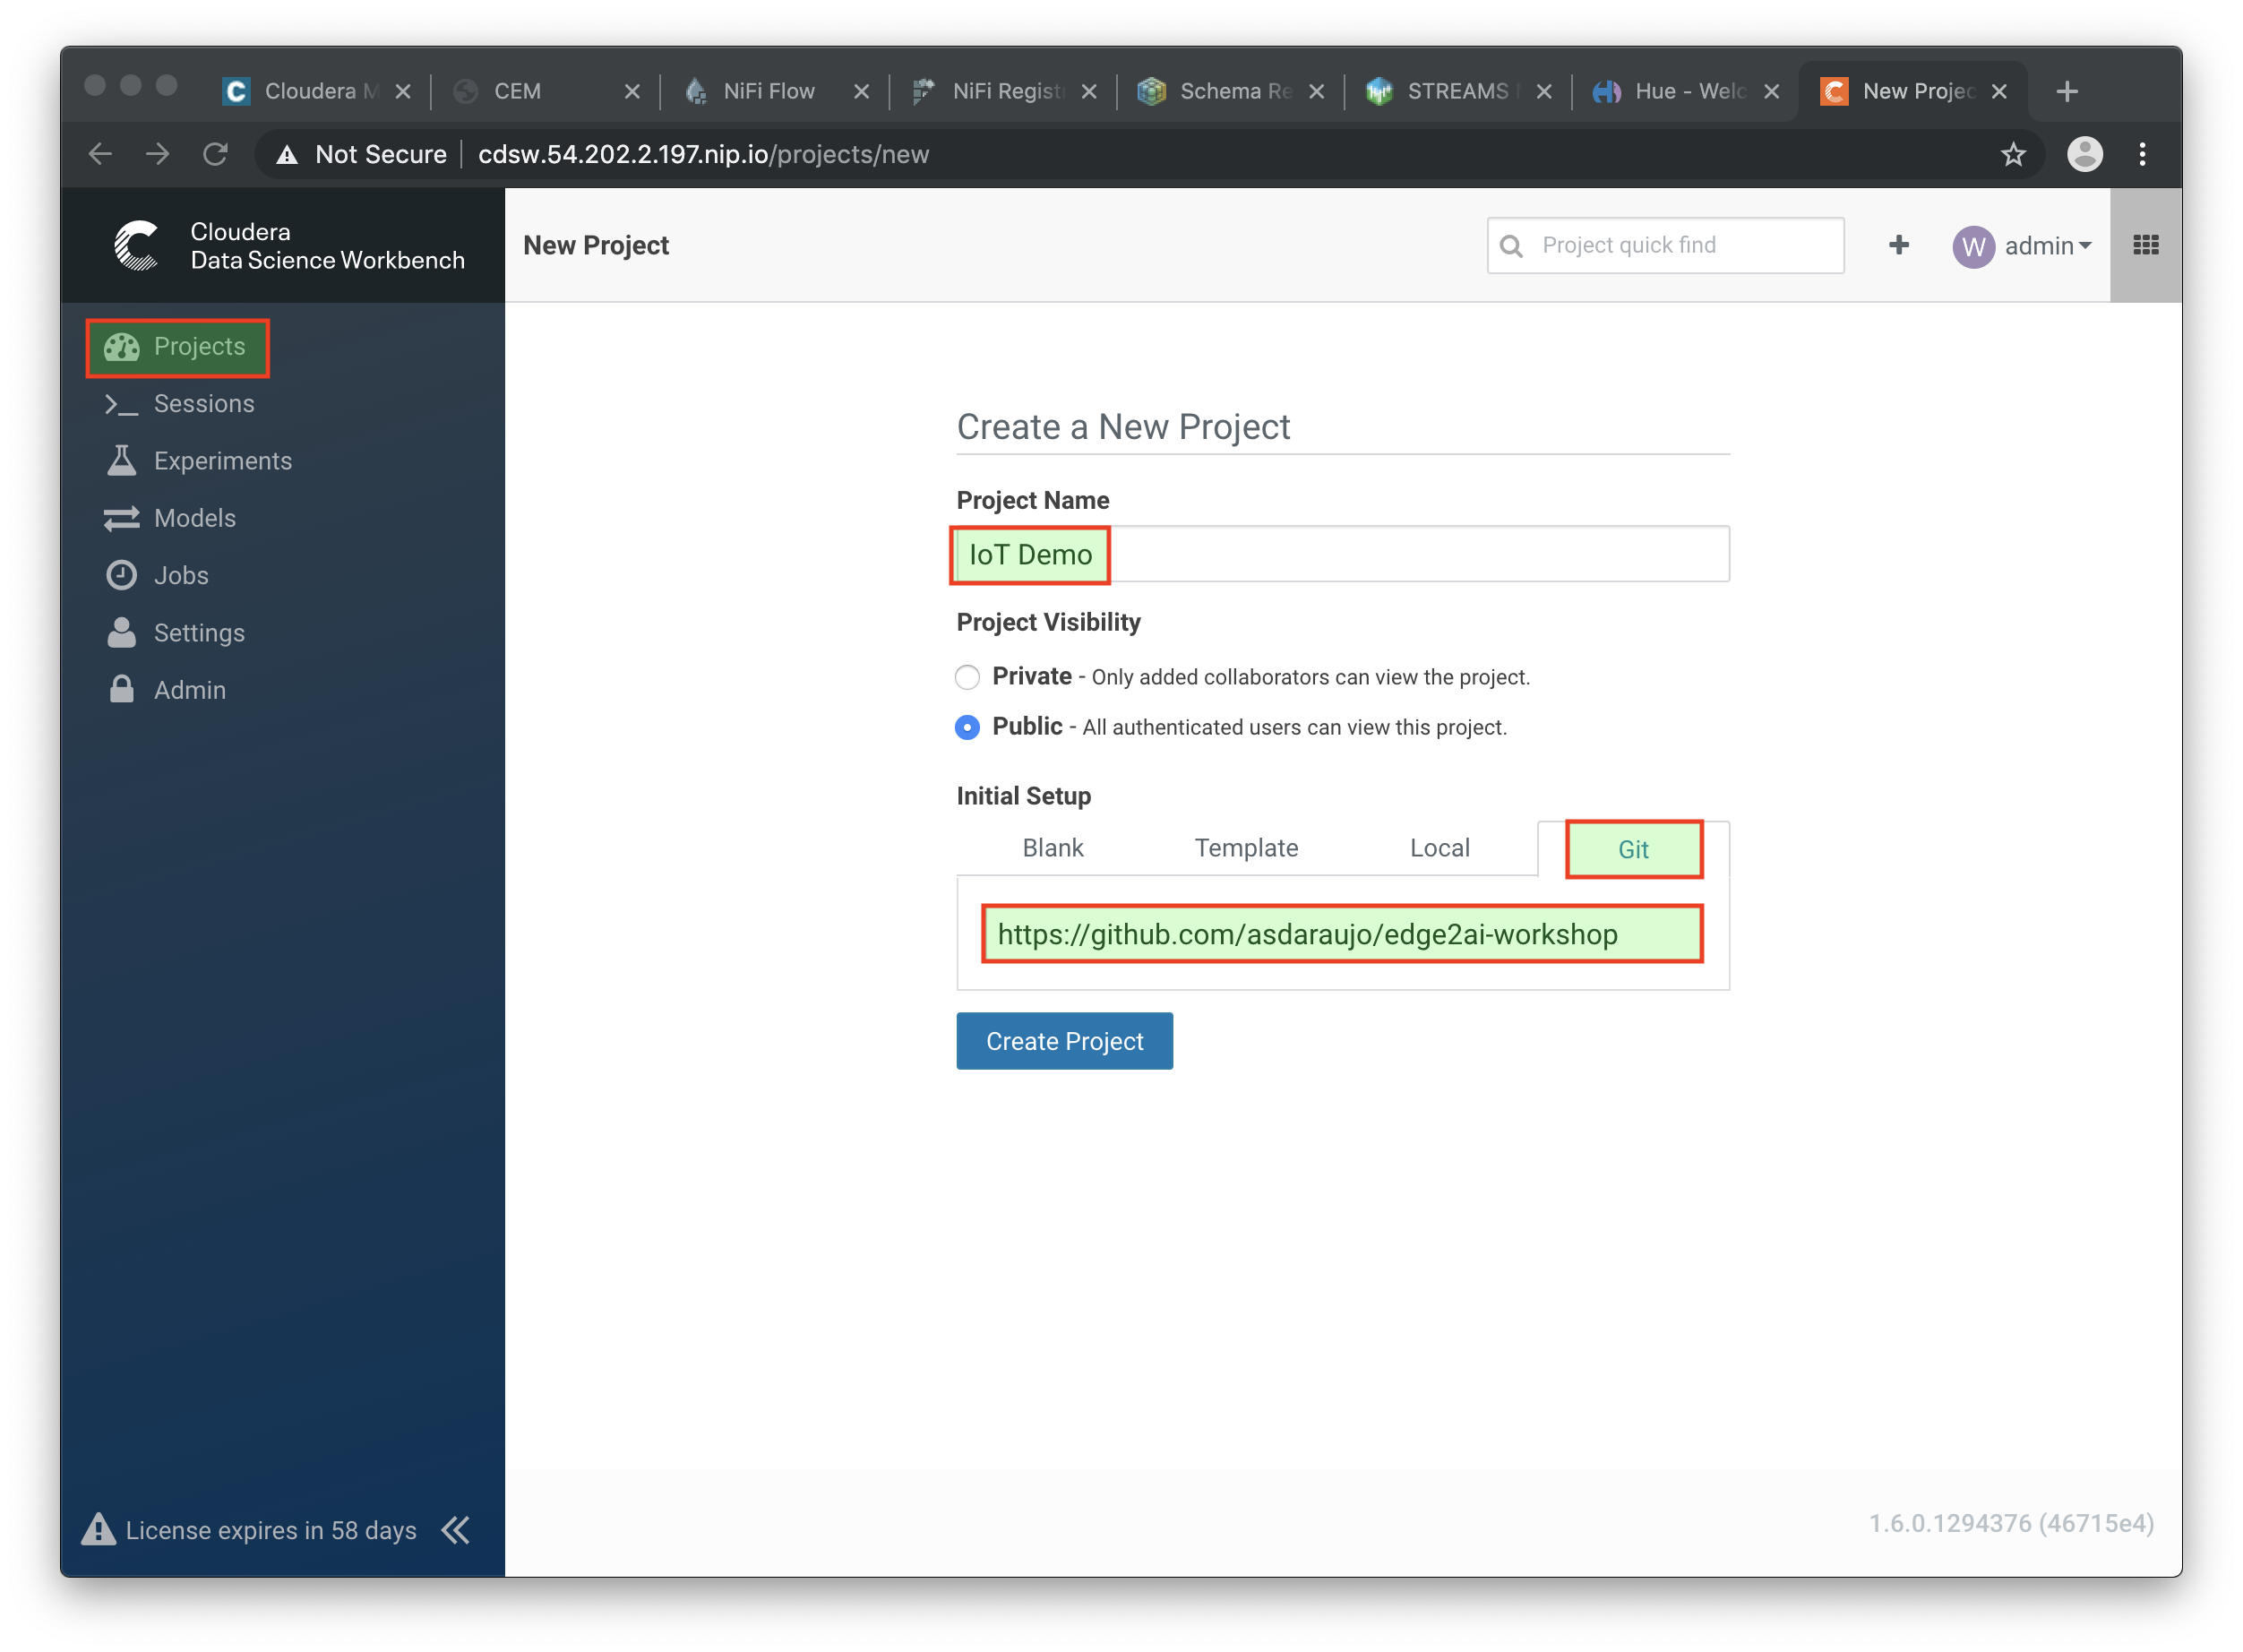
Return to the main page and click on New Project, using this GitHub project as the source:
https://github.com/cloudera-labs/edge2ai-workshop -
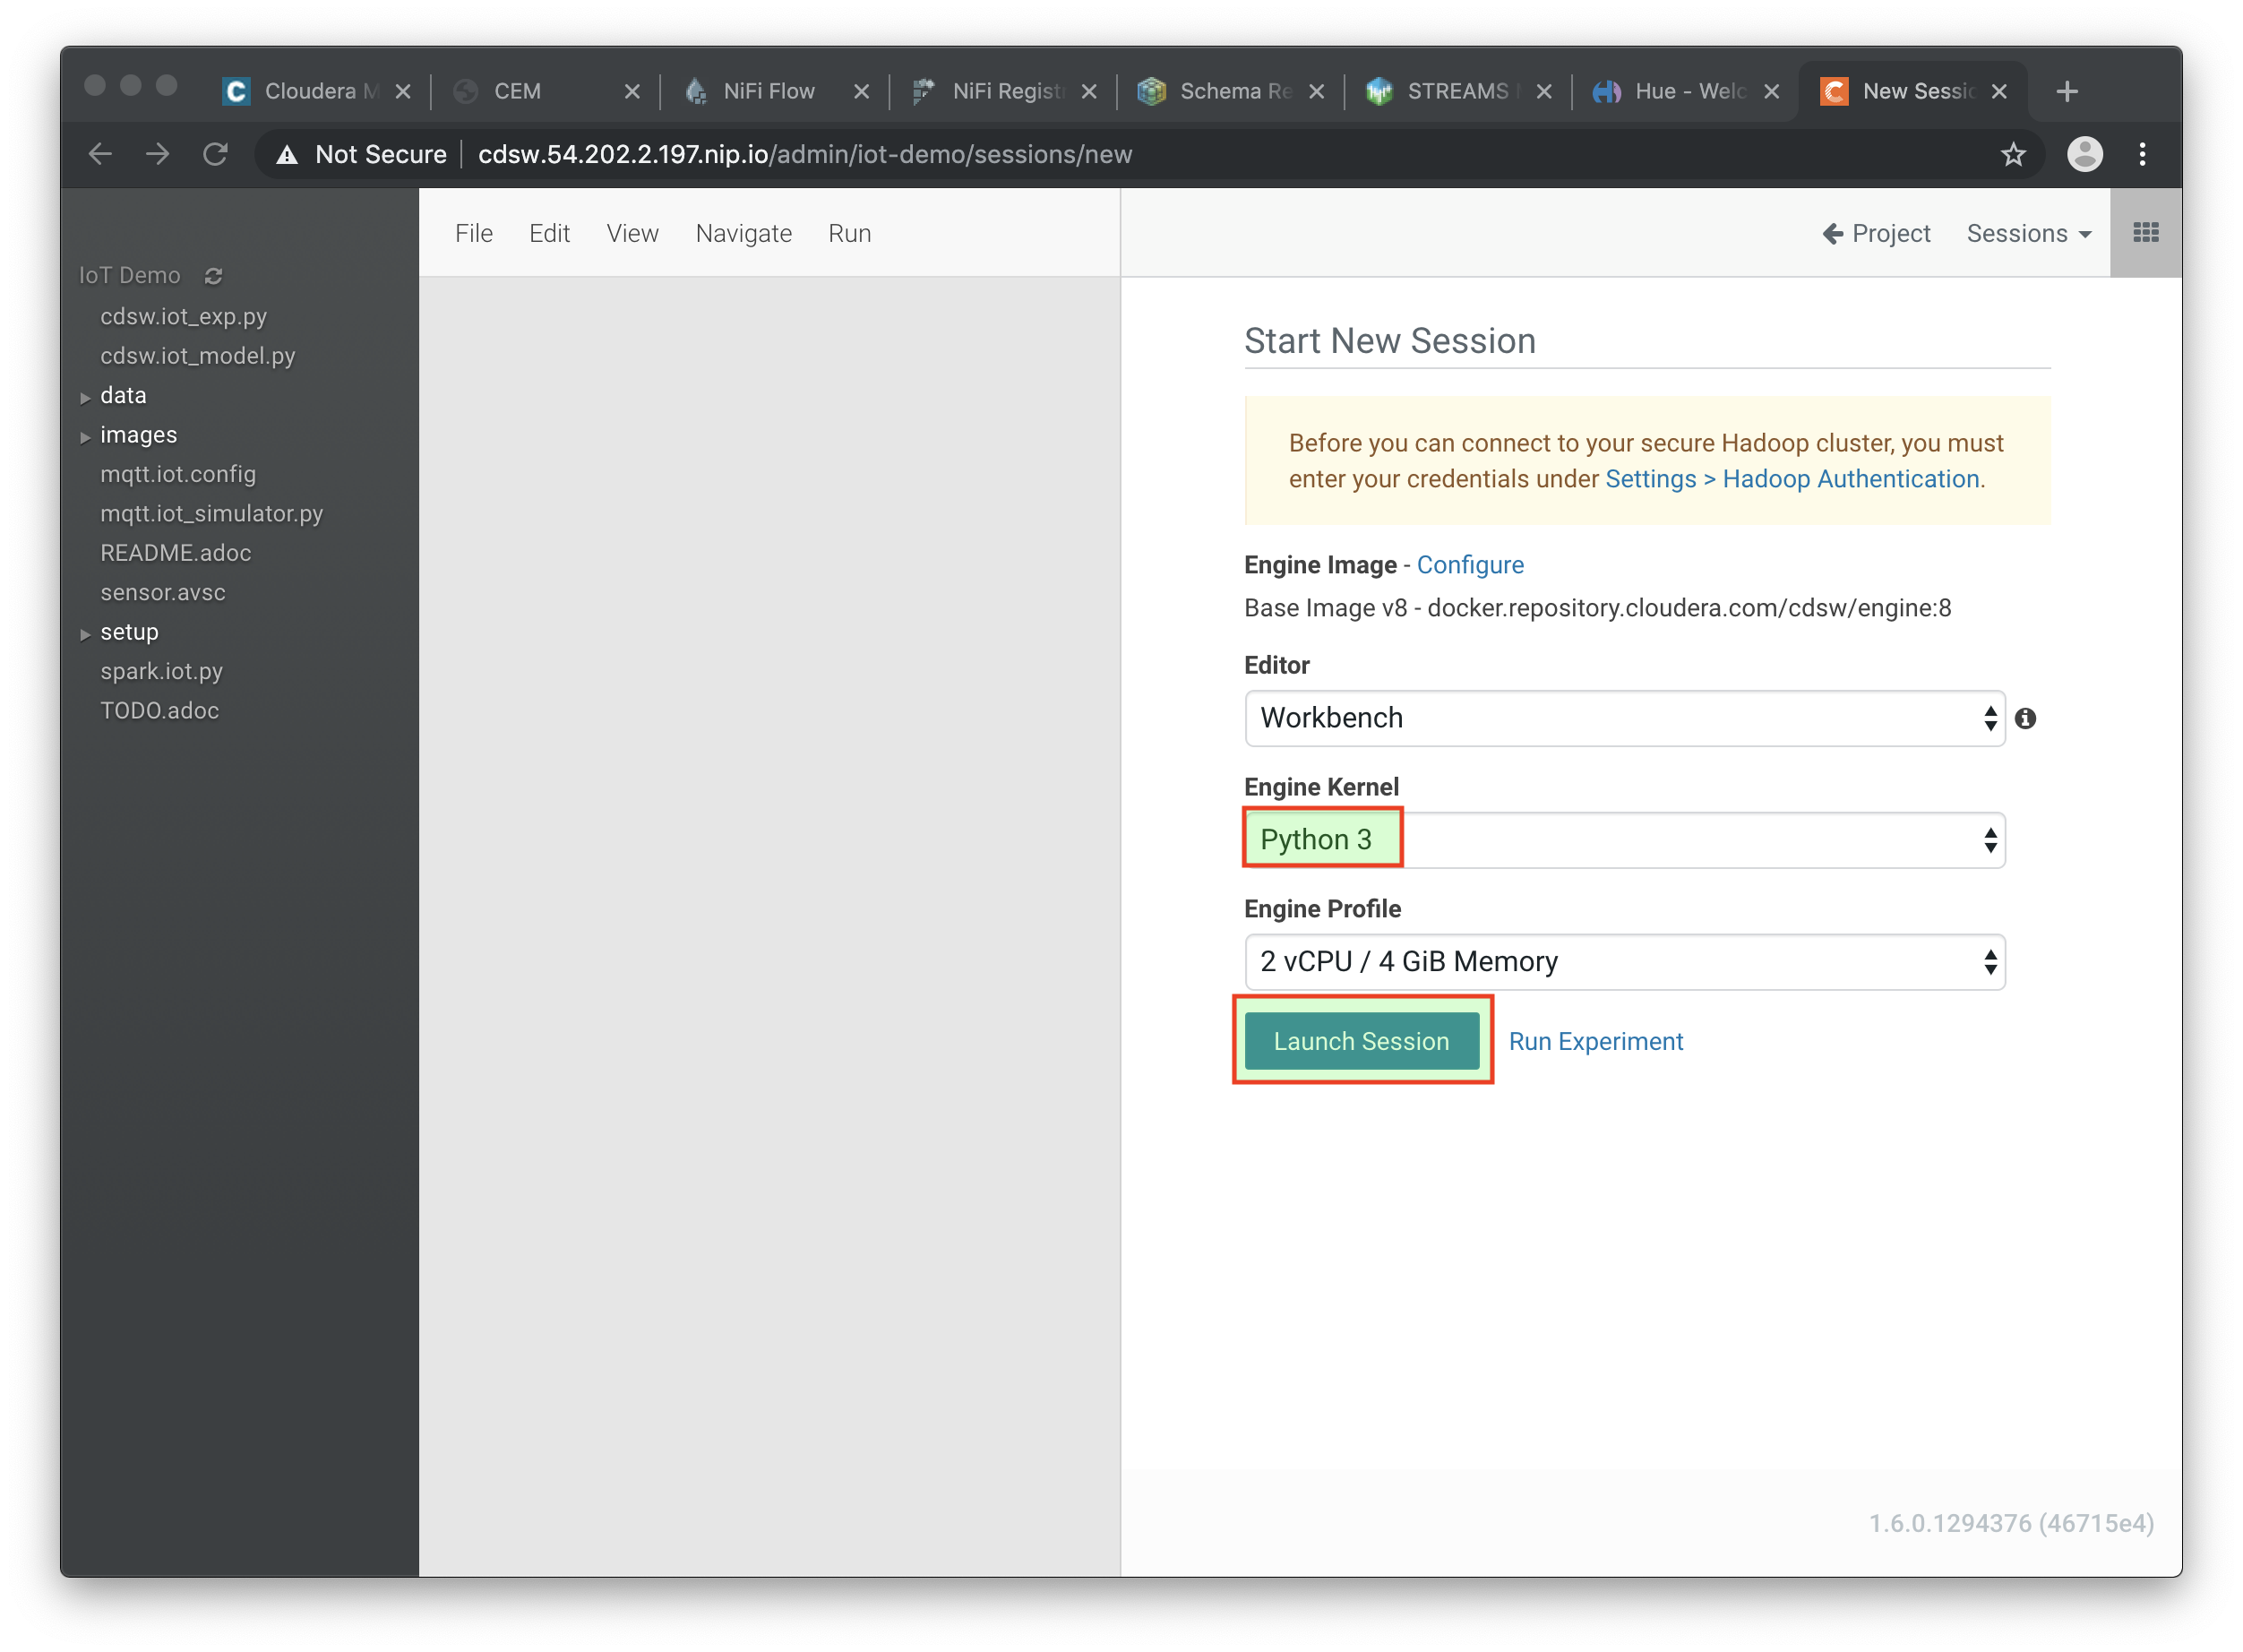
Now that your project has been created, click on Open Workbench and start a Python3 session:
-
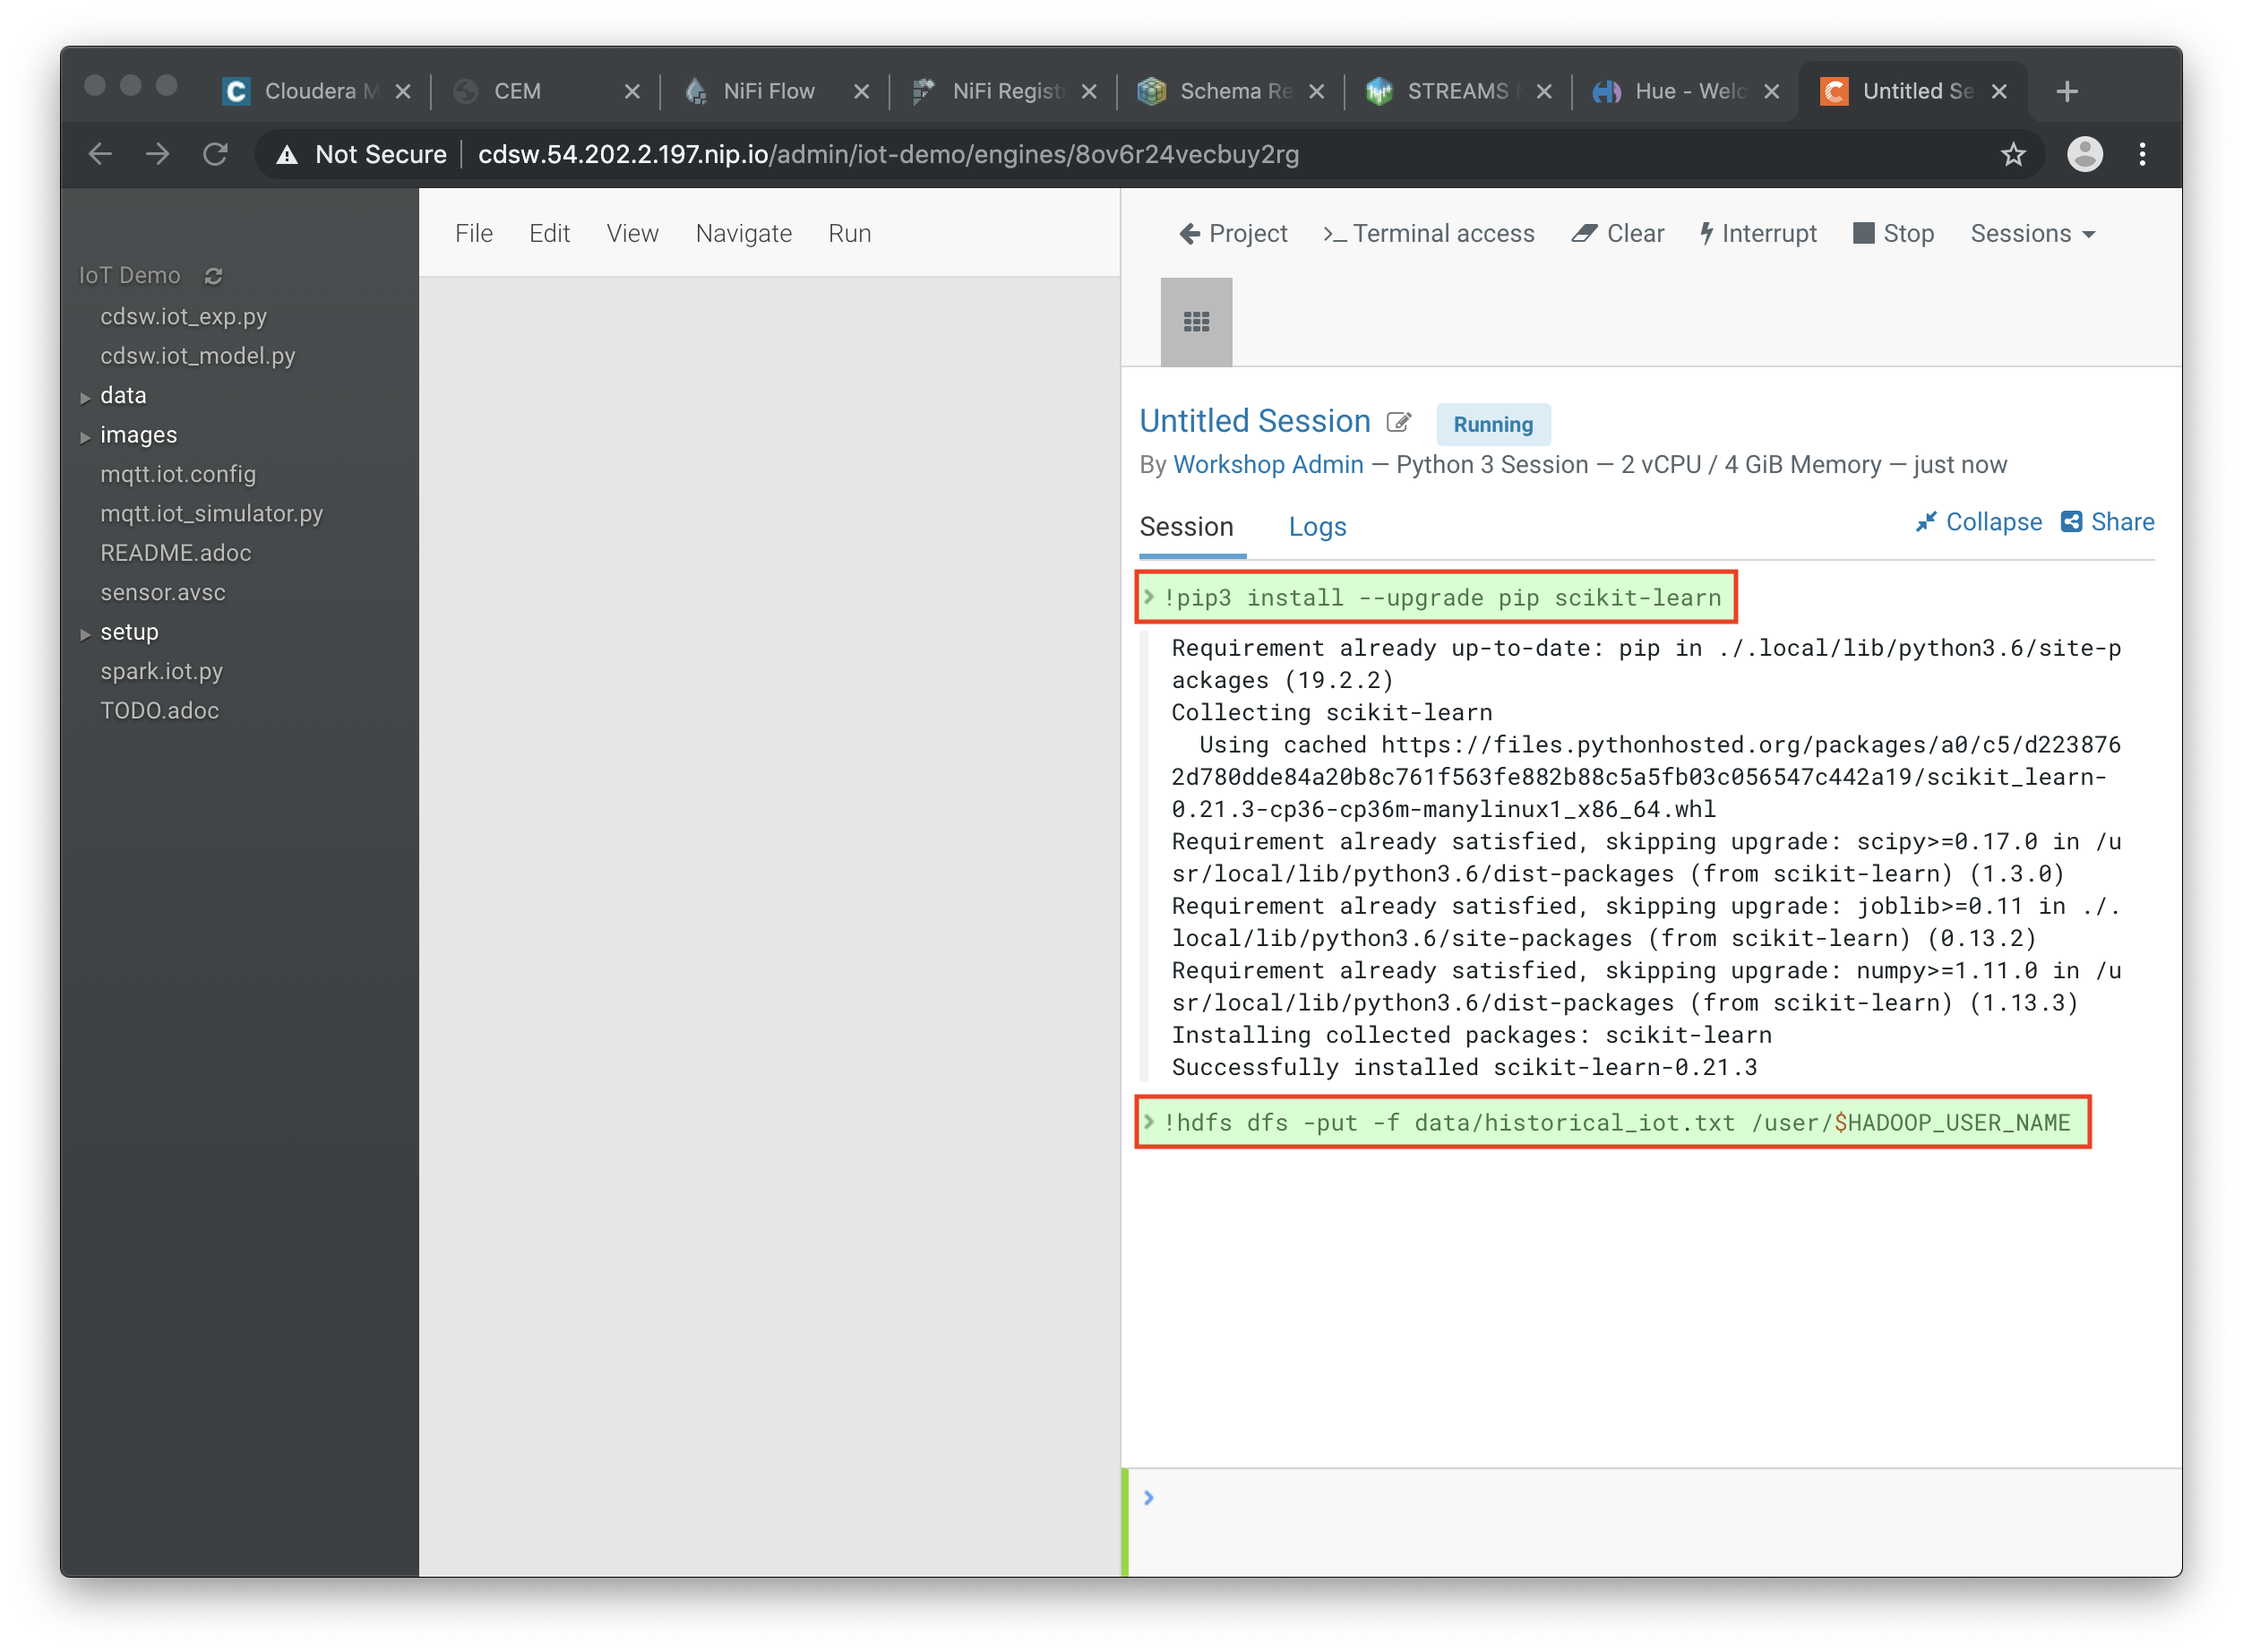
Once the Engine is ready, run the following command to install some required libraries:
!pip3 install --upgrade pip scikit-learn -
The project comes with a historical dataset. Copy this dataset into HDFS:
!hdfs dfs -put -f data/historical_iot.txt /user/$HADOOP_USER_NAME -
You’re now ready to run the Experiment to train the model on your historical data.
-
You can stop the Engine at this point.
Open the file cdsw.iot_exp.py. This is a python program that builds a model to predict machine failure (the likelihood that this machine is going to fail). There is a dataset available on hdfs with customer data, including a failure indicator field.
The program is going to build a failure prediction model using the Random Forest algorithm. Random forests are ensembles of decision trees. Random forests are one of the most successful machine learning models for classification and regression. They combine many decision trees in order to reduce the risk of overfitting. Like decision trees, random forests handle categorical features, extend to the multiclass classification setting, do not require feature scaling, and are able to capture non-linearities and feature interactions.
spark.mllib supports random forests for binary and multiclass classification and for regression, using both continuous and categorical features. spark.mllib implements random forests using the existing decision tree implementation. Please see the decision tree guide for more information on trees.
The Random Forest algorithm expects a couple of parameters:
-
numTrees: Number of trees in the forest.
Increasing the number of trees will decrease the variance in predictions, improving the model’s test-time accuracy. Training time increases roughly linearly in the number of trees.
-
maxDepth: Maximum depth of each tree in the forest.
Increasing the depth makes the model more expressive and powerful. However, deep trees take longer to train and are also more prone to overfitting. In general, it is acceptable to train deeper trees when using random forests than when using a single decision tree. One tree is more likely to overfit than a random forest (because of the variance reduction from averaging multiple trees in the forest).
In the cdsw.iot_exp.py program, these parameters can be passed to the program at runtime, to these python variables:
param_numTrees = int(sys.argv[1])
param_maxDepth = int(sys.argv[2])
Also note the quality indicator for the Random Forest model, are written back to the Data Science Workbench repository:
cdsw.track_metric("auroc", auroc)
cdsw.track_metric("ap", ap)
These indicators will show up later in the Experiments dashboard.
-
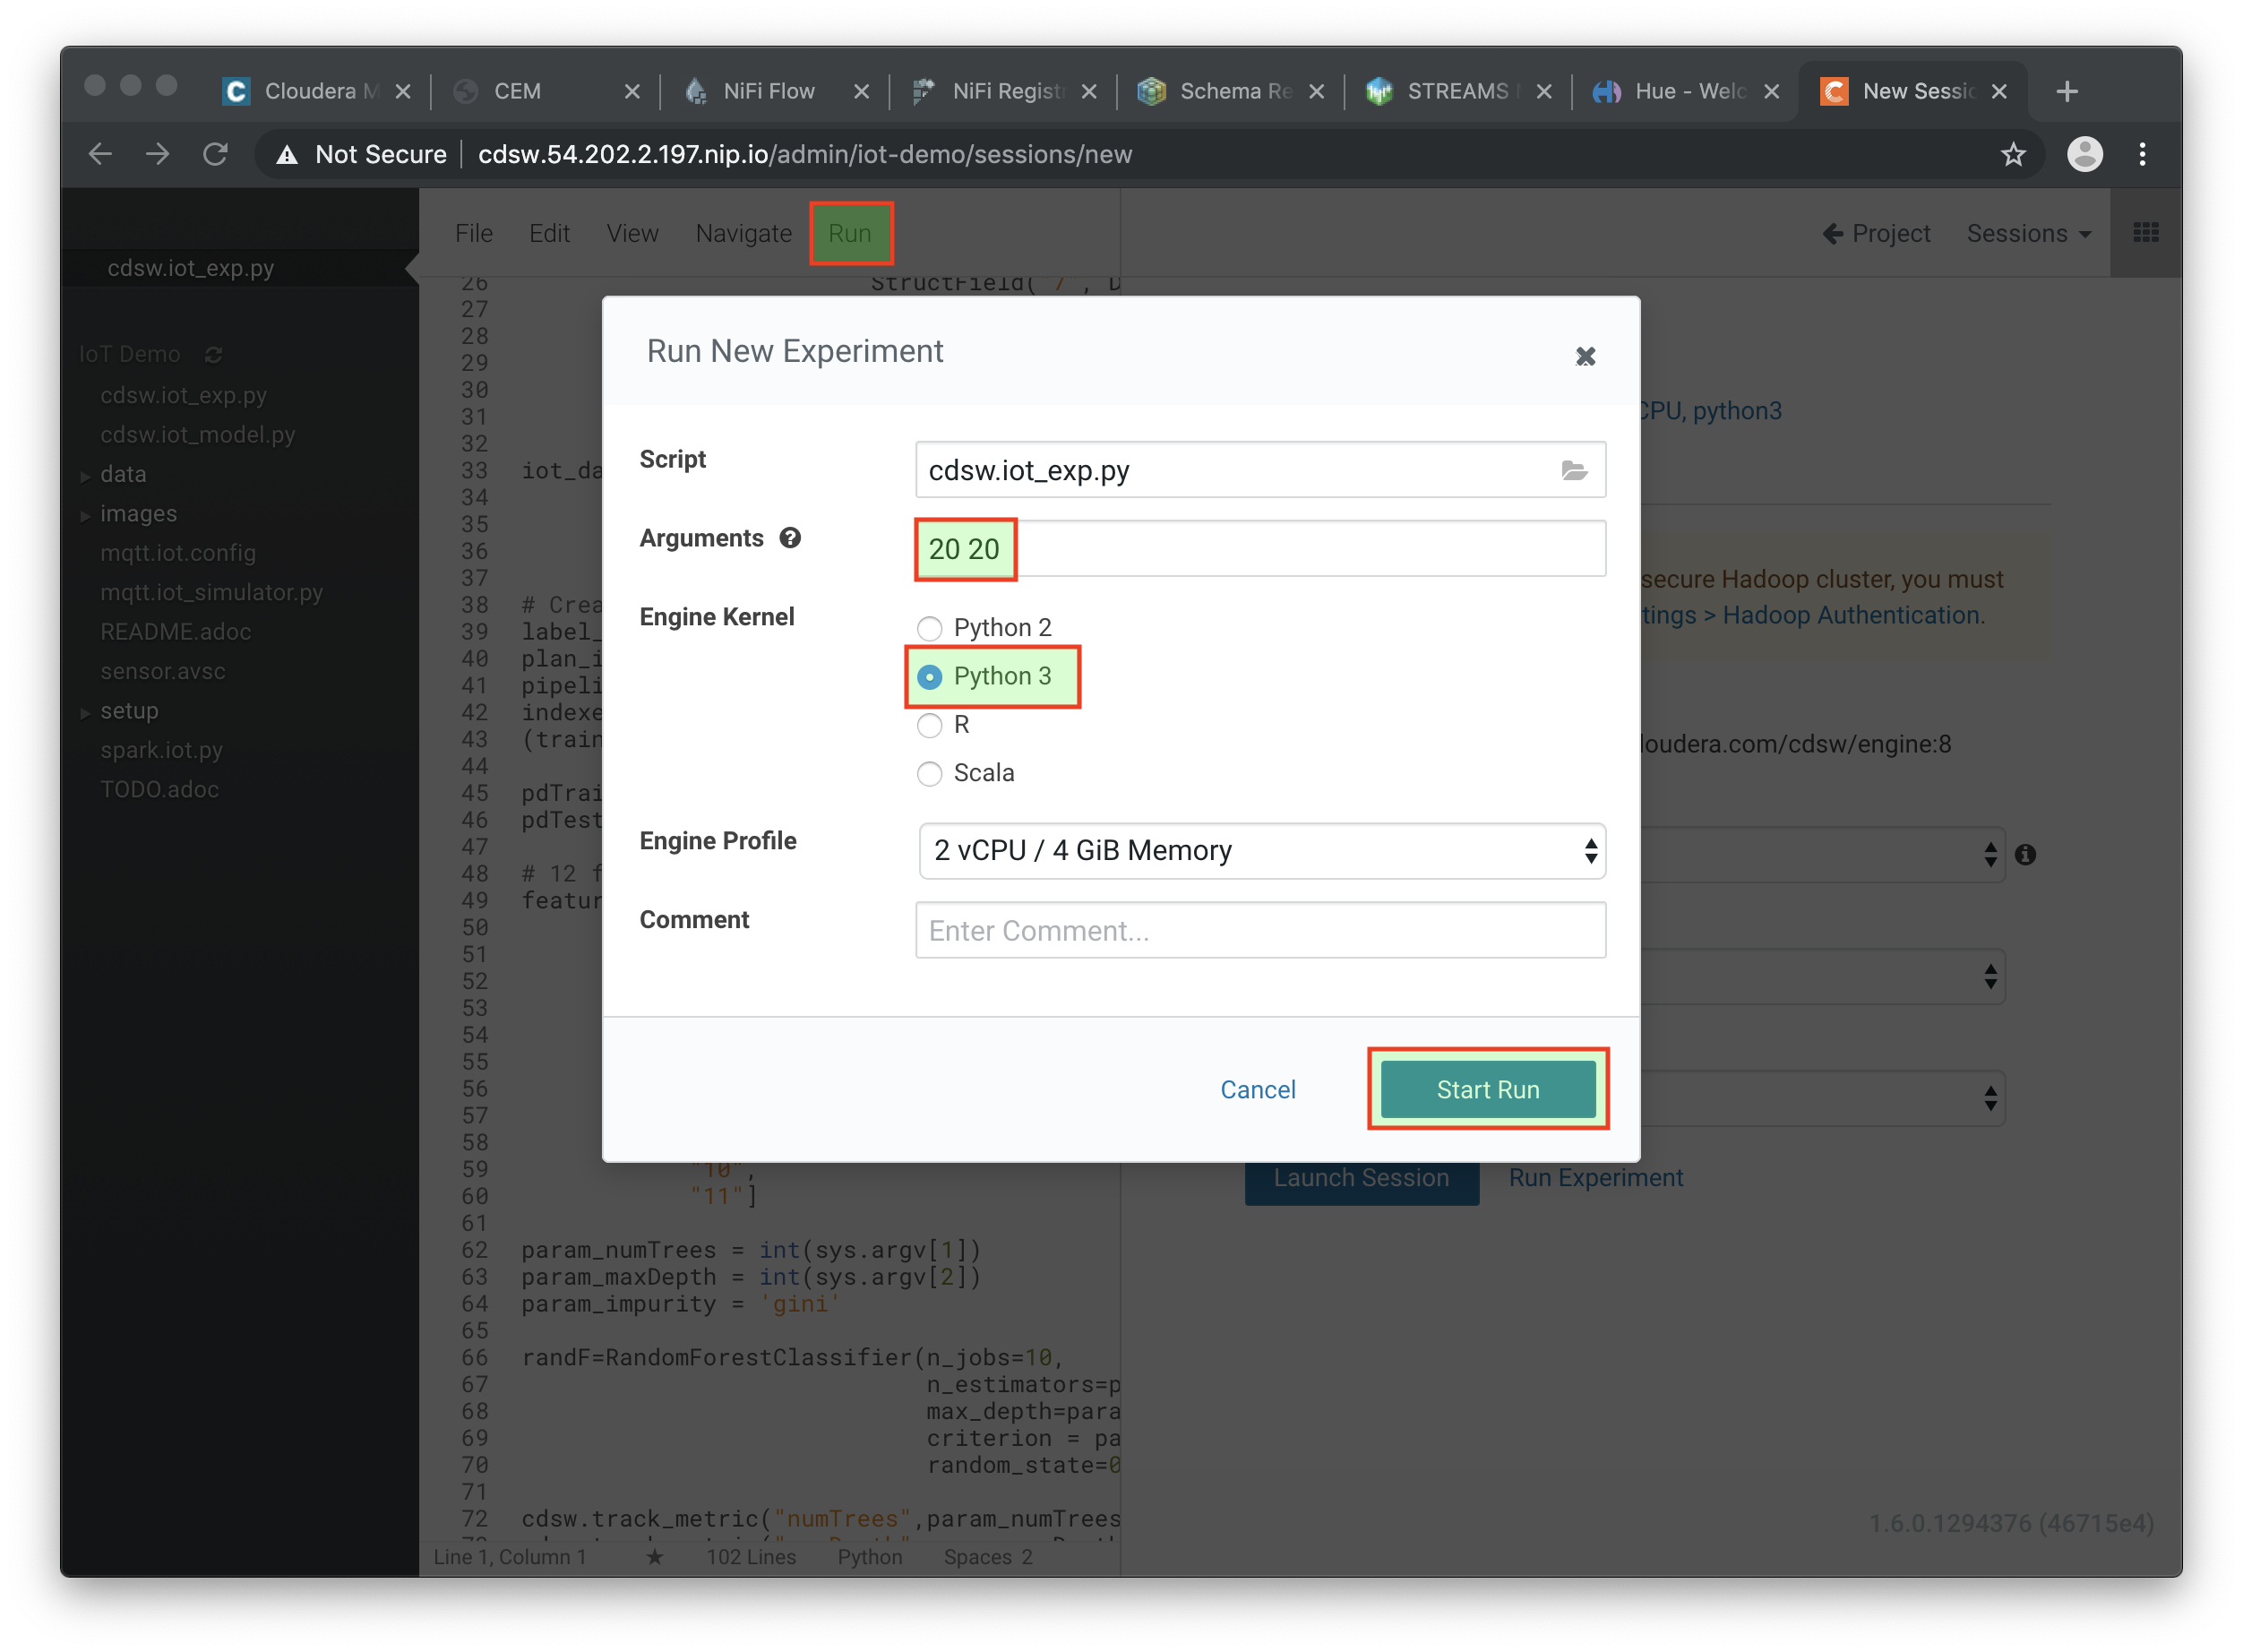
Now, run the experiment using the following parameters:
numTrees = 20 numDepth = 20
-
From the menu, select
Run → Run Experiments…. Now, in the background, the Data Science Workbench environment will spin up a new docker container, where this program will run. -
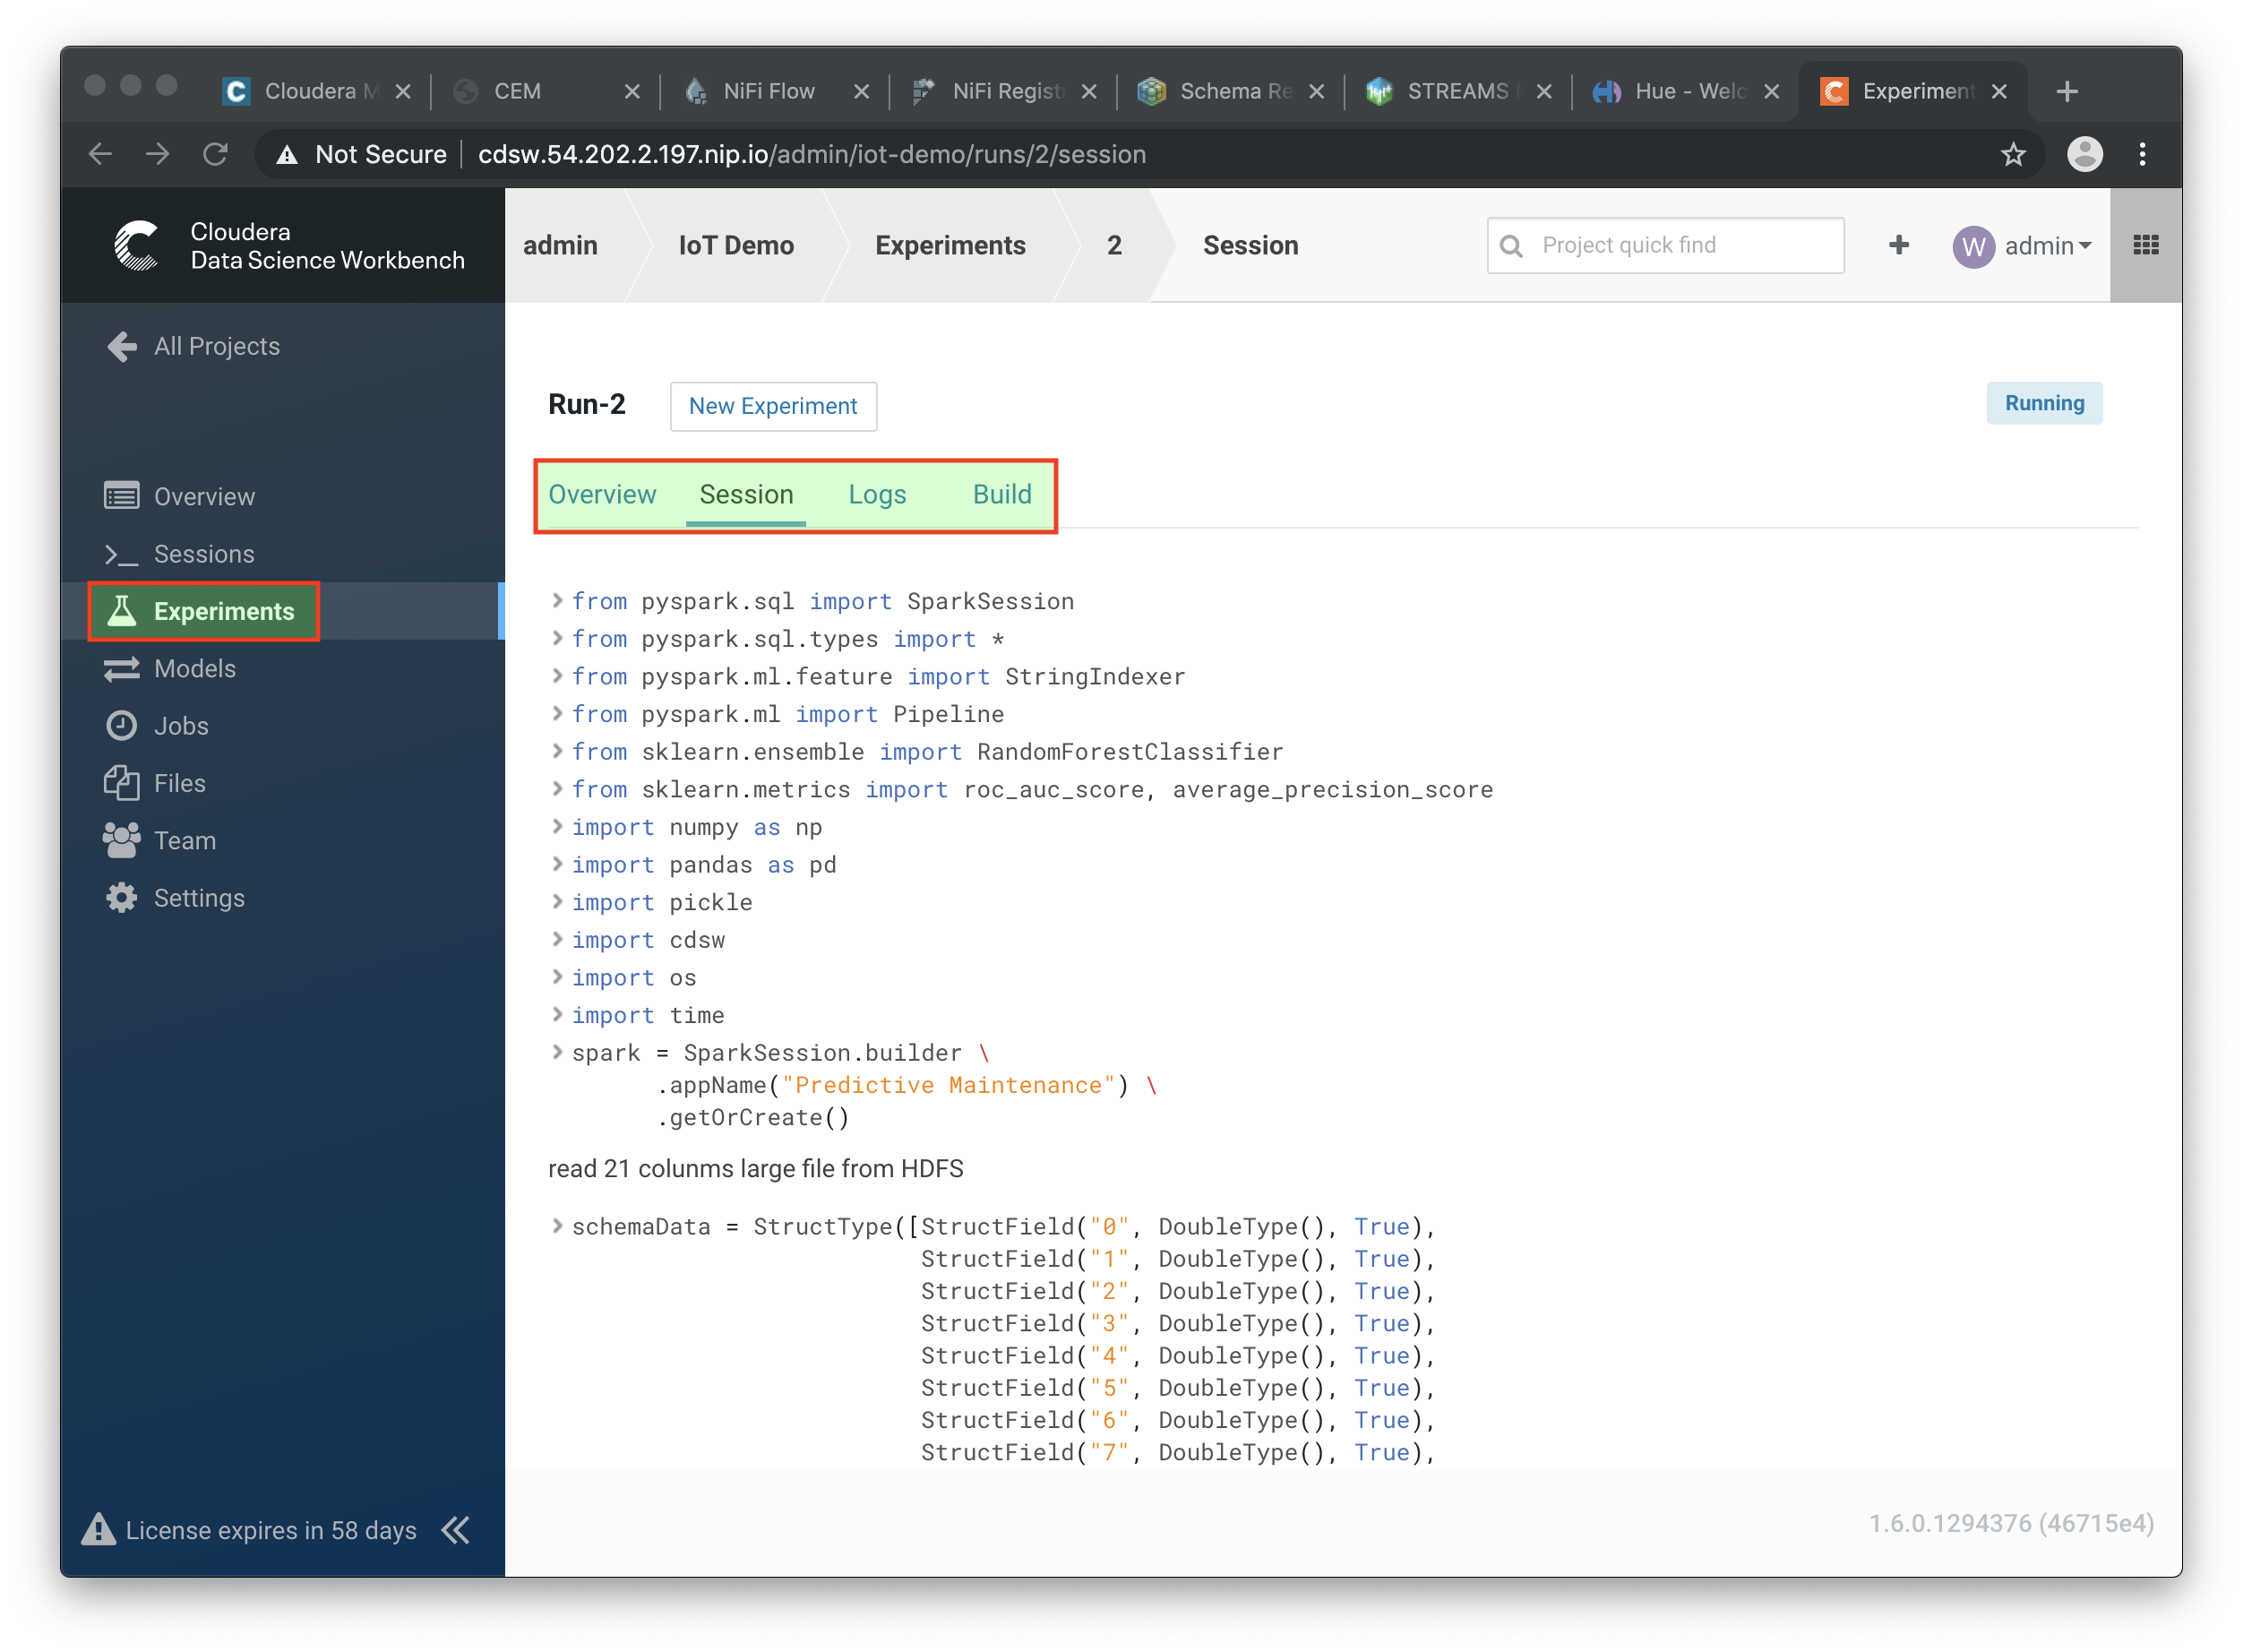
Go back to the Projects page in CDSW, and hit the Experiments button.
-
If the Status indicates
Running, you have to wait till the run is completed. In case the status isBuild FailedorFailed, check the log information. This is accessible by clicking on the run number of your experiments. There you can find the session log, as well as the build information. -
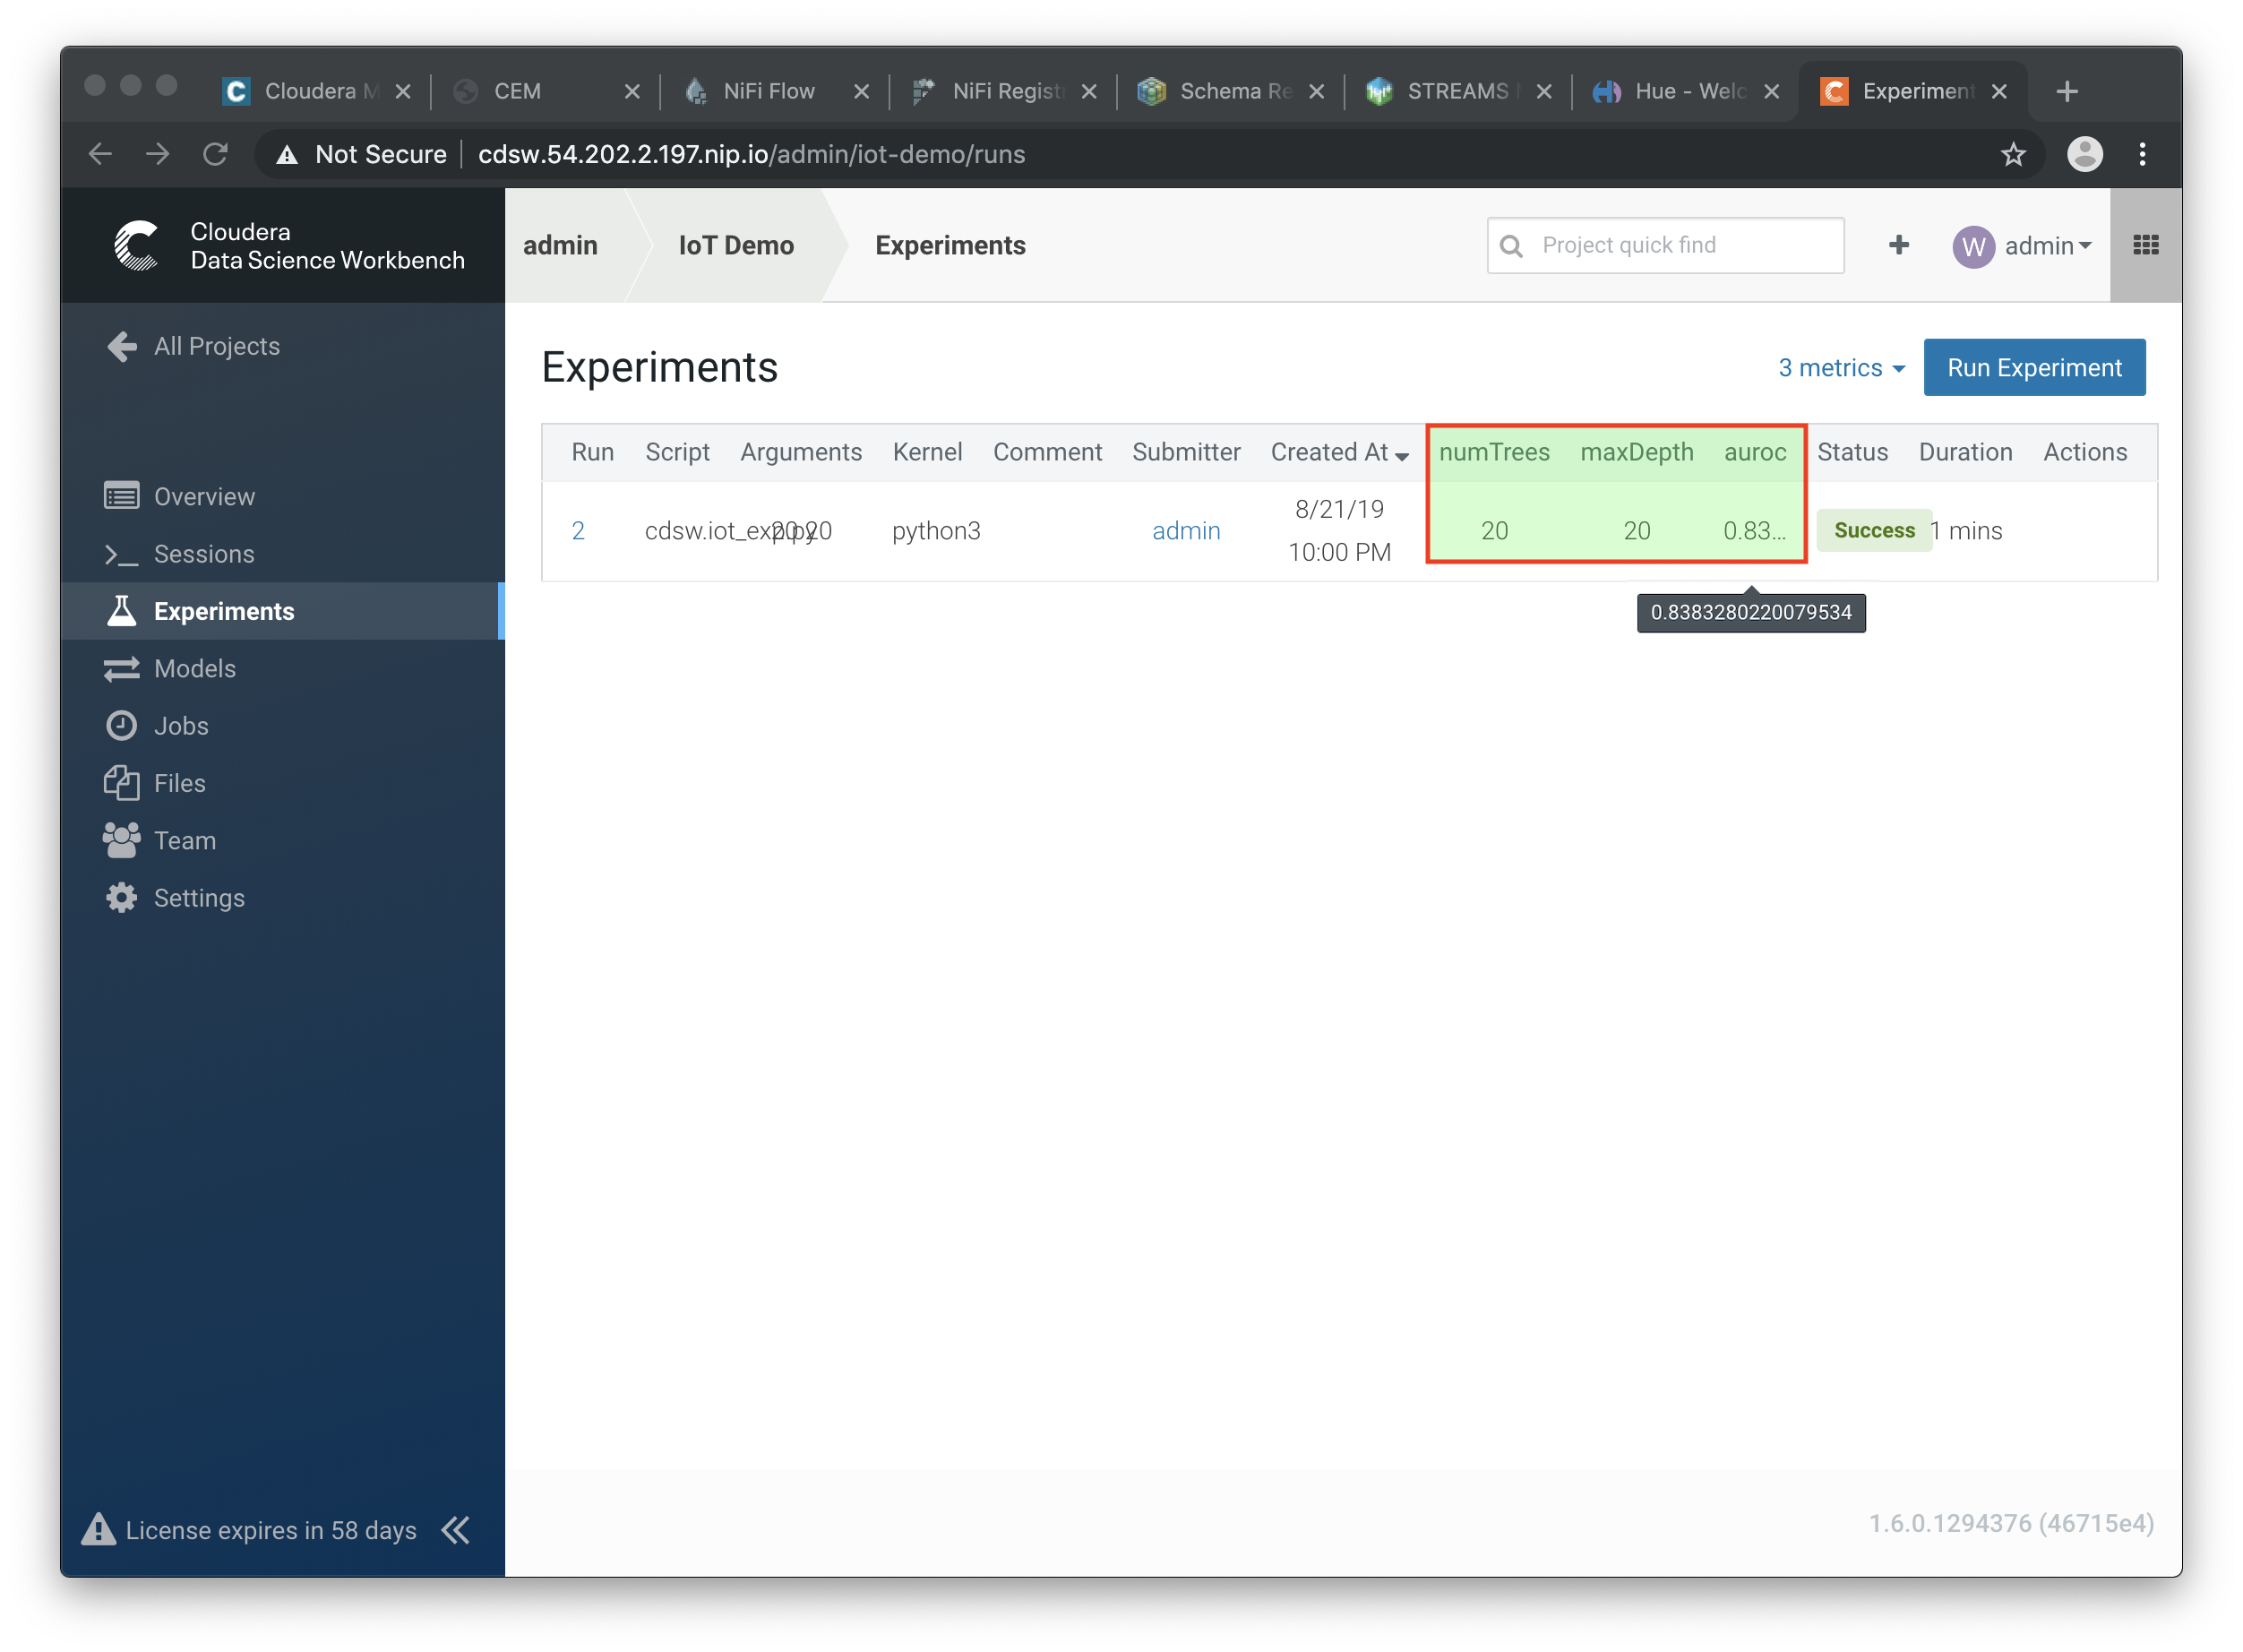
In case your status indicates
Success, you should be able to see the auroc (Area Under the Curve) model quality indicator. It might be that this value is hidden by the CDSW user interface. In that case, click on the ‘3 metrics’ links, and select the auroc field. It might be needed to de-select some other fields, since the interface can only show 3 metrics at the same time. -
In this example,
~0.8383. Not bad, but maybe there are better hyper parameter values available.
-
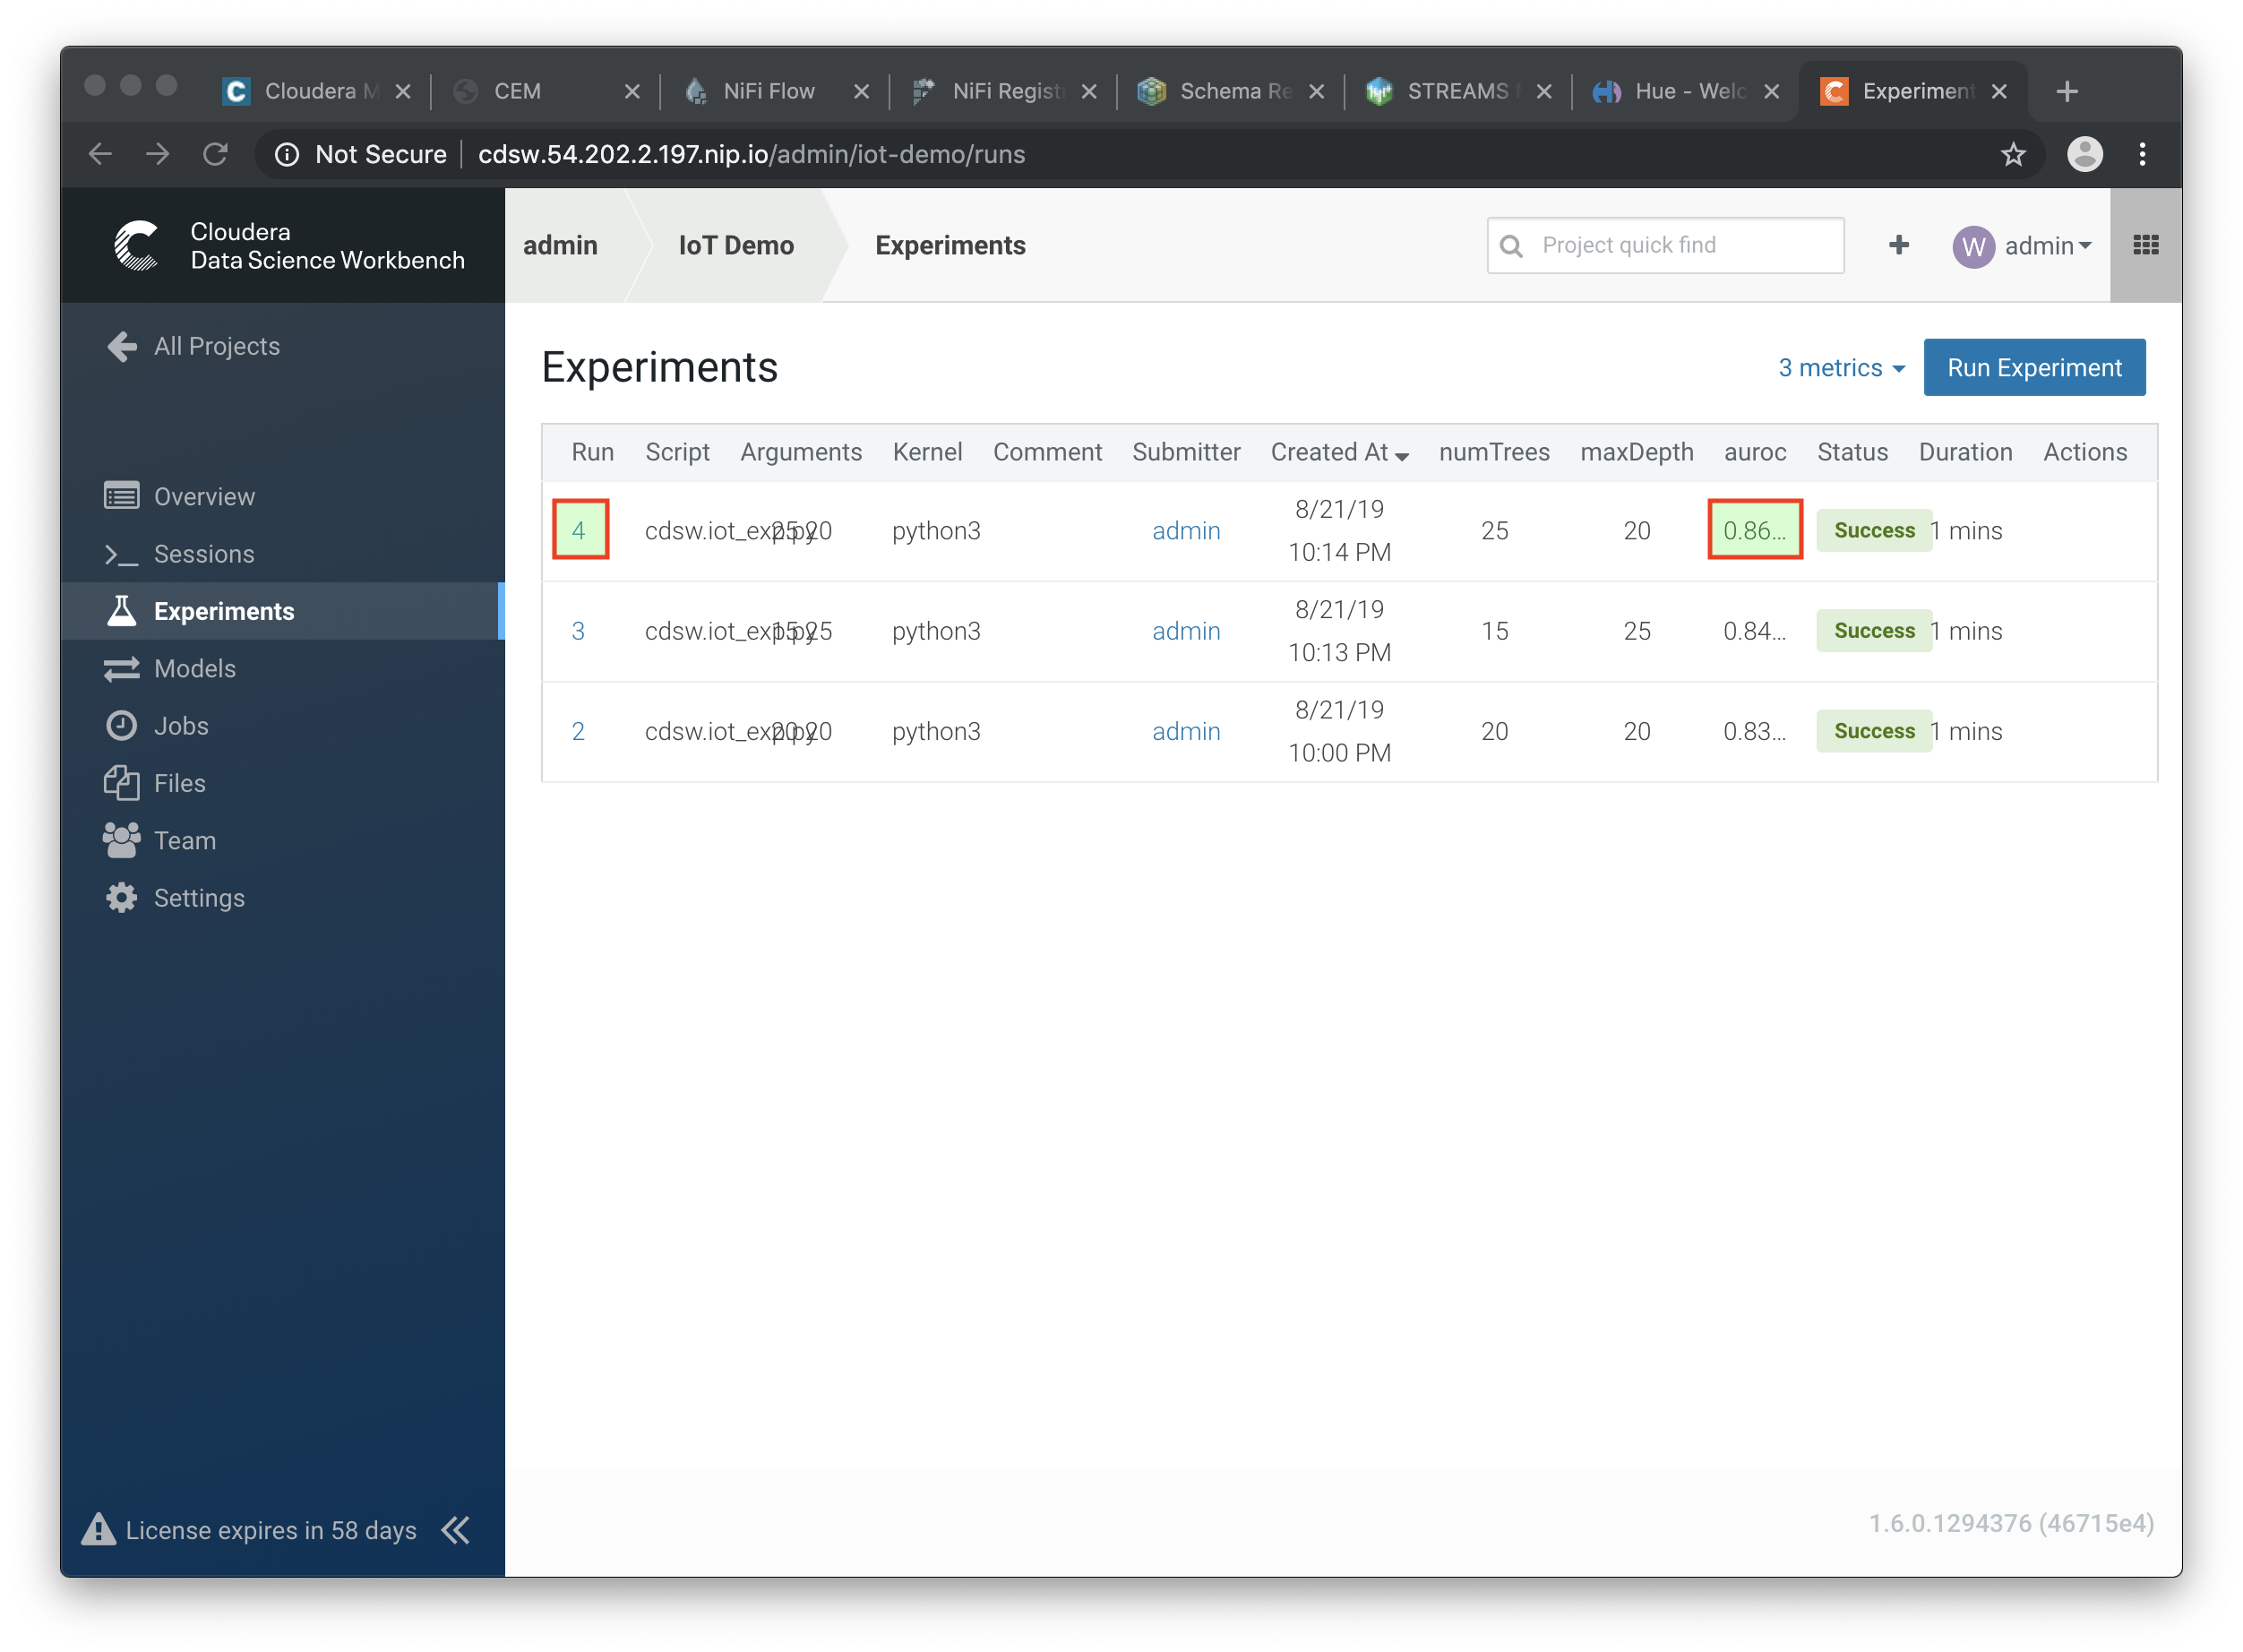
Go back to the Workbench and run the experiment 2 more times and try different values for NumTrees and NumDepth. Try the following values:
NumTrees NumDepth
15       25
25       20
-
When all runs have completed successfully, check which parameters had the best quality (best predictive value). This is represented by the highest area under the curve:
aurocmetric.
-
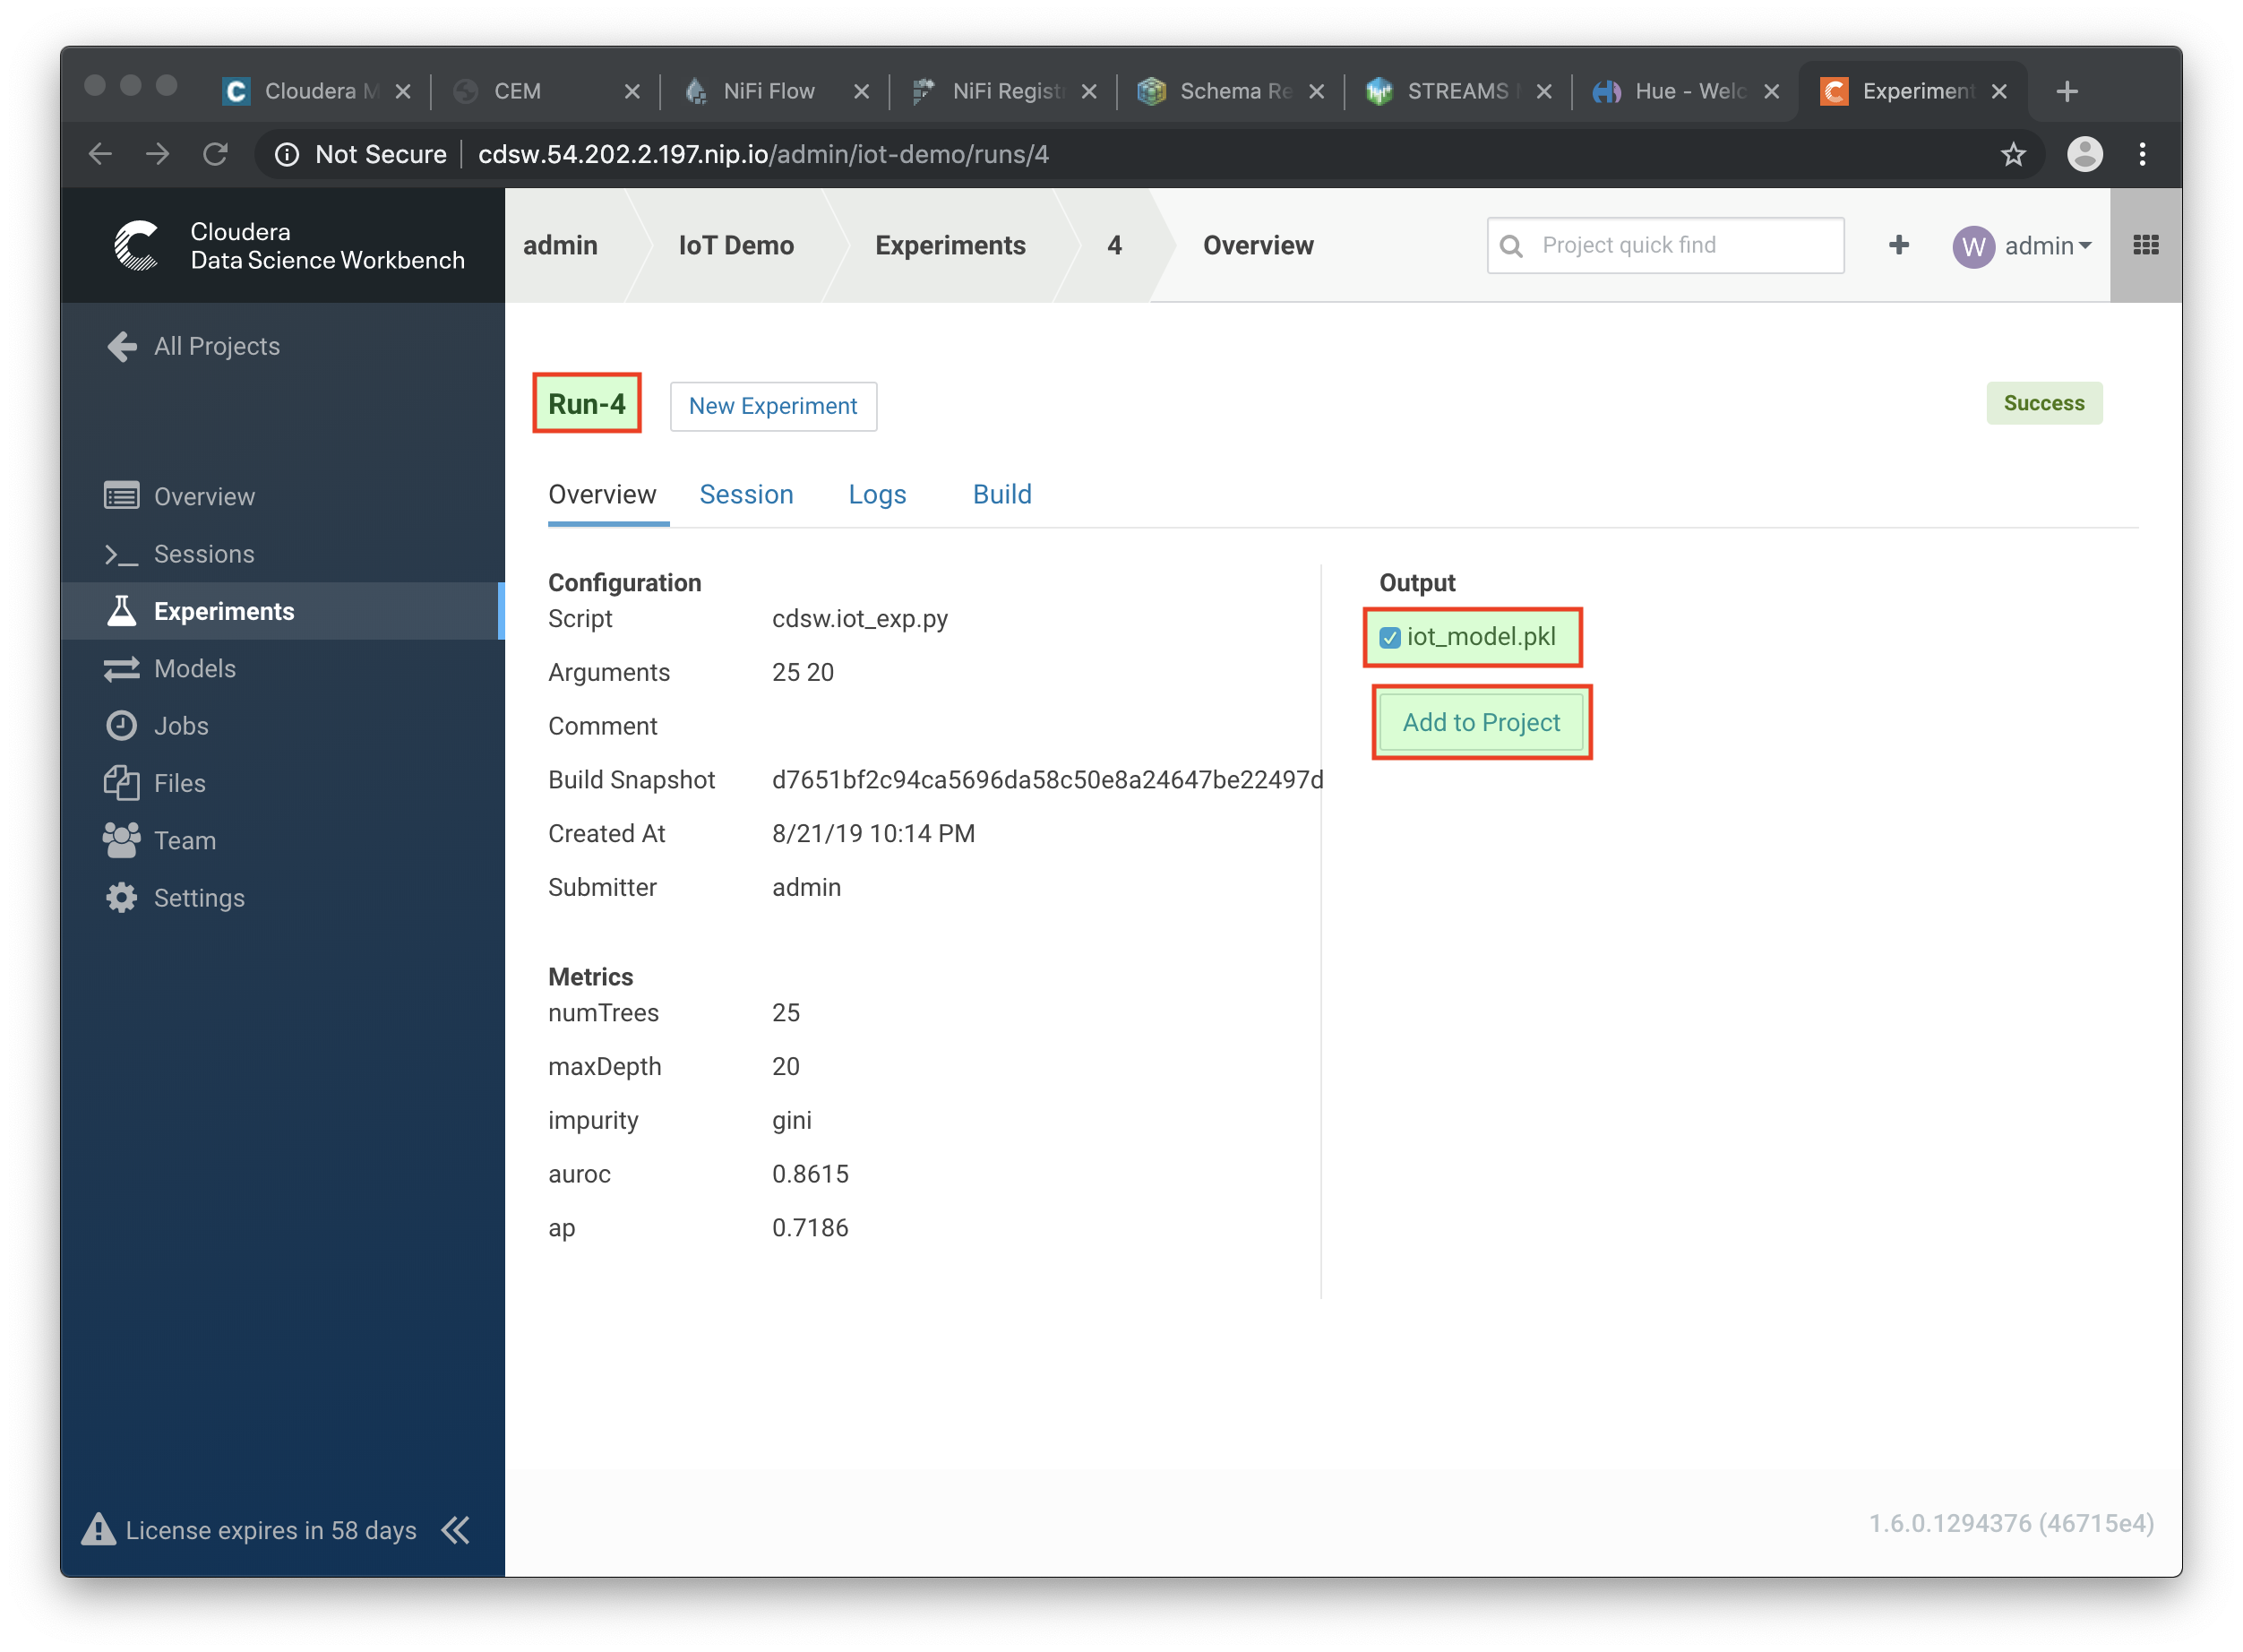
Select the run number with the best predictive value (in the example above, experiment 4).
-
In the Overview screen of the experiment, you can see that the model, in Pickle format (
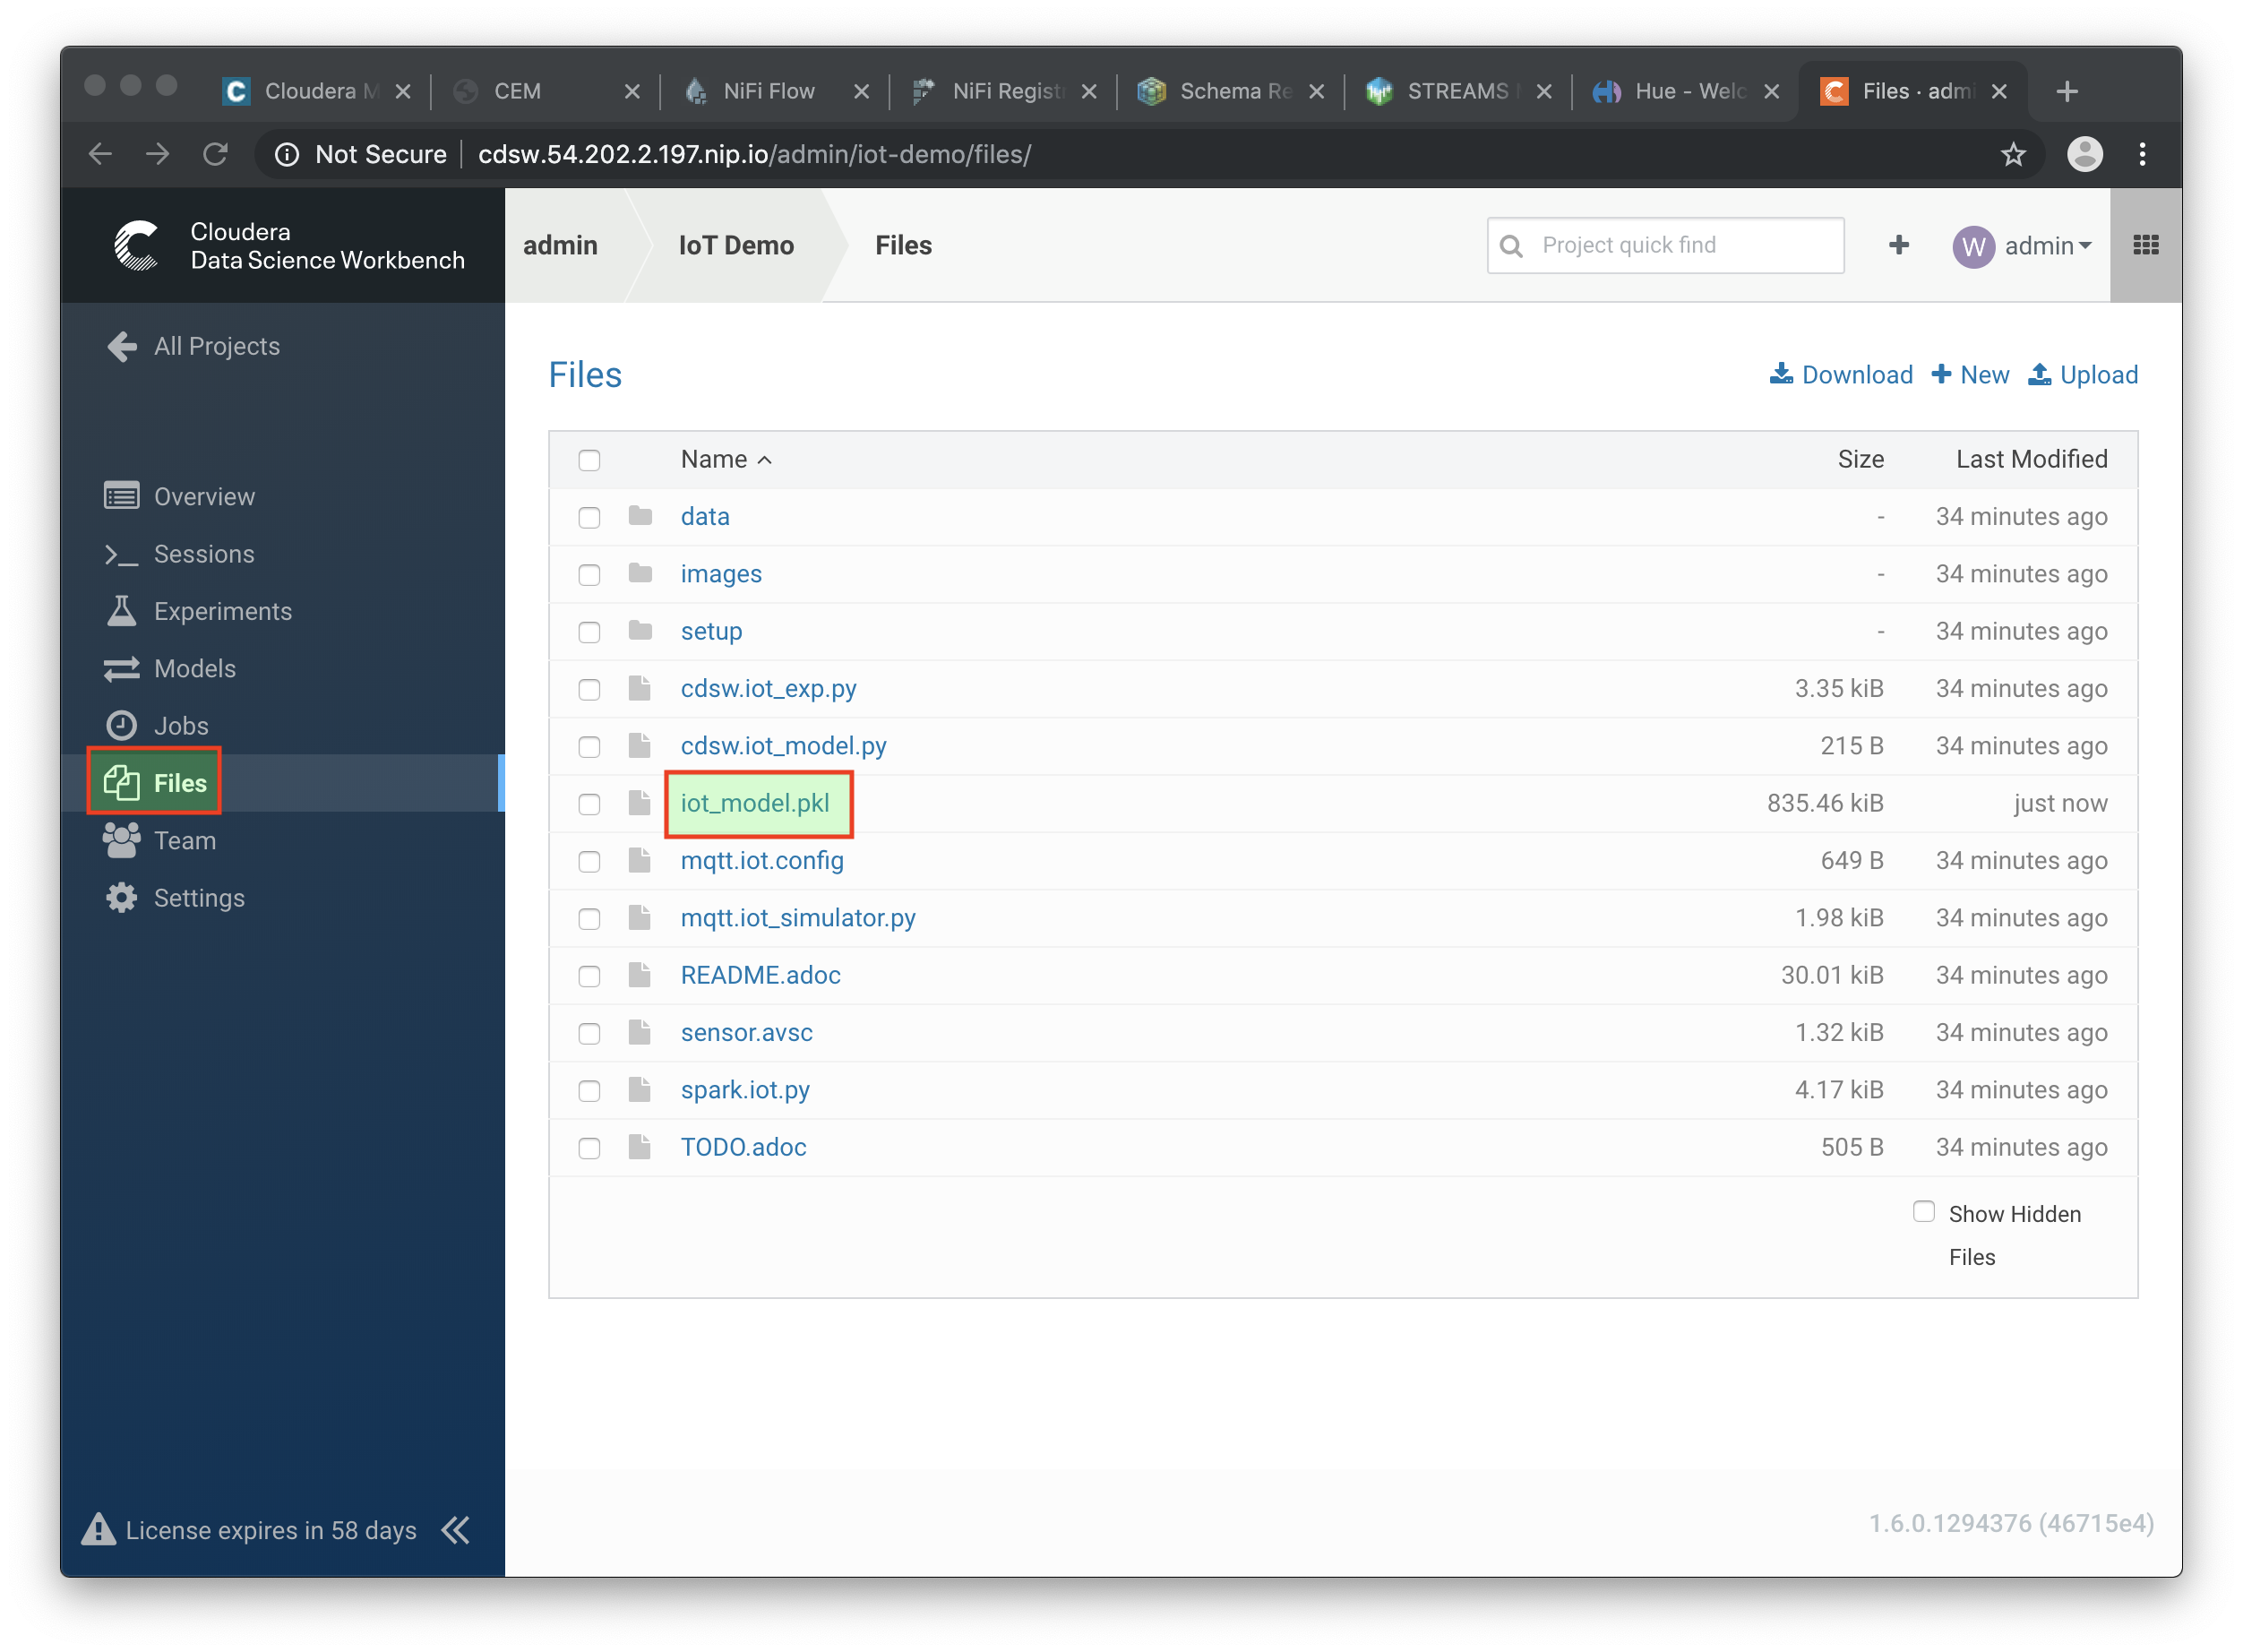
.pkl), is captured in the fileiot_model.pkl. Select this file and hit the Add to Project button. This will copy the model to your project directory.
-
Open the project you created in the previous lab and examine the file in the Workbench. This PySpark program uses the
pickle.loadmechanism to deploy models. The model is loaded from theiot_modelf.pklfile, which was saved in the previous lab from the experiment with the best predictive model.There program also contains the
predictdefinition, which is the function that calls the model, passing the features as parameters, and will return a result variable. -
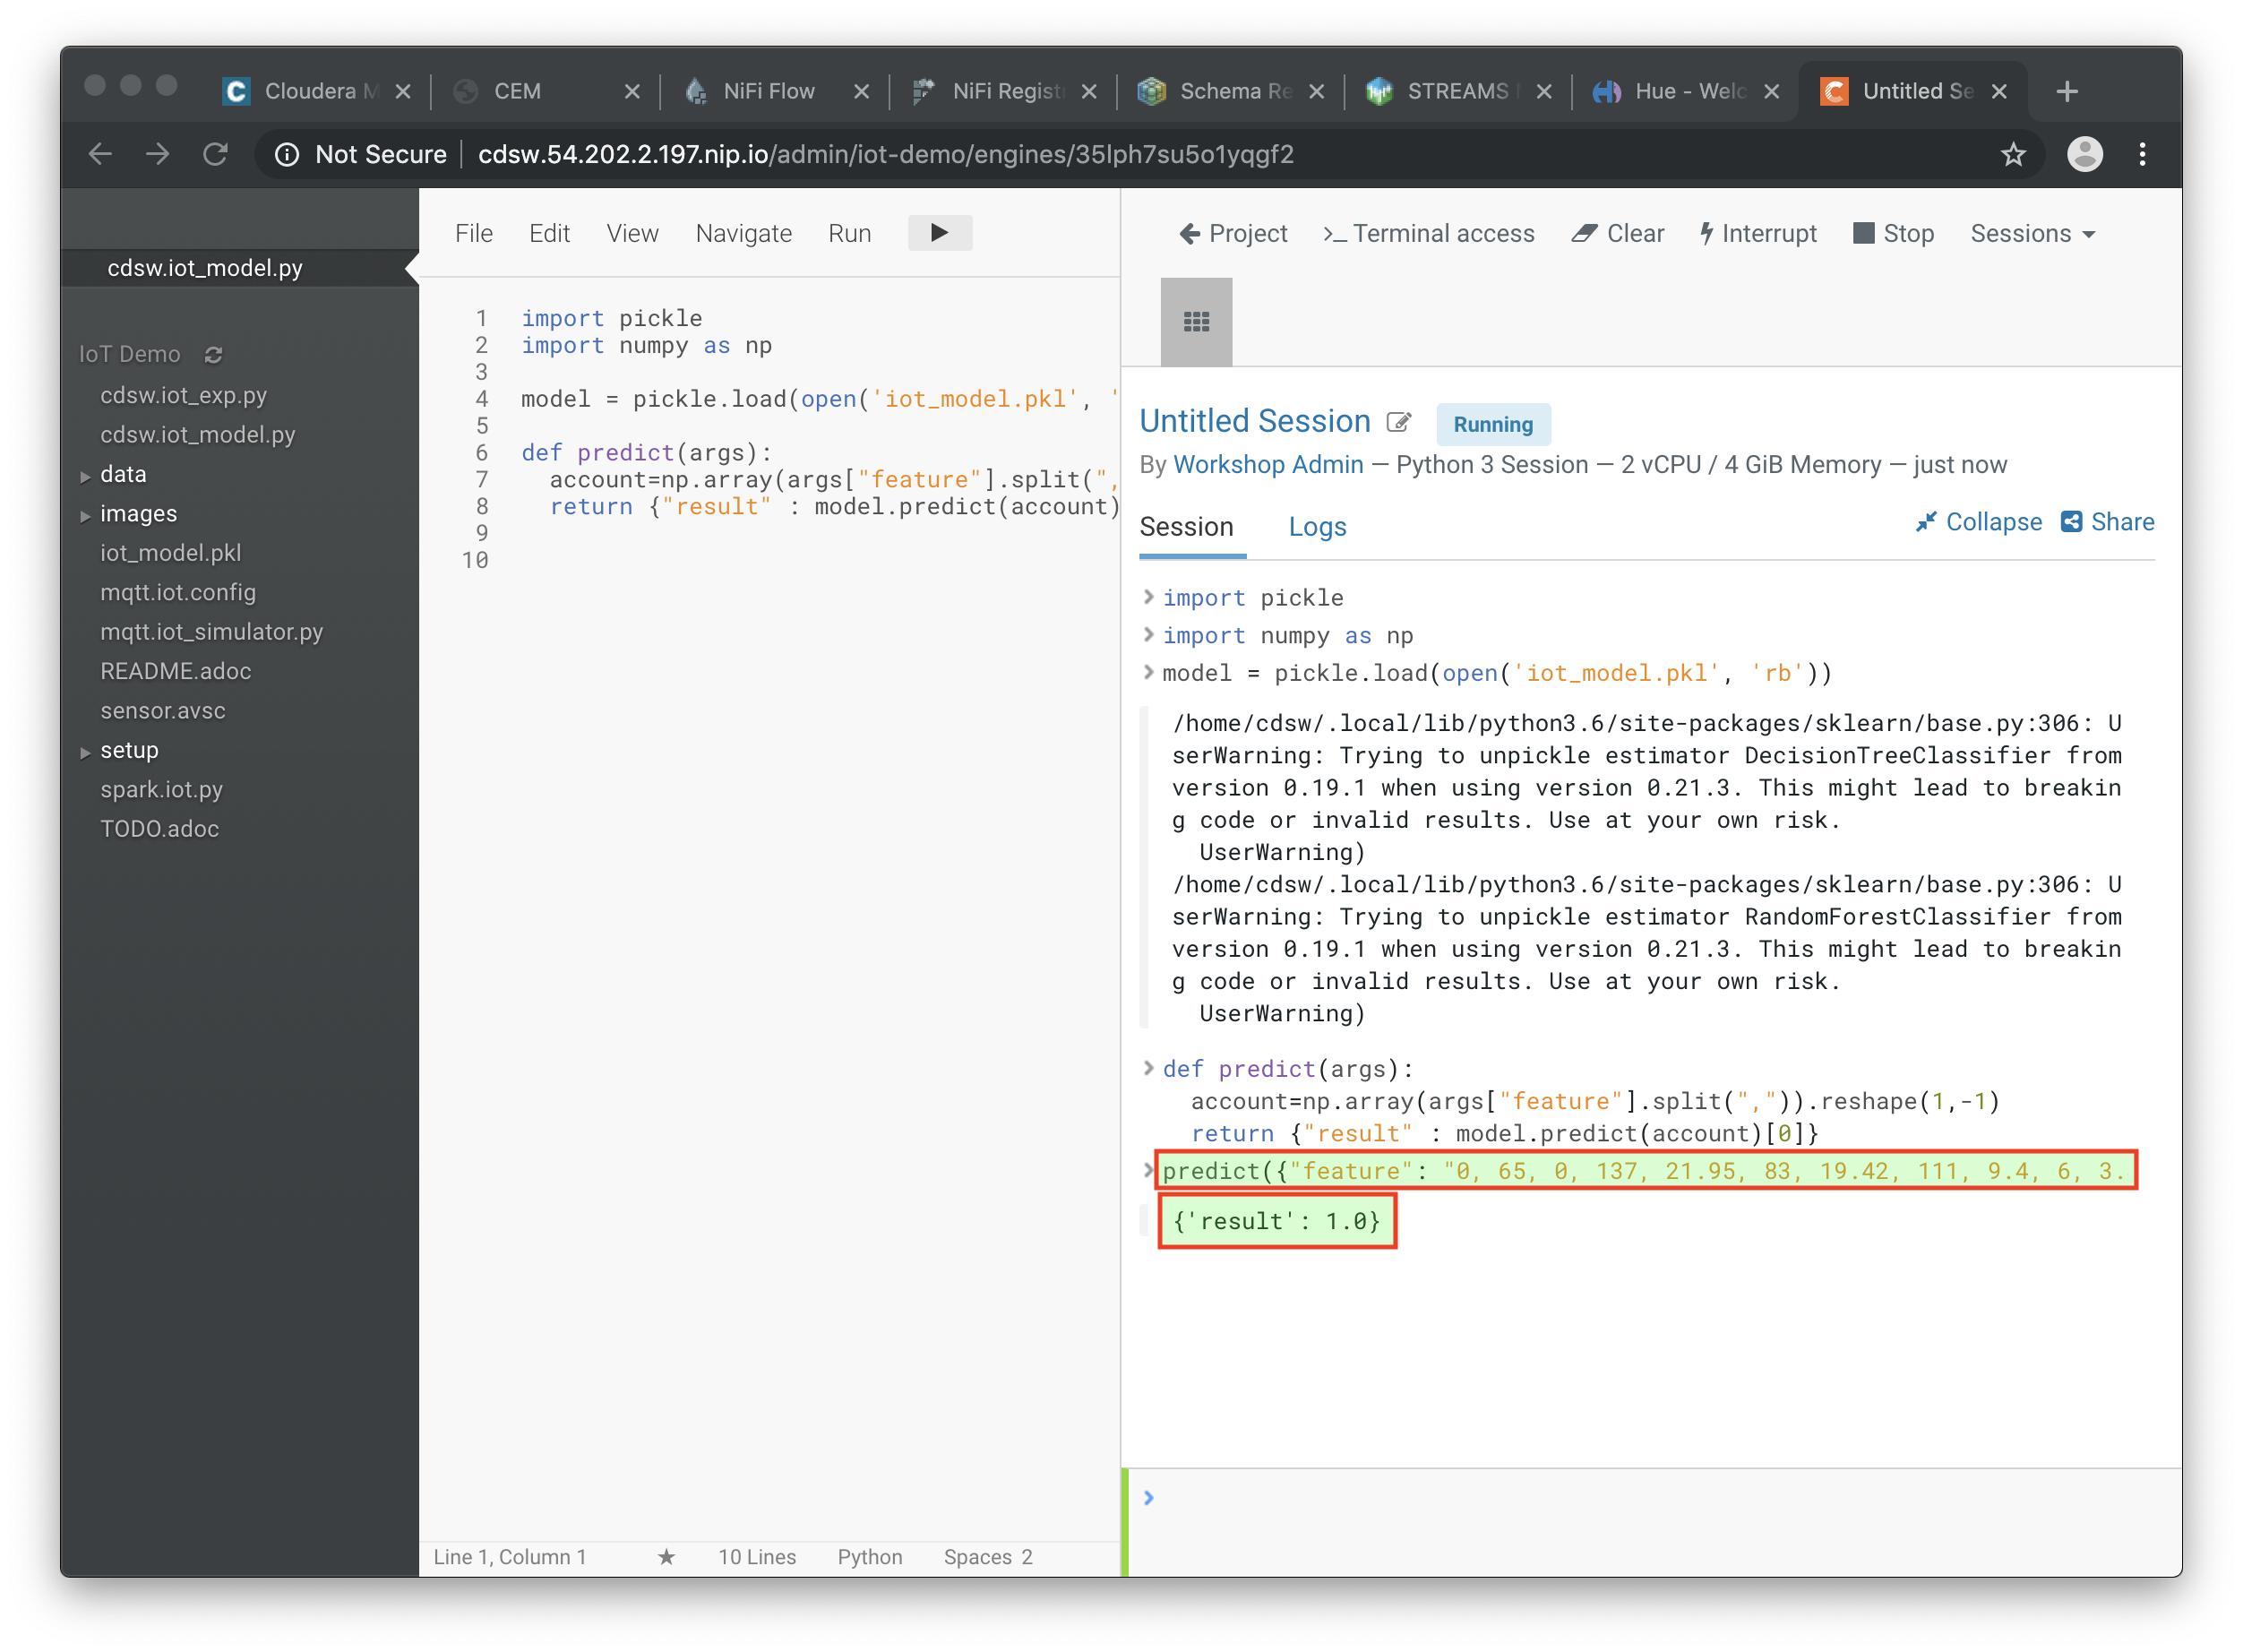
Before deploying the model, try it out in the Workbench: launch a Python3 engine and run the code in file
cdsw.iot_model.py. Then call thepredict()method from the prompt:predict({"feature": "0, 65, 0, 137, 21.95, 83, 19.42, 111, 9.4, 6, 3.43, 4"})
-
The functions returns successfully, so we know we can now deploy the model. You can now stop the engine.
-
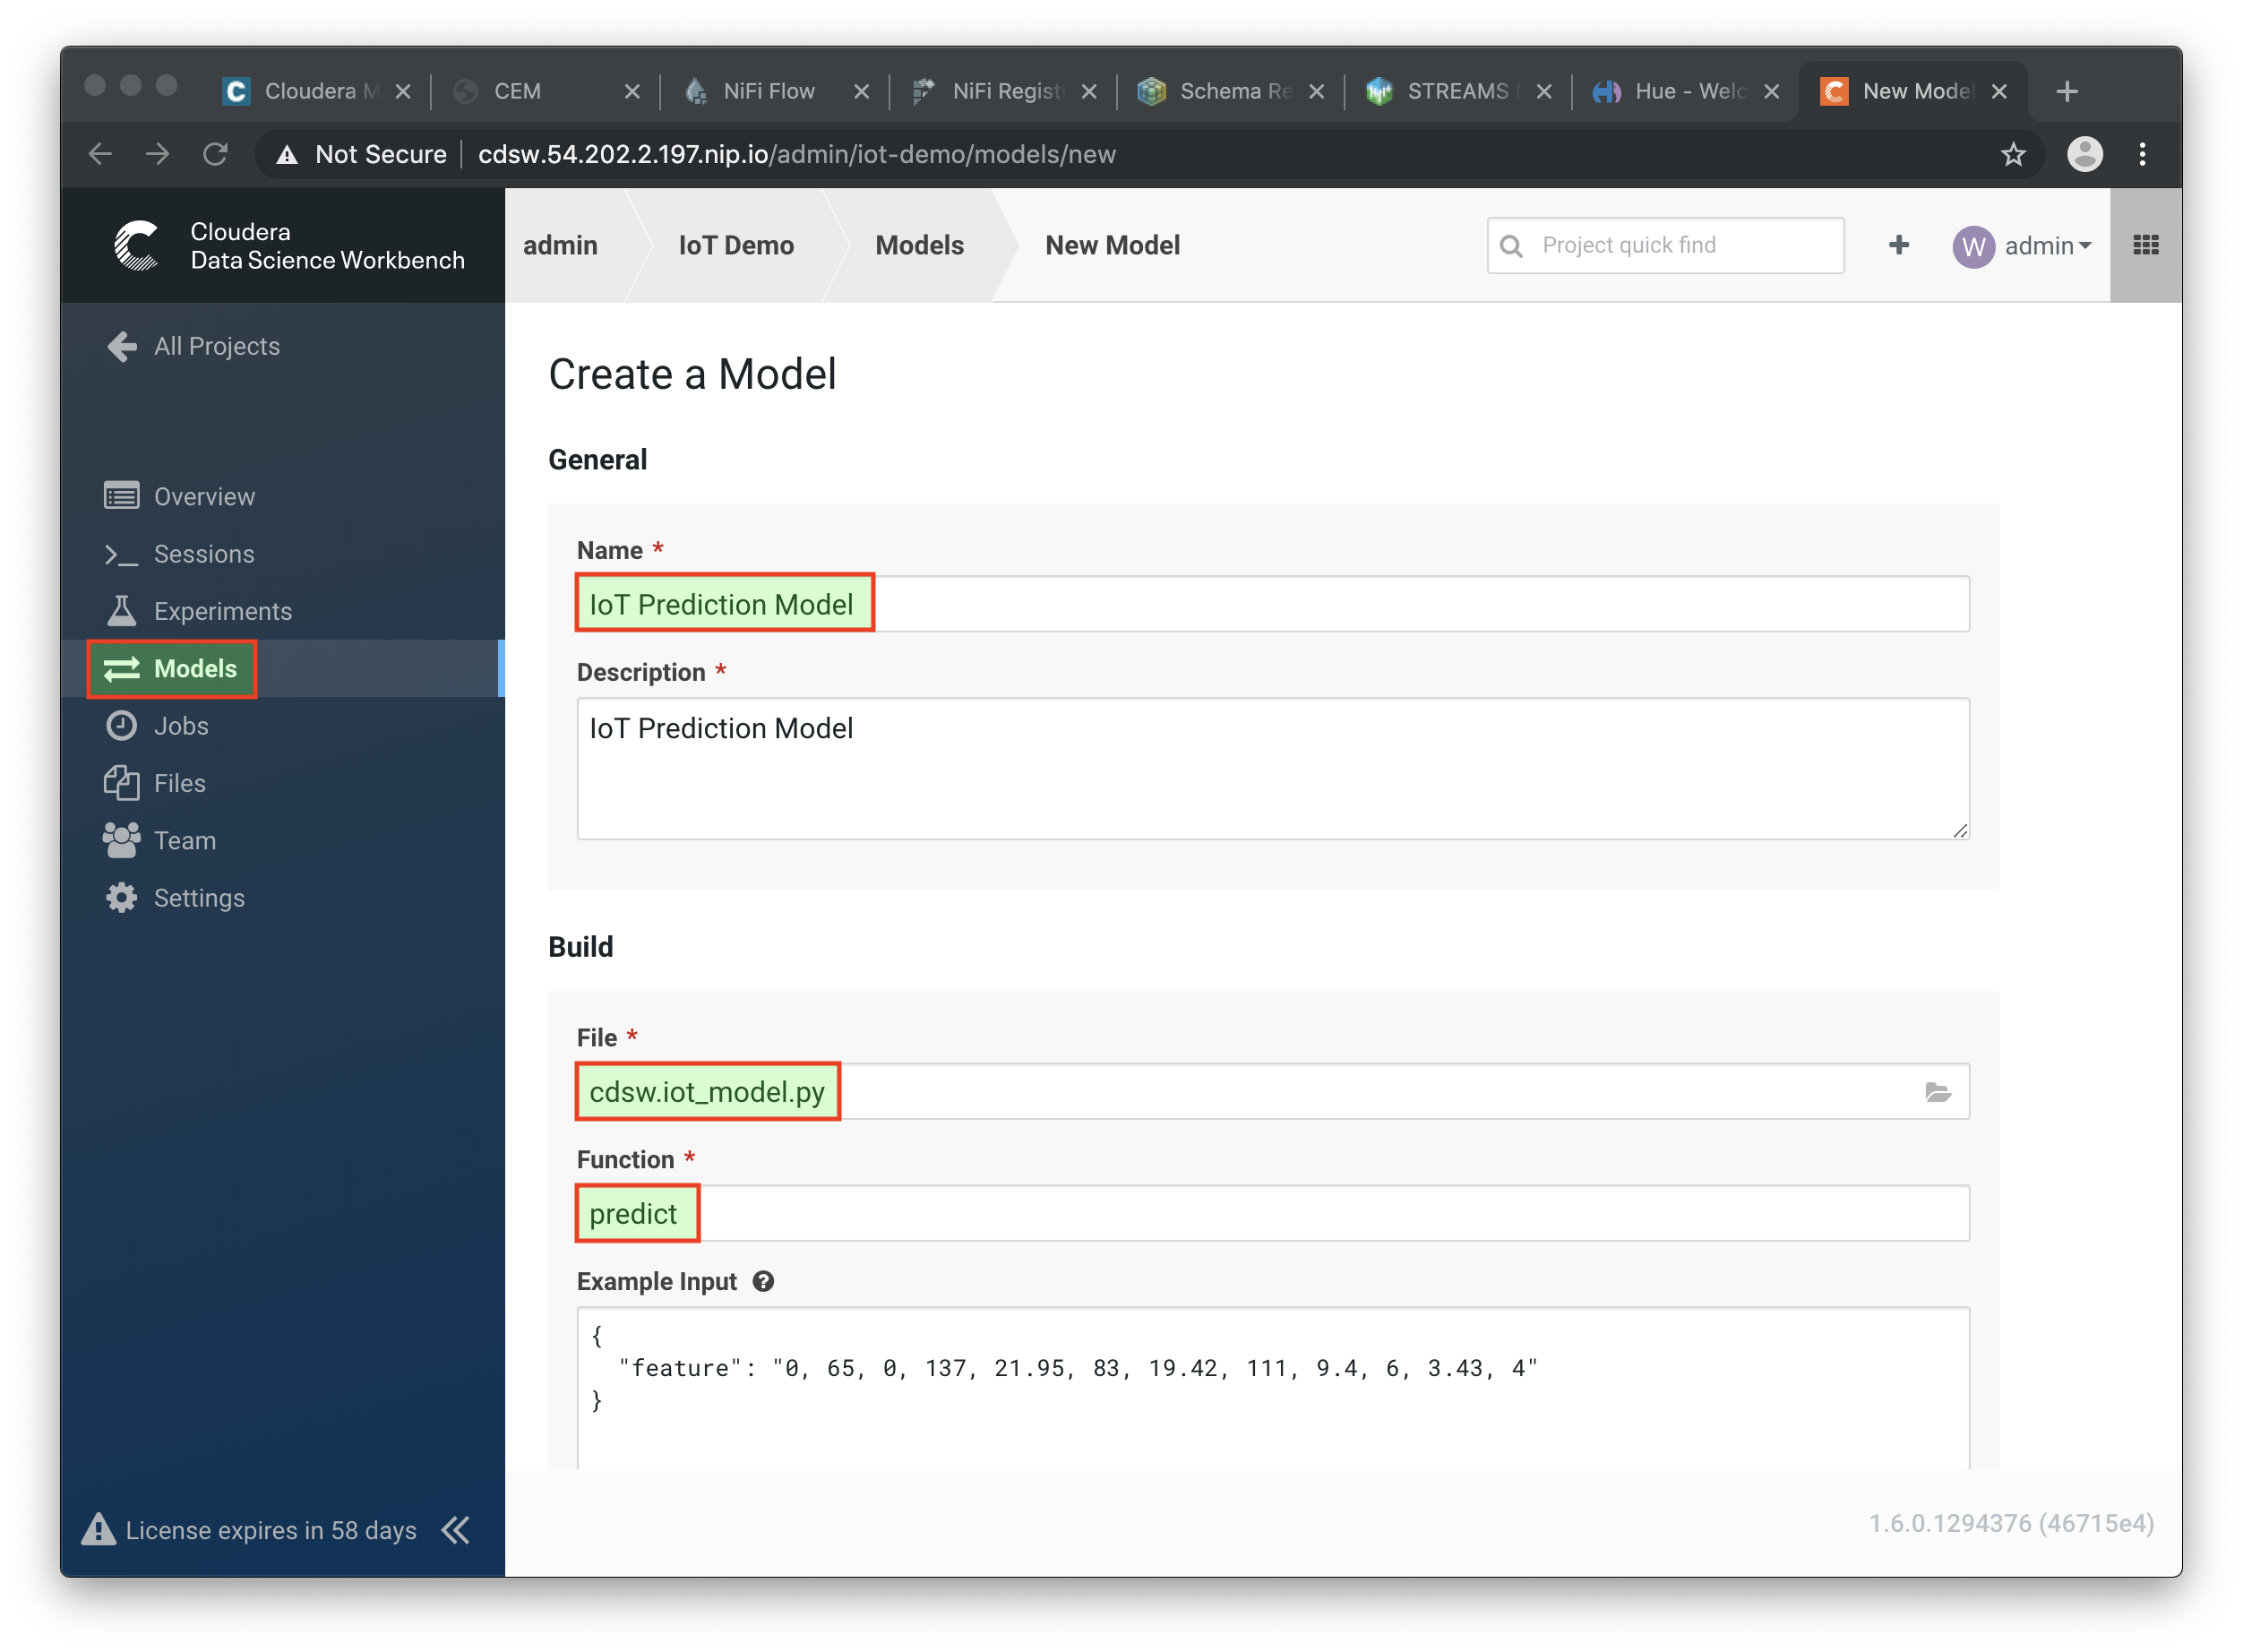
From the main page of your project, select the Models button. Select New Model and specify the following configuration:
Name:          IoT Prediction Model
Description:   IoT Prediction Model
File:          cdsw.iot_model.py
Function:      predict
Example Input: {"feature": "0, 65, 0, 137, 21.95, 83, 19.42, 111, 9.4, 6, 3.43, 4"}
Kernel:        Python 3
Engine:        2 vCPU / 4 GB Memory
Replicas:      1
-
After all parameters are set, click on the Deploy Model button. Wait till the model is deployed. This can take several minutes.
-
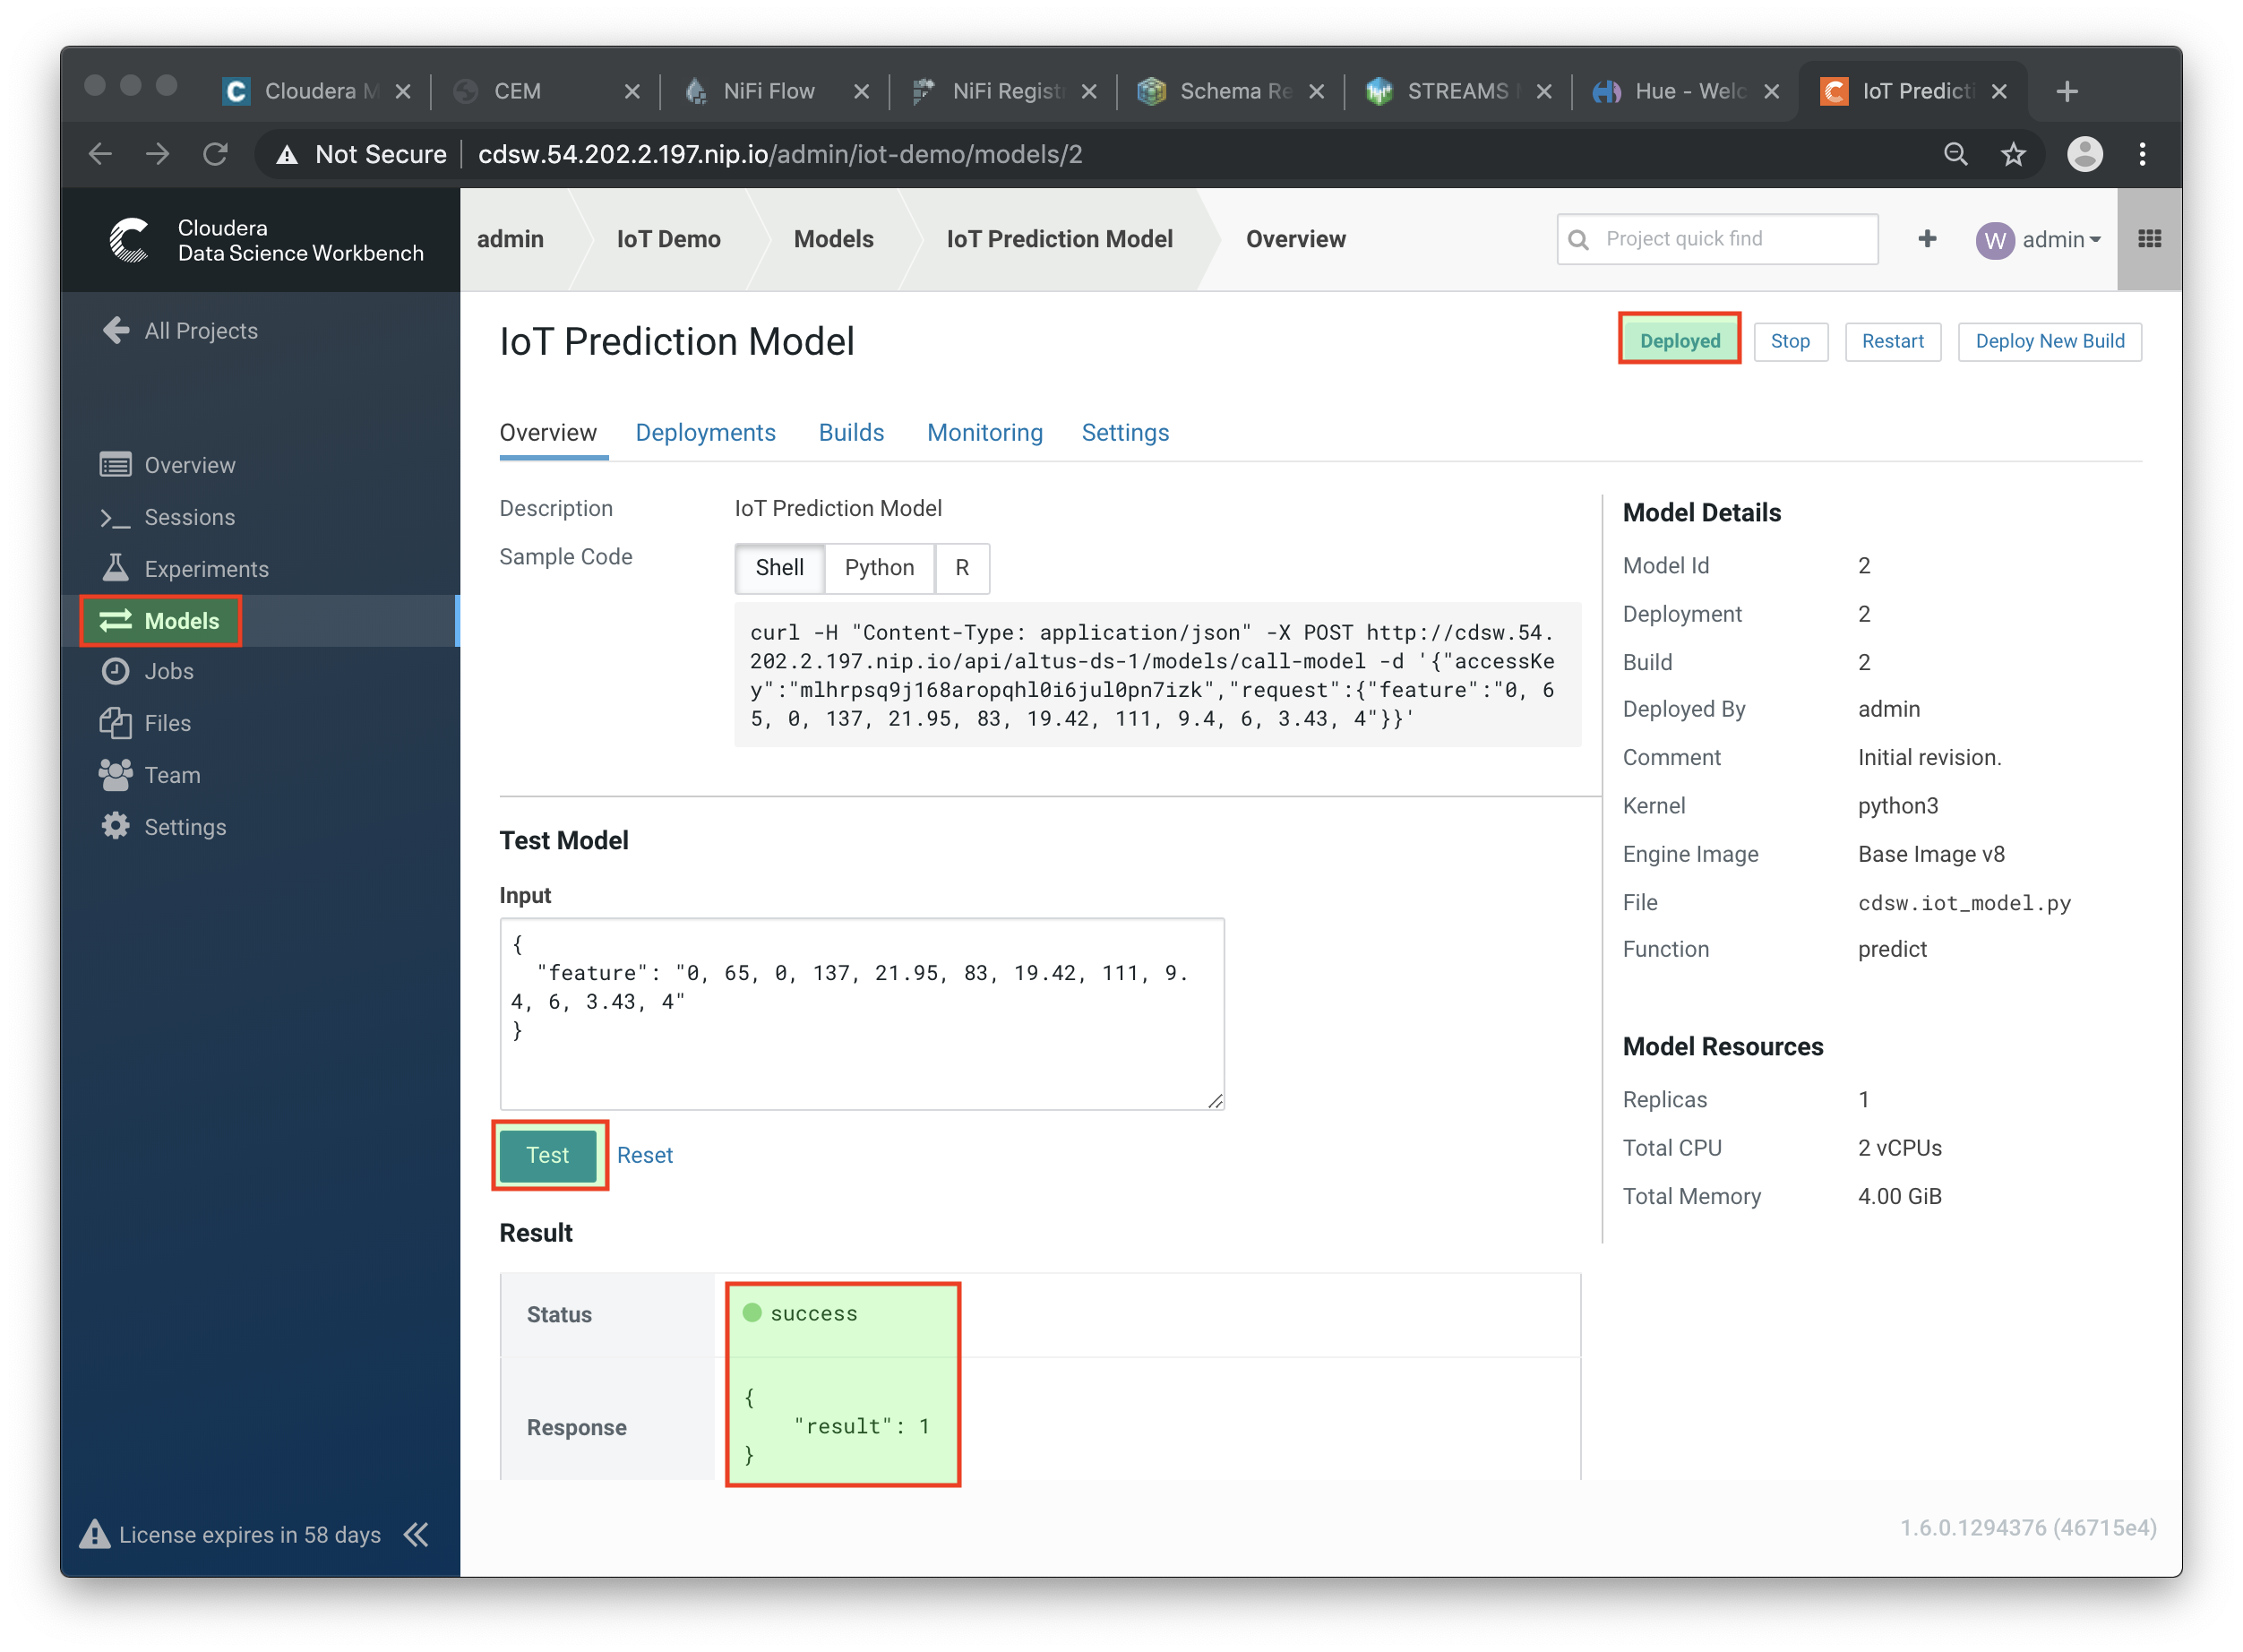
When your model status change to
Deployed, click on the model name link to go to the Model’s Overview page. From the that page, click on the Test button to check if the model is working. -
The green circle with the
successstatus indicates that our REST call to the model is working. The1in the response{"result": 1}, means that the machine from where these temperature readings were collected is unlikely to experience a failure. -
Now, lets change the input parameters and call the predict function again. Put the following values in the Input field:
{ "feature": "0, 95, 0, 88, 26.62, 75, 21.05, 115, 8.65, 5, 3.32, 3" } -
With these input parameters, the model returns
0, which means that the machine is likely to break.
-
This workshop was based on the following work by Fabio Ghirardello:
-
Delete the agent manifest manually using the EFM API:
-
Verify each class has the same agent manifest ID:
http://hostname:10088/efm/api/agent-classes [{"name":"iot1","agentManifests":["agent-manifest-id"]},{"name":"iot4","agentManifests":["agent-manifest-id"]}] -
Confirm the manifest doesn’t have the NAR you installed
http://hostname:10088/efm/api/agent-manifests?class=iot4 [{"identifier":"agent-manifest-id","agentType":"minifi-java","version":"1","buildInfo":{"timestamp":1556628651811,"compiler":"JDK 8"},"bundles":[{"group":"default","artifact":"system","version":"unversioned","componentManifest":{"controllerServices":[],"processors": -
Call the API endpoint:
http://hostname:10088/efm/swagger/ -
Hit the
DELETE - Delete the agent manifest specified by idbutton, and in the id field, enteragent-manifest-id
