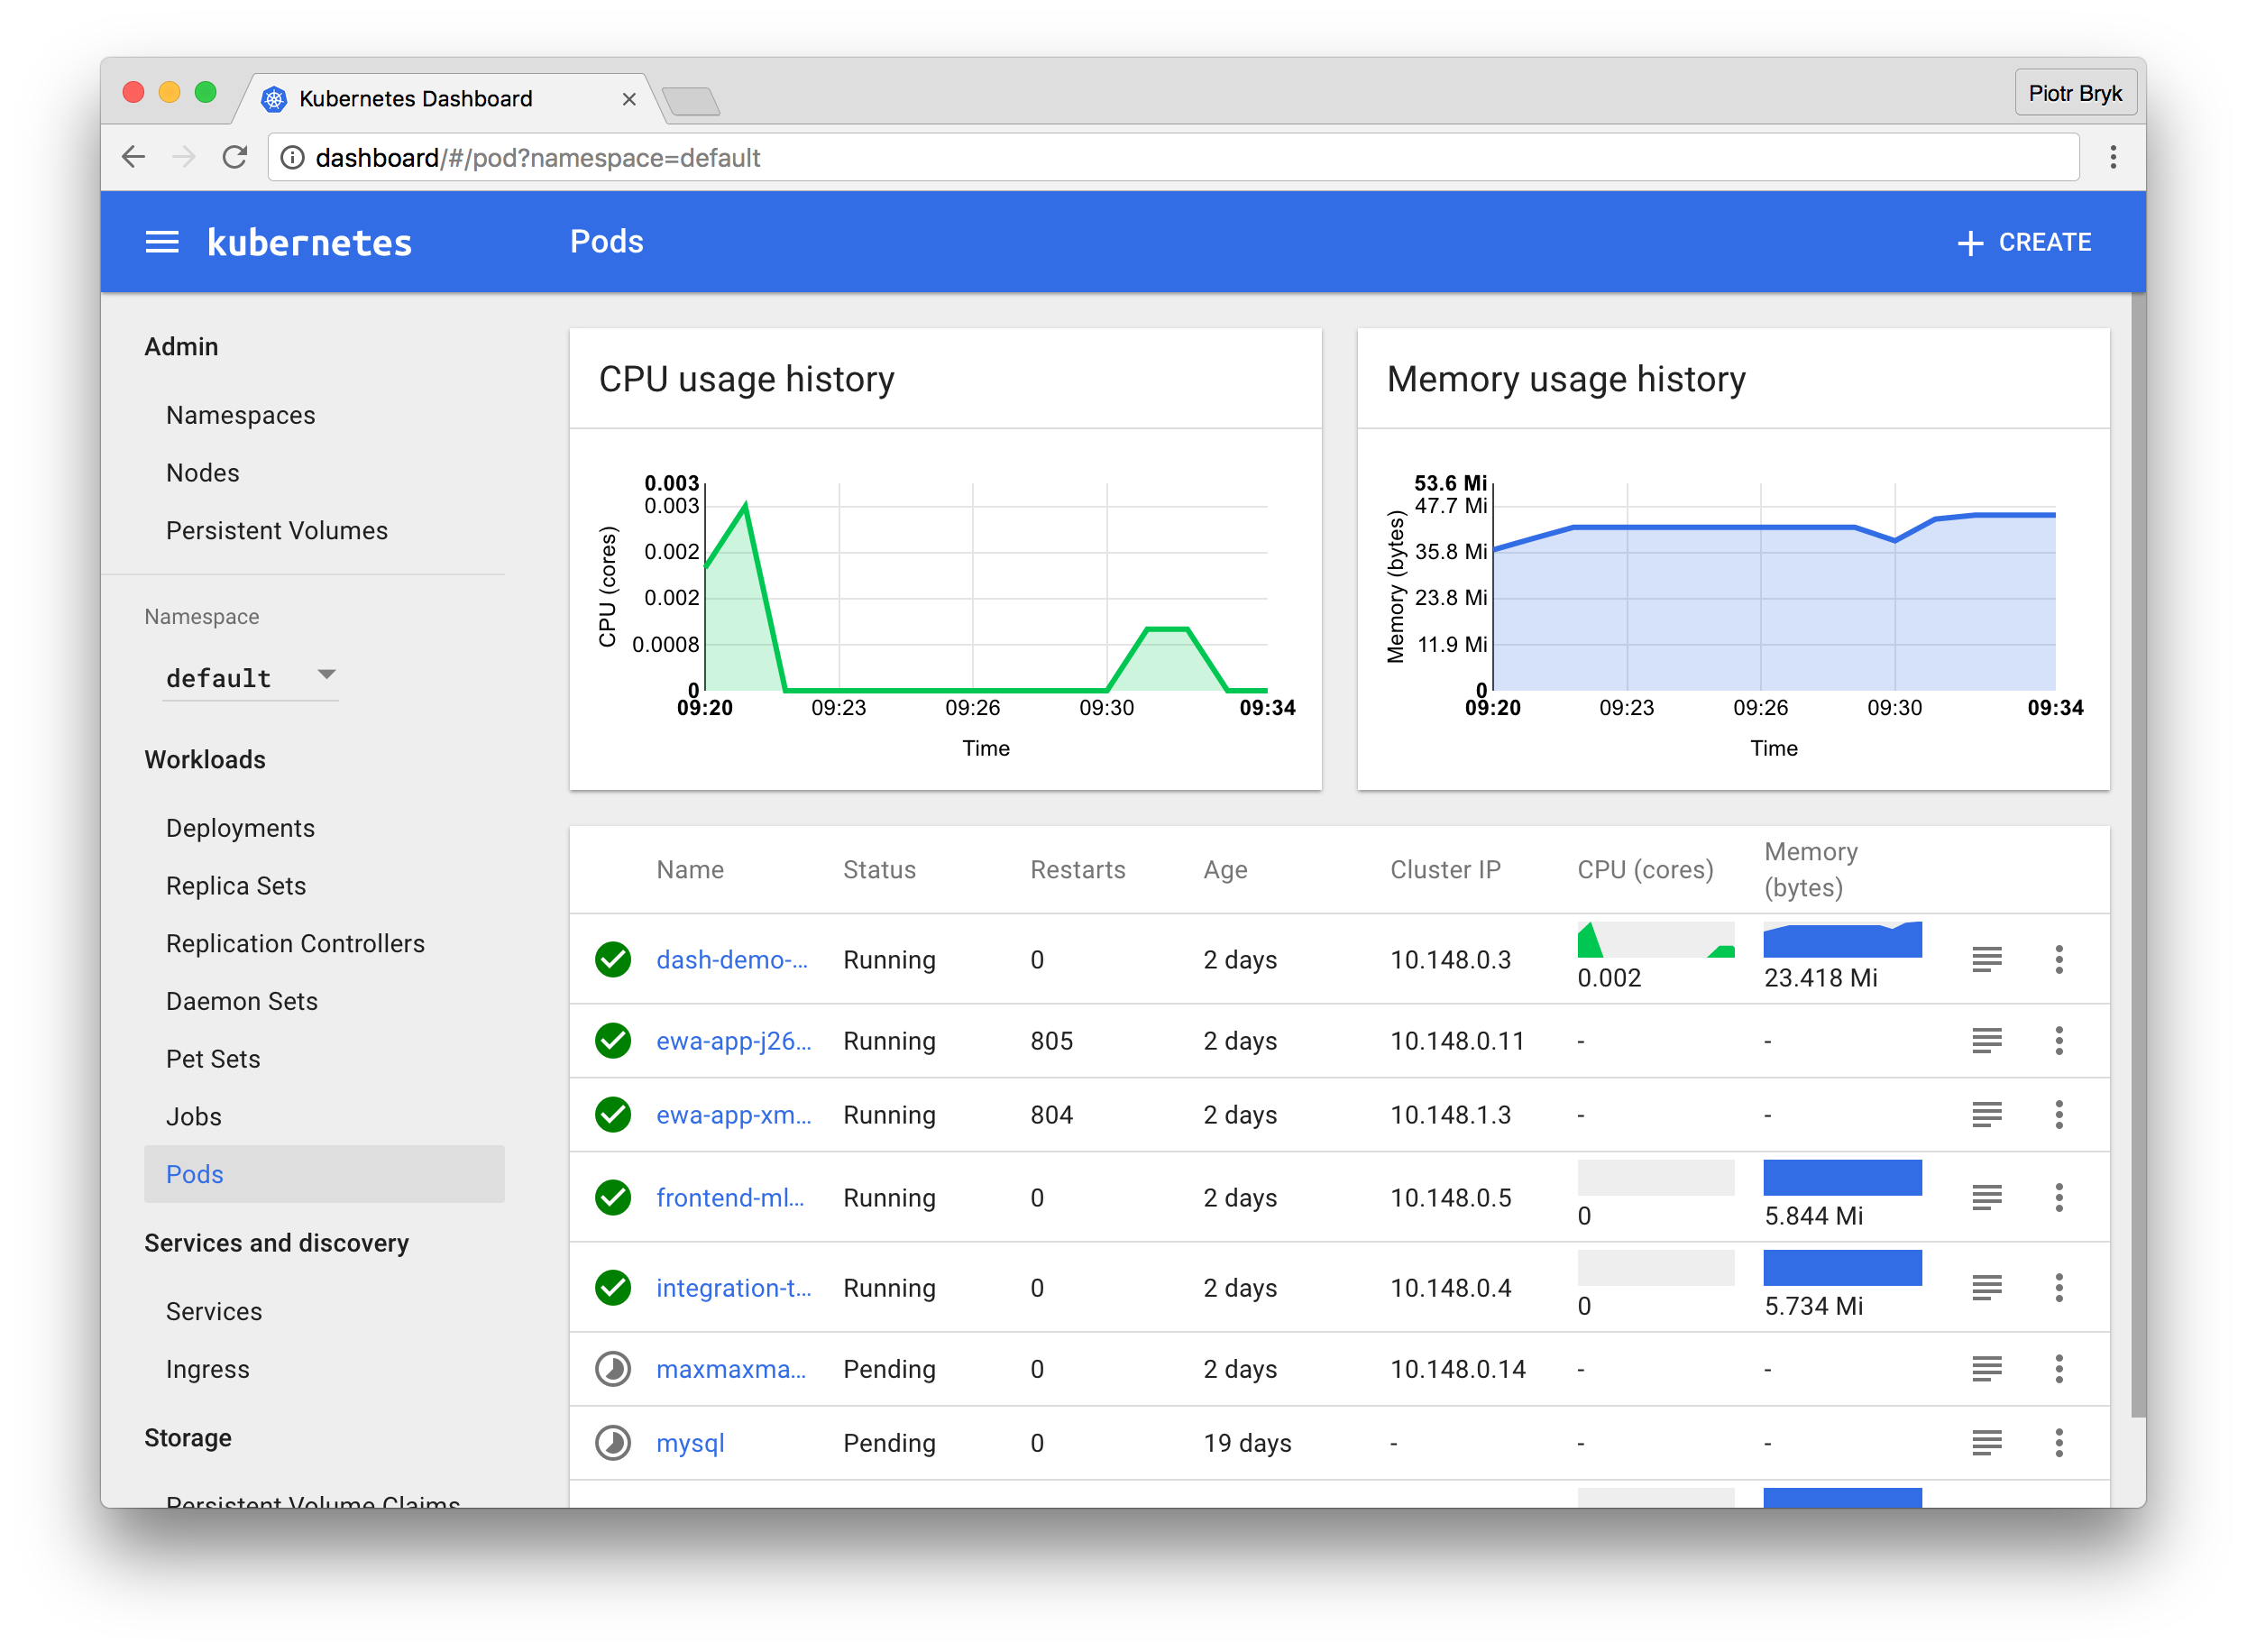
Kubernetes Dashboard is a general purpose, web-based UI for Kubernetes clusters. It allows users to manage applications running in the cluster and troubleshoot them, as well as manage the cluster itself.
It is likely that the Dashboard is already installed on your cluster. Check with the following command:
$ kubectl get pods --all-namespaces | grep dashboardIf it is missing, you can install the latest stable release by running the following command:
$ kubectl create -f https://raw.githubusercontent.com/kubernetes/dashboard/master/src/deploy/kubernetes-dashboard.yamlYou can also install unstable HEAD builds with the newest features that the team works on by following the development guide.
Note that for the metrics and graphs to be available you need to have Heapster running in your cluster.
The easiest way to access Dashboard is to use kubectl. Run the following command in your desktop environment:
$ kubectl proxykubectl will handle authentication with apiserver and make Dashboard available at http://localhost:8001/ui
The UI can only be accessed from the machine where the command is executed. See kubectl proxy --help for more options.
You may access the UI directly via the apiserver proxy. Open a browser and navigate to https://<kubernetes-master>/ui.
Please note, this works only if the apiserver is set up to allow authentication with username and password. This is not currently the case with the setup tool kubeadm. See documentation if you want to configure it manually.
If the username and password is configured but unknown to you, then use kubectl config view to find it.
-
User Guide: Entry-level overview
-
Developer Guide: For anyone interested in contributing
-
Design Guide: For anyone interested in contributing design (less technical)
-
Troubleshooting Guide: Common issues encountered while setting up Dashboard
The work done has been licensed under Apache License 2.0. The license file can be found here. You can find out more about the license at:

