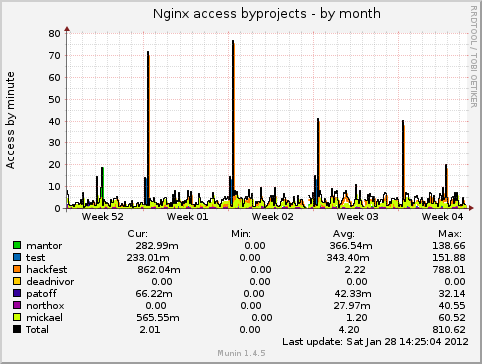
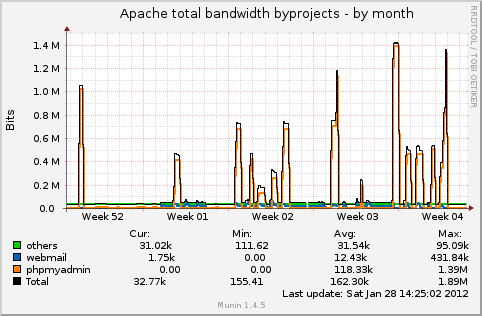
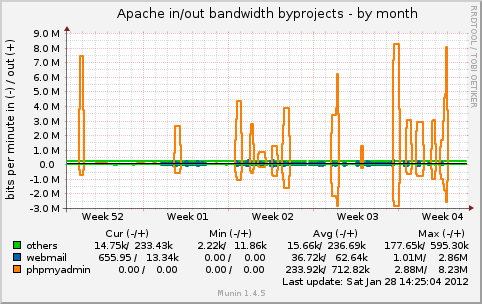
Those plugins are used to monitor different projects or vhost (i.e. either different log files or using regular expression as filters) on the same web server.
Count the number of hits per projects/vhost.
Count the total bandwidth used by each projects/vhost. [Logtail] (https://www.fourmilab.ch/webtools/logtail/) is required.
Counts the in/out bandwidth used by each projects/vhost. [Logtail] (https://www.fourmilab.ch/webtools/logtail/) is required.
The setup is pretty straight forward. First you need to configure the plugin:
Define the file which will be used by logtail to identify it's position in the log and the path to logtail:
  $statepath = '/usr/local/var/munin/plugin-state'; # directory where logtail will save the state
  $logtail = '/usr/local/bin/logtail';
Multiple logs can be used for the same project/vhost and a regular expression (regex) can be used as a filter:
  my %logs = (
    'prod' => [
                {'path' => '/home/prod/log/access.log'}
              ],
     'dev' => [
                {'path' => '/var/log/httpd/ssl-dev-access.log'},
                {'path' => '/home/dev/log/access.log'}
              ],
    'test' => [
                {'path' => '/var/log/access.log', 'regex' => '"[A-Z]+ /test/'},
                {'path' => '/home/test/log/access.log'}
              ],
  );
In the previous example the prod project graph will be using everything in /home/prod/log/access.log. The test project will be using eveything in /home/test/log/access.log and stuff that match '"[A-Z] /test/' in /var/log/httpd/access.log (e.g. "GET /test/).
Then link the file just as any other plugins.
ln -s /usr/local/sbin/<plugin> /usr/local/etc/munin/plugins/<plugin>


