Pynterative is a python library aimed to create interative visualizations provided by several HTML5 JavaScript libraries like vis.js, d3.js and many more.
Its main feature is the real time communication python<->webbrowser via websockets, that allows us realtime interaction from python to the browser and from the browser to python. It means that the code you write in python affects the visualization in real time and mouse/keyboard events happening in the web browser can be connected to python callbacks creating a bidirectional communication.
We wanted to create a very simple API that, although reduces flexibility, it is extremely easy to learn and start creating web GUI's.
Pynteractive IS NOT a framework to develop:
- Web applications: the graphic interfaces are supposed to be local. That is the main idea, not dealing with web at all, being able to use cool JS frameworks without messing with any web technology.
- Production software: it is intended to help developers/data scientists plotting data very quickly. You've got data, you need to plot it, you need to play with it, that is what pynteractive is aimed for, do not expect more.
Pynteractive is in constant development, all feedback/suggestions/bugreports are very wellcome. It was motivated by the need to use HTML5 plots in biomedical research, (bioinformatics specifically), however different charts and plots are being introduced as they are requested/needed.
- Networks: graphs and digraphs provided by the vis.js framework
- Trees: Using different engines (d3.js, vis.js)
- Maps: provided by leaflet (openstreet maps)
- Phylogenetic trees + Annotation
- Charts: using NVD3.js
## TODO
- More phylogenetic tree layouts
- Integrating Circos and making it interactive
- Extra plots extracted from D3.js
- Interactive scatter plots with point selection
It requires an HTML5 browser and currently it has been tested in Google Chome, Safari and Mozilla Firefox.
There are two ways of installing pynteractive:
- Cloning the project
$ git clone https://github.com/coelias/Pynteractive.git
Cloning into 'Pynteractive'...
remote: Counting objects: 658, done.
remote: Compressing objects: 100% (98/98), done.
remote: Total 658 (delta 50), reused 0 (delta 0), pack-reused 560
Receiving objects: 100% (658/658), 136.28 KiB | 0 bytes/s, done.
Resolving deltas: 100% (381/381), done.
Checking connectivity... done.

$ cd Pynteractive
$ python setup.py install ### (as root)- Via Python package index (pip)
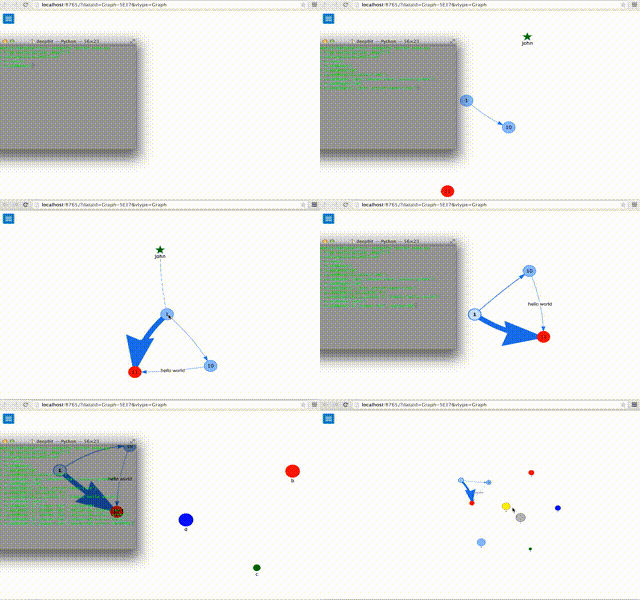
$ pip install pynteractive####Graph example (click to watch video)
from pynteractive import *
a=Graph(directed=True)
a.view()

# adding nodes
a.addNode()
a.addNode(10)
a.addNode(11,color='red')
a.addNode('john',shape='star',color='green')

# adding edges
a.addEdge(1,10)
a.addEdge(1,'john',style='dash-line')
a.addEdge(1,11,width='4')
a.addEdge(10,11,width='2',label='hello world')
a.delNode('john')

# creating a circular graph
a.addNode('a',shape='dot',radius=30)
a.addNode('b',shape='dot',radius=20,color='red')
a.addNode('c',shape='dot',radius=10,color='green')
a.addNode('d',shape='dot',radius=20,color='blue')
a.addNode('e',shape='dot',radius=30,color='#FFFF00')
a.addNode('f',shape='dot',radius=35,color='#bbb')
a.addEdge('a','b')
a.addEdge('b','c',style='arrow-center')
a.addEdge('c','d')
a.addEdge('d','e',style='arrow-center')
a.addEdge('e','f')
a.addEdge('f','a',style='arrow-center')

# cleaning the view
a.clear()

# Generating a randon graph (40 nodes, 50 edges
a.random(40,50)

# Logging into the log area
a.log('Hello world')
a.log('<h1>header</h1>')
a.log('<code>code</code>')

# Defining callbacks to perform actions after events in the GUI
def Multiply_by2(node):
    a.log(str( int(node)*2)+"<br>")
a.setDoubleClick(Multiply_by2)

def sumall(nodes):
    a.log(str( sum([int(i) for i in nodes]))+"<br>")
a.addAction('Add node values',sumall)
####Chart example (click to watch video)
from pynteractive import *
b=Chart()
b.view()
b.addSeries('Squirrels killed by humans',
    [1,2,3,4,5,6,7,8,9,10,11,12,13,14,15,16],
    [200,240,300,313,317,380,360,320,503,460,510,600,550,500,460,490])
b.addSeries('People killed by squirrels',
    [1,2,3,4,5,6,7,8,9,10,11,12,13,14,15,16],
    [1,20,40,60,100,110,105,150,100,80,150,180,182,210,300,491])
b.addSeries('Sharks killed by squirrels',
    [1,2,3,4,5,6,7,8,9,10,11,12,13,14,15,16],
[10,20,25,40,12,33,22,47,90,70,80,46,30,6,18,25])from pynteractive import *
m=Map()
m.view()
m.addNode("ID1",place="london")
m.addNode("ID2",place="ox3 8pp")
m.addEdge("ID1","ID2")
m.addNode("ID3",place="08030",country="es")
m.addNode('ID4',place='paris',radius=30,color='blue')
m.addEdge('ID3','ID4',width=5,color='green')from pynteractive import *
import random
a=PhyloTree()
a.setData('(109:0.5593,((53:1.8461,((185:1.5264,((((198:0.7133,(14:1.7812,(70:0.9566,((178:1.4691,((45:0.7471,(194:0.6693,((44:0.5577,((13:0.8088,((191:0.5682,((61:0.5975,(88:3.2495,(9:1.0308,(96:0.8686,(((115:0.8278,(123:0.8377,(1:0.5639,179:1.0903):0.5946):1.4461):0.7937,(16:1.1170,154:0.6546):0.6107):0.5630,(23:0.6146,(64:0.6340,81:0.6373):1.7269):1.4345):0.9564):0.8100):0.6957):0.5944):1.0511,((56:1.9748,160:0.5840):0.9831,((66:0.6673,(42:0.7604,121:0.9784):0.8448):0.7313,(7:0.6708,162:0.7519):0.8166):1.0403):1.1924):0.9697):0.7165,(117:0.7042,(184:1.4130,(50:0.9100,(101:0.8581,(37:0.6301,200:0.8667):0.6302):1.1244):1.4690):1.9430):0.8444):0.5968):0.6728,(30:1.1661,33:1.1261):0.8310):2.2959):0.7608,(190:0.6007,196:0.9444):0.6424):0.6270):0.8282):0.9730,(24:1.4291,118:0.8477):1.4567):0.6991):0.8921,((133:0.7706,(28:0.5830,(134:0.6095,175:0.6930):0.7241):0.8666):0.9387,(111:1.0094,(136:0.5893,138:1.1745):1.5885):0.7924):0.5738):0.8773):0.5963):0.6160):1.0136,((65:1.1500,97:1.0232):1.3978,((57:0.5738,187:1.6658):0.6071,((19:0.7025,(174:1.3017,(104:1.2256,(114:0.8844,132:0.9376):0.6582):0.7183):1.1257):0.5755,(95:0.9269,((142:0.9090,(39:0.6623,(72:0.6360,164:0.9143):0.7035):4.5670):0.6282,((25:0.9429,(146:0.6349,(137:2.3101,((86:0.5907,(151:0.6346,171:0.6288):1.2030):1.2696,(32:0.5801,161:0.5600):1.3039):1.5206):0.5787):0.6616):0.7571,(43:2.0269,(131:0.6637,(12:1.7647,(156:1.1010,(172:0.8216,(153:0.8397,(((11:1.1326,188:0.7363):1.2086,(35:0.6256,(189:0.5714,((159:2.1437,(120:0.7276,(79:0.8632,98:0.8285):0.6579):0.8806):0.7212,(63:0.8597,85:0.7613):1.1212):0.5833):0.9273):0.6866):0.8127,(8:1.4761,(176:0.6388,(173:0.6236,(38:0.7009,177:0.6063):0.7085):1.4928):1.0702):0.5824):1.1679):1.5157):0.6207):1.2862):0.9861):0.9956):0.8808):0.7404):0.7407):1.4742):2.3546):0.6926):1.6898):1.0044,(68:3.0620,181:0.8448):0.7053):0.6960,(36:0.9977,76:0.6317):0.8789):0.6850):0.6060,(130:1.8879,(27:0.9512,(163:0.7594,197:1.3480):2.2115):0.7601):1.8072):1.2875):0.8267,(193:1.5216,(4:0.6166,(112:0.7144,147:0.9374):0.7245):0.6220):0.6376):1.6023,((82:2.8243,((92:1.1603,148:1.2875):0.6096,(18:2.2320,110:0.9872):1.3756):0.6613):0.8081,(3:0.6139,(94:0.8184,(80:2.5720,(149:1.2856,((59:0.7261,((139:1.2208,(62:0.6156,87:0.5686):0.8219):0.5661,(31:0.6006,55:0.7081):0.8803):0.5895):4.4796,(29:1.0162,((150:0.8578,(6:0.7863,106:0.5613):0.6144):0.9523,(51:2.2633,(199:0.8779,(126:0.5832,(99:1.2345,(((47:0.5868,52:0.5764):0.5797,((89:2.4215,((34:1.3367,168:1.2975):0.9865,(40:1.4390,(119:0.6238,(186:0.6974,(69:0.5586,((107:0.6821,(58:1.3881,116:0.9332):1.2708):0.9753,((10:1.1451,54:1.2720):1.1650,((141:1.0443,(74:1.8388,(21:1.1221,83:0.8512):1.5698):0.8246):0.5762,(129:0.6327,(75:0.8794,(48:0.8473,125:1.0579):0.8496):0.8923):0.6014):1.3489):1.8732):0.8591):0.5691):1.2968):0.9153):1.0208):0.6514):0.6898,(166:1.4354,(22:0.7493,(2:1.1837,(183:0.9209,(5:1.1304,(93:1.1079,144:0.6024):0.5676):1.7392):1.0896):0.6673):0.5778):0.5953):0.7470):0.5946,(((26:1.2338,165:0.7093):1.2264,((195:1.5322,(158:1.4151,(170:0.6407,(67:0.9098,(49:0.9280,143:0.7676):1.3389):0.5612):0.6873):0.9481):0.7016,(90:1.0637,(84:0.8715,(105:0.7043,157:0.6207):0.6683):1.8207):0.6640):1.0868):0.9417,(100:1.0056,(127:1.5781,((17:0.9746,(77:0.8027,180:1.4619):0.6277):1.1663,(140:1.7778,(169:0.9060,(128:0.6329,(145:0.5933,((122:0.6385,(155:0.9812,((71:0.8869,103:0.8851):1.1801,(167:0.8196,(102:0.7040,(113:0.9985,(78:1.1891,(15:1.1411,182:0.5817):0.6458):0.5856):0.8109):0.5834):0.7143):0.6831):0.7380):0.9687,((108:0.7798,152:2.0513):0.8877,(46:1.3488,((73:0.6343,(60:1.0697,(20:0.7480,192:0.9474):0.9843):1.4541):0.8802,(41:0.8659,(135:0.6945,(91:1.0905,124:0.6244):0.8901):0.9333):1.0731):0.8375):0.6176):0.9982):0.9024):0.7677):1.7023):1.5721):2.7324):0.5982):1.0601):0.6174):0.9339):0.6215):1.2051):0.7775):1.9509):0.6680):0.7644):0.6658):2.0353):1.0737):1.4884):0.8140):0.6216):0.7000);')
a.view()
t1=a.addTrack("first track",'magenta')
t2=a.addGradientTrack("Second track",'blue',0,100)
for i in range(60):
a.addTrackFeature(t1,str(random.randint(1,199)))
for i in range(1,199):
a.addTrackFeature(t2,str(i),value=random.randint(0,100))
b1=a.addBar('first bar','lightblue',1,50)
b2=a.addBar('second bar','mediumpurple',1,50)
for i in range(1,201):
a.addTrackBar(b1,str(i),random.randint(1,51))
a.addTrackBar(b2,str(i),random.randint(1,51))
a.markClade(['144','93'],'red')
a.markClade(['116','107','58',],'blue')
a.markClade(['39','72','164',],'green')
raw_input()De Bruijn Graph Gene assembly using Pynteractive
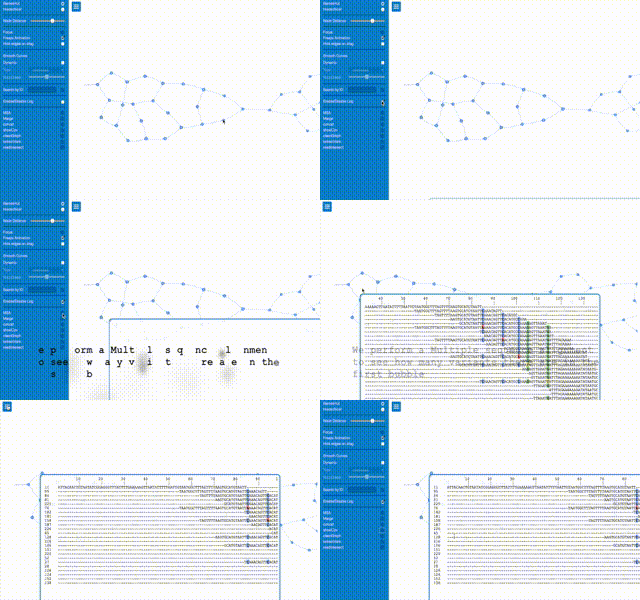
Being able to debug graphically gene assembly while coding was very helpful. This tool motivated pynteractive development.
In our work it's very important to relate samples geographically in order to detect potential outbreaks and study bacterial transmission. (Dataset shown is randomly generated) Source code
- Carlos del Ojo
- Oriol Mazariegos


