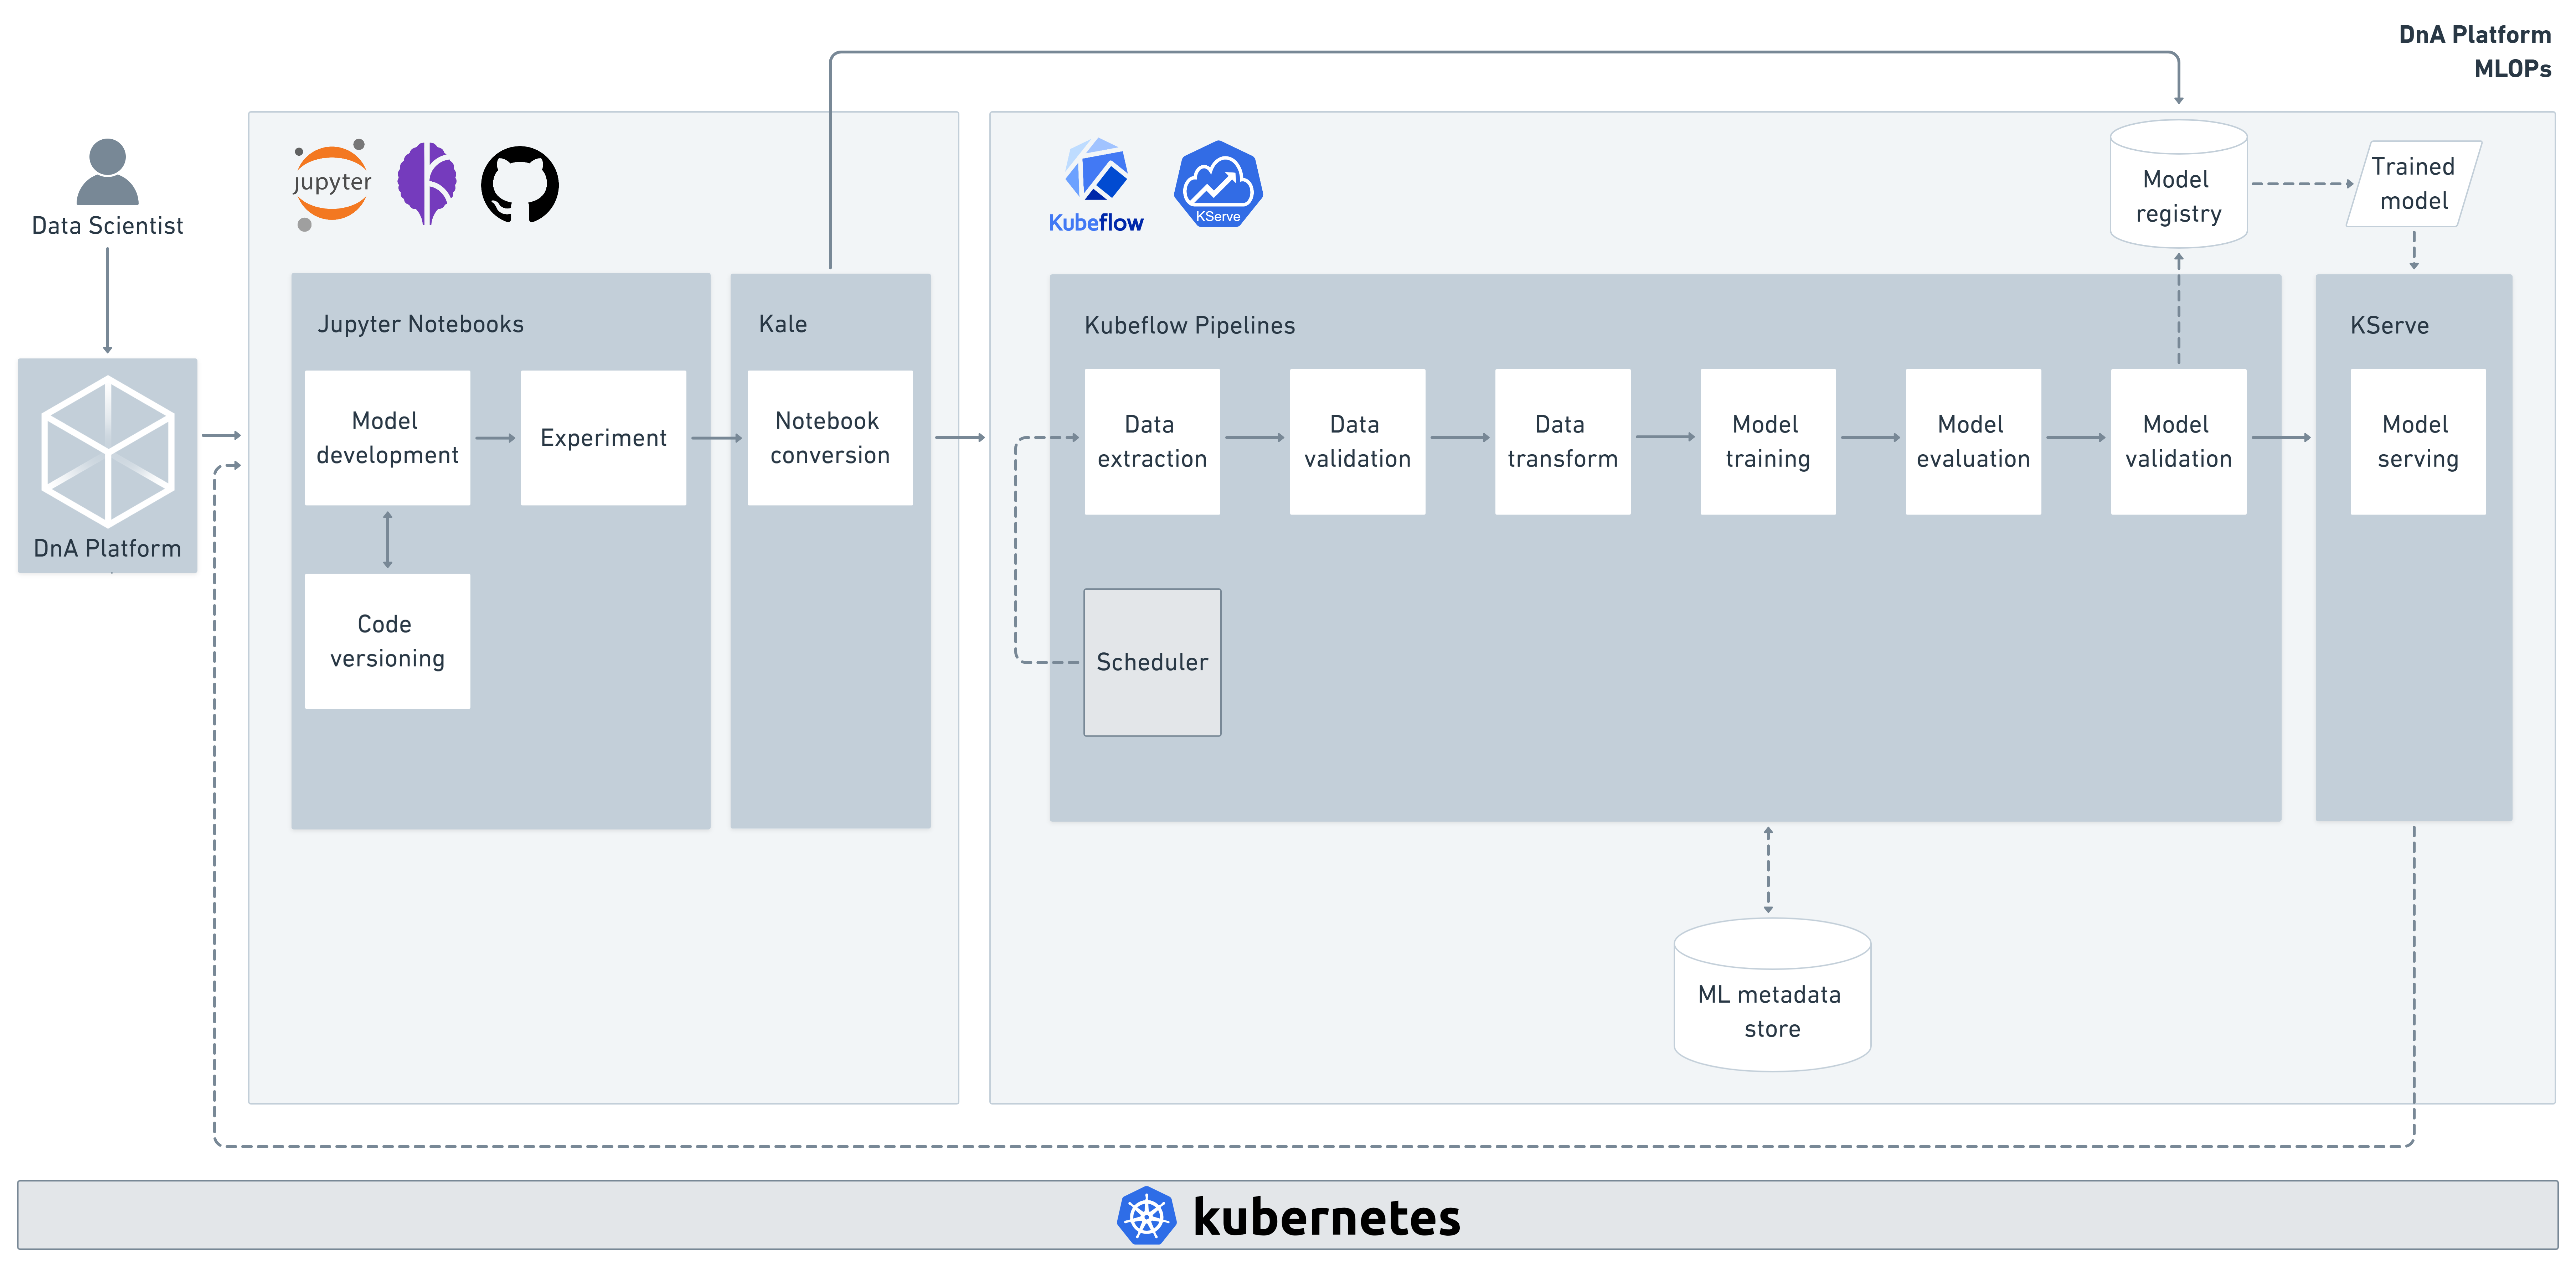
The design of MLOps lifecycles in the modern environments where ML models are being developed is a requirement for the age of AI. The reasons, are multiple but mainly focused on two problems: the number of the ML systems that fail to reach production is specifically high, and the technical debt between Data Scientists and Software engineers leads to time and resources costs. Google (2020) identifies that the automation of an ML CI/CD pipeline includes six distinct steps:
- Development and experimentation include the development of the ML solutions and outputs to the source code of the models.
- Pipeline Continuous Integration (CI) describes the build process of the source code and outputs to pipeline components.
- Pipeline Continues Delivery (CD) outlays the deployment of the CI outputs.
- Automated Triggering is related to the automatic Pipelines execution due to a scheduler or a trigger.
- Model Continuous Delivery is achieved by serving the model and making it available as a prediction service.
- Monitoring refers to the information collected about the model based on the predictions and constitutes the set-off to start a new model cycle.
Figure 1 presents the diagram of the MLOps workflow designed for the DnA Platform. The basic layout of the lifecycle was based on a combination of the open-source services the platform was initially offering (Jupyter Notebooks with Git integration) and on selected open-source tools that originate in the Kubeflow ecosystem. All tools were modified and adjusted to secure enterprise-ready versions. The pipeline fulfills the five stages described by Google.
The users of the DnA Platform can utilize Jupyter Notebooks to develop their ML models while storing the different code versions in GitHub. When their source code is complete, they can use an optimized version of Kale directly from Notebooks to:
- Build and deploy with a click of a button, portable, scalable, and containerized ML workflows of their models in Kubeflow Pipelines
- Store their ML models to a registry and serve them via KServe
The Monitoring stage is achieved by getting predictions using simple POST requests to the models’ APIs. That can be done either directly from Notebooks or via any CLI.
Furthermore, everything is reachable via the handy and user-friendly UI of Kubeflow Central Dashboard. There, users can access their deployed Pipelines and served Models, organize experiments, share their solutions to multiple contributors, schedule automatic Pipeline executions, get insights about artifacts from their systems, and much more.
