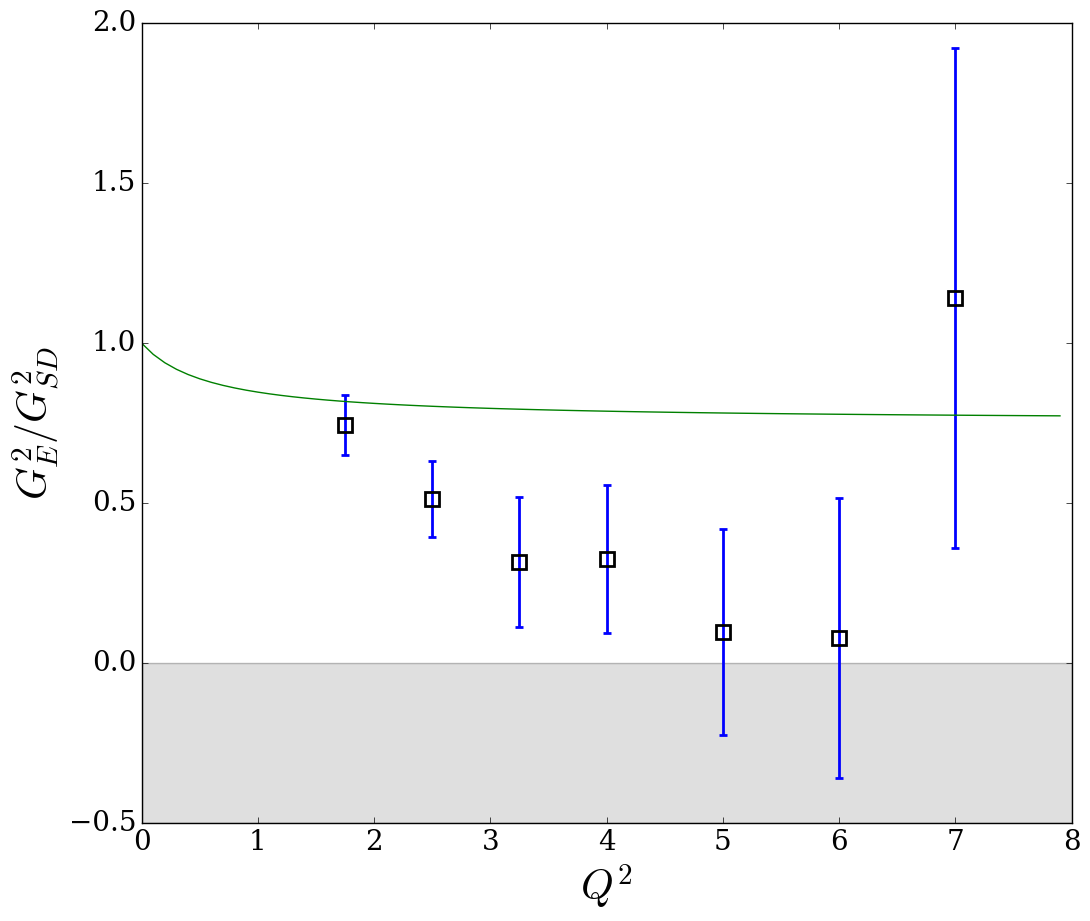
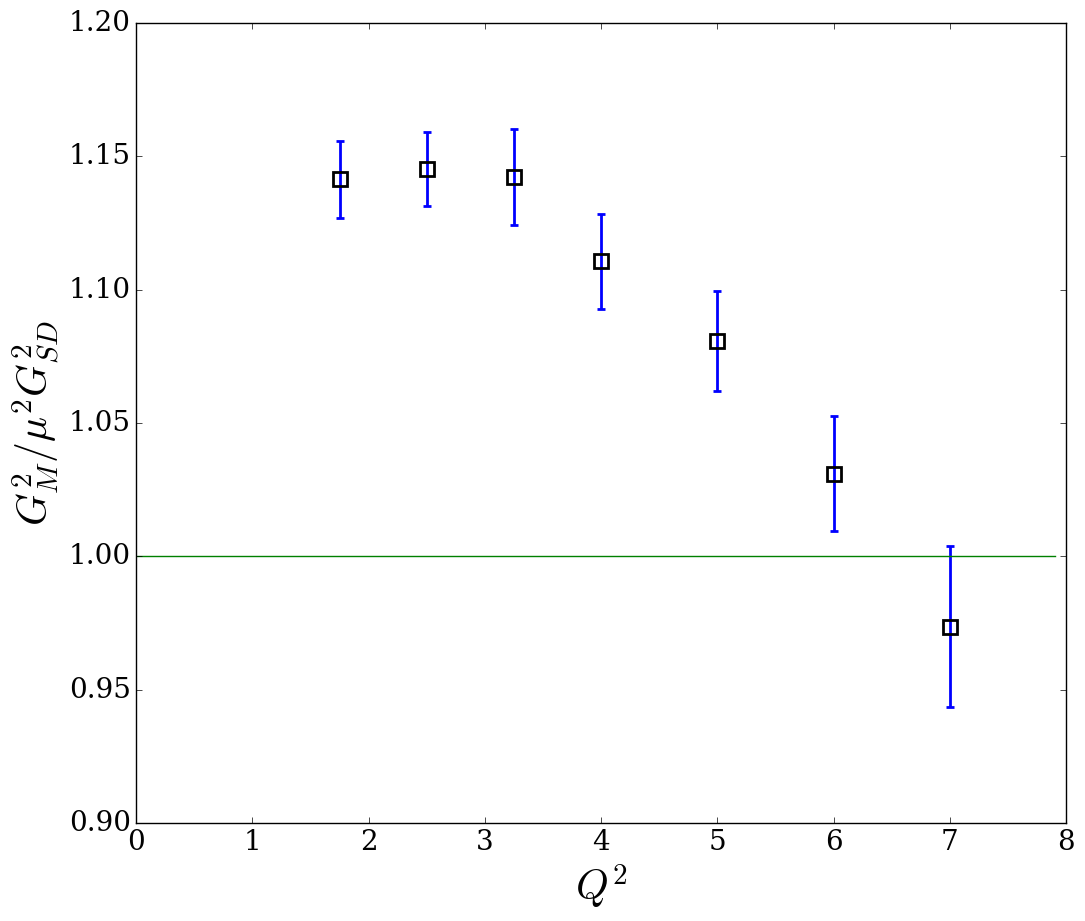
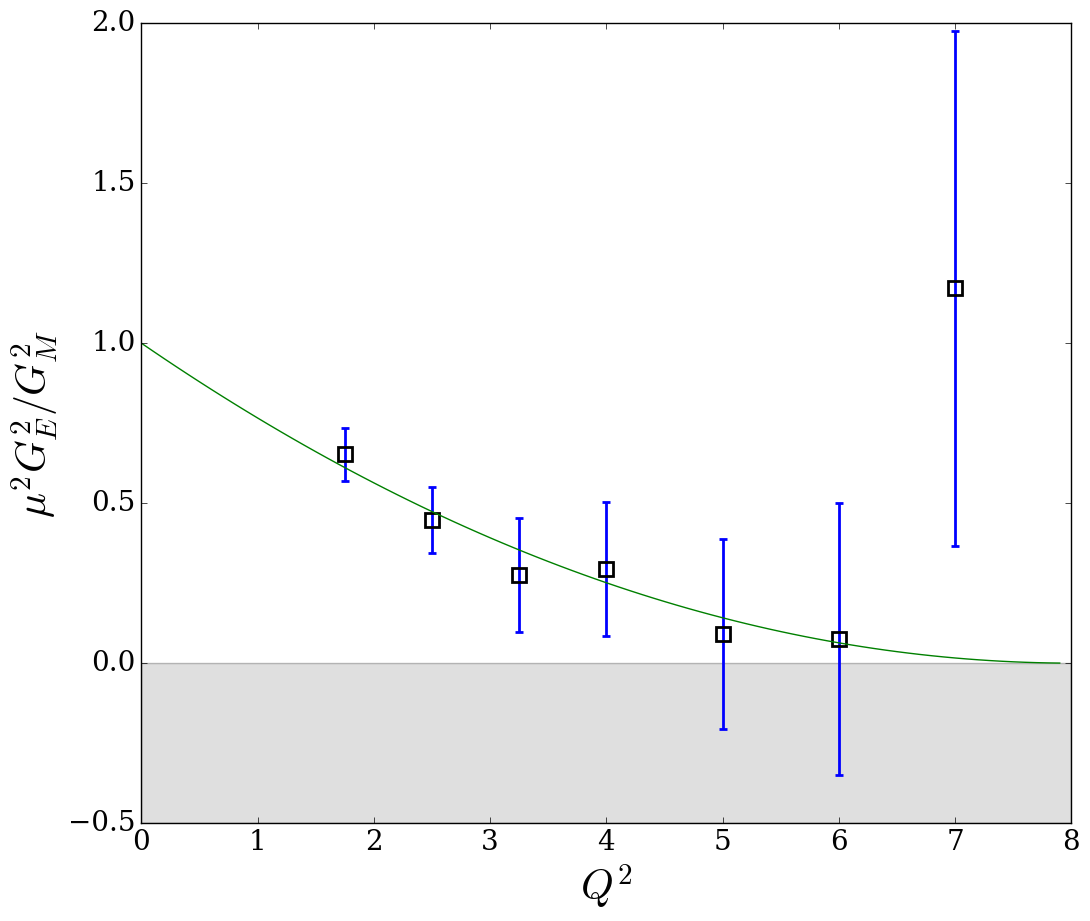
These are the Python scripts and subsequent results from this reanalysis of electron-proton scattering data from the NE11 experiment at SLAC (see this paper).


The scripts are written in Python 3.5.2, so Python 3.0 or greater is required. numpy, scipy, and matplotlib are required.
| File/Path name | Description |
|---|---|
| Form Factors/ | Plots (PNG files) of form factors and their ratios versus Q^2 for three different analyses |
| chi_square.py | Performs chi-squared analysis of scattering data as reduced cross sections versus epsilon. Generates chi-squared distribution histograms. |
| data.csv | 8 GeV scattering data from SLAC NE11, reported by Andivahis et al. 1994 |
| data2.csv | Annotated 8 GeV and 1.6 GeV scattering data from SLAC NE11, reported by Andivahis et al. 1994 |
| data3.csv | (not in use) Annotated 8 GeV and 1.6 GeV scattering data from SLAC NE11, reported by Andivahis et al. 1994 1.6 GeV cross sections and errors are multiplied by a normalizing factor of 0.958. |
| data4.csv | (not in use) Annotated 8 GeV and 1.6 GeV scattering data from SLAC NE11, reported by Andivahis et al. 1994 1.6 GeV cross sections and errors are multiplied by a normalizing factor of 0.958. Includes values of E'. |
| data5.csv | Annotated 8 GeV and 1.6 GeV scattering data from SLAC NE11, reported by Andivahis et al. 1994. Rows where angle ~= 90 degrees are marked to be multiplied by a normalizing factor. |
| ff_plot.py | Generates plots of form factors (seen above) based on results CSVs generated by rosenbluth.py |
| latexify.py | (not in use) Converts results CSVs generated by rosenbluth.py to LaTeX syntax for tables |
| rosenbluth.py | Main analysis. Computes form factors and their errors given an input file and normalization factor. Generates output CSV files and form factor distribution histograms. |
Analysis without any normalization of scattering data.
python rosenbluth.py data2.csv
Analysis with normalization of 1.6 GeV cross sections by 0.958.
python rosenbluth.py data2.csv 0.958
Analysis with normalization of 8 GeV cross sections where angle ~= 90 degrees by 0.958.
python rosenbluth.py data5.csv 0.958
Chi-squared analysis without any normalization of scattering data.
python chi_square.py data2.csv
Chi-squared analysis with normalization of 1.6 GeV cross sections by 0.958.
python chi_square.py data2.csv 0.958
Chi-squared analysis with normalization of 8 GeV cross sections where angle ~= 90 degrees by 0.958.
python chi_square.py data5.csv 0.958
Plot form factors from 1 or more output files located in a /Figures/ subdirectory (generated by rosenbluth.py)
python ff_plot.py {results 1} {results 2} {results 3} ...