For getting started, we recommend Scanpy’s reimplementation :tutorial:`pbmc3k` of Seurat’s [Satija15]_ clustering tutorial for 3k PBMCs from 10x Genomics, containing preprocessing, clustering and the identification of cell types via known marker genes.
For more possibilities on visualizing marker genes: :tutorial:`visualizing-marker-genes`
Get started with the following example for hematopoiesis for data of [Paul15]_: :tutorial:`paga-paul15`
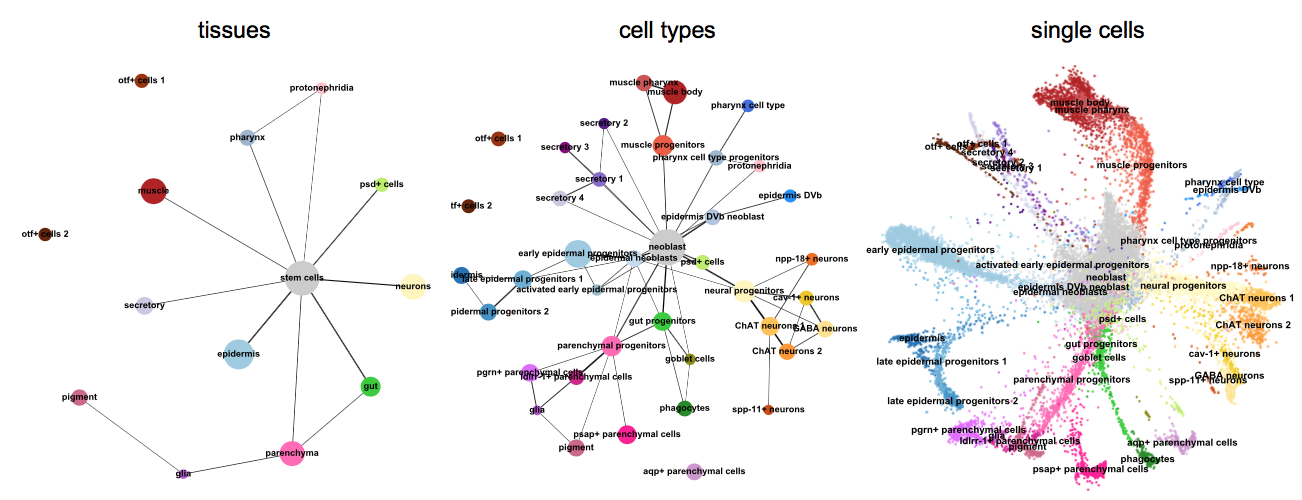
More examples for trajectory inference on complex datasets can be found in the PAGA_ repository [Wolf19]_, for instance, multi-resolution analyses of whole animals, such as for planaria for data of [Plass18]_.
As a reference for simple pseudotime analyses, we provide the diffusion pseudotime (DPT) analyses of [Haghverdi16]_ for two hematopoiesis datasets: DPT example 1 [Paul15]_ and DPT example 2 [Moignard15]_.
Map labels and embeddings of reference data to new data: :tutorial:`integrating-data-using-ingest`
See the Seurat to AnnData notebook for a tutorial on anndata2ri.
See the cell cycle notebook.
Visualize and cluster 1.3M neurons from 10x Genomics.
Simulating single cells using literature-curated gene regulatory networks [Wittmann09]_.
- Notebook for myeloid differentiation
- Notebook for simple toggleswitch
See pseudotime-time inference on deep-learning based features for cell cycle reconstruction from image data [Eulenberg17]_.


