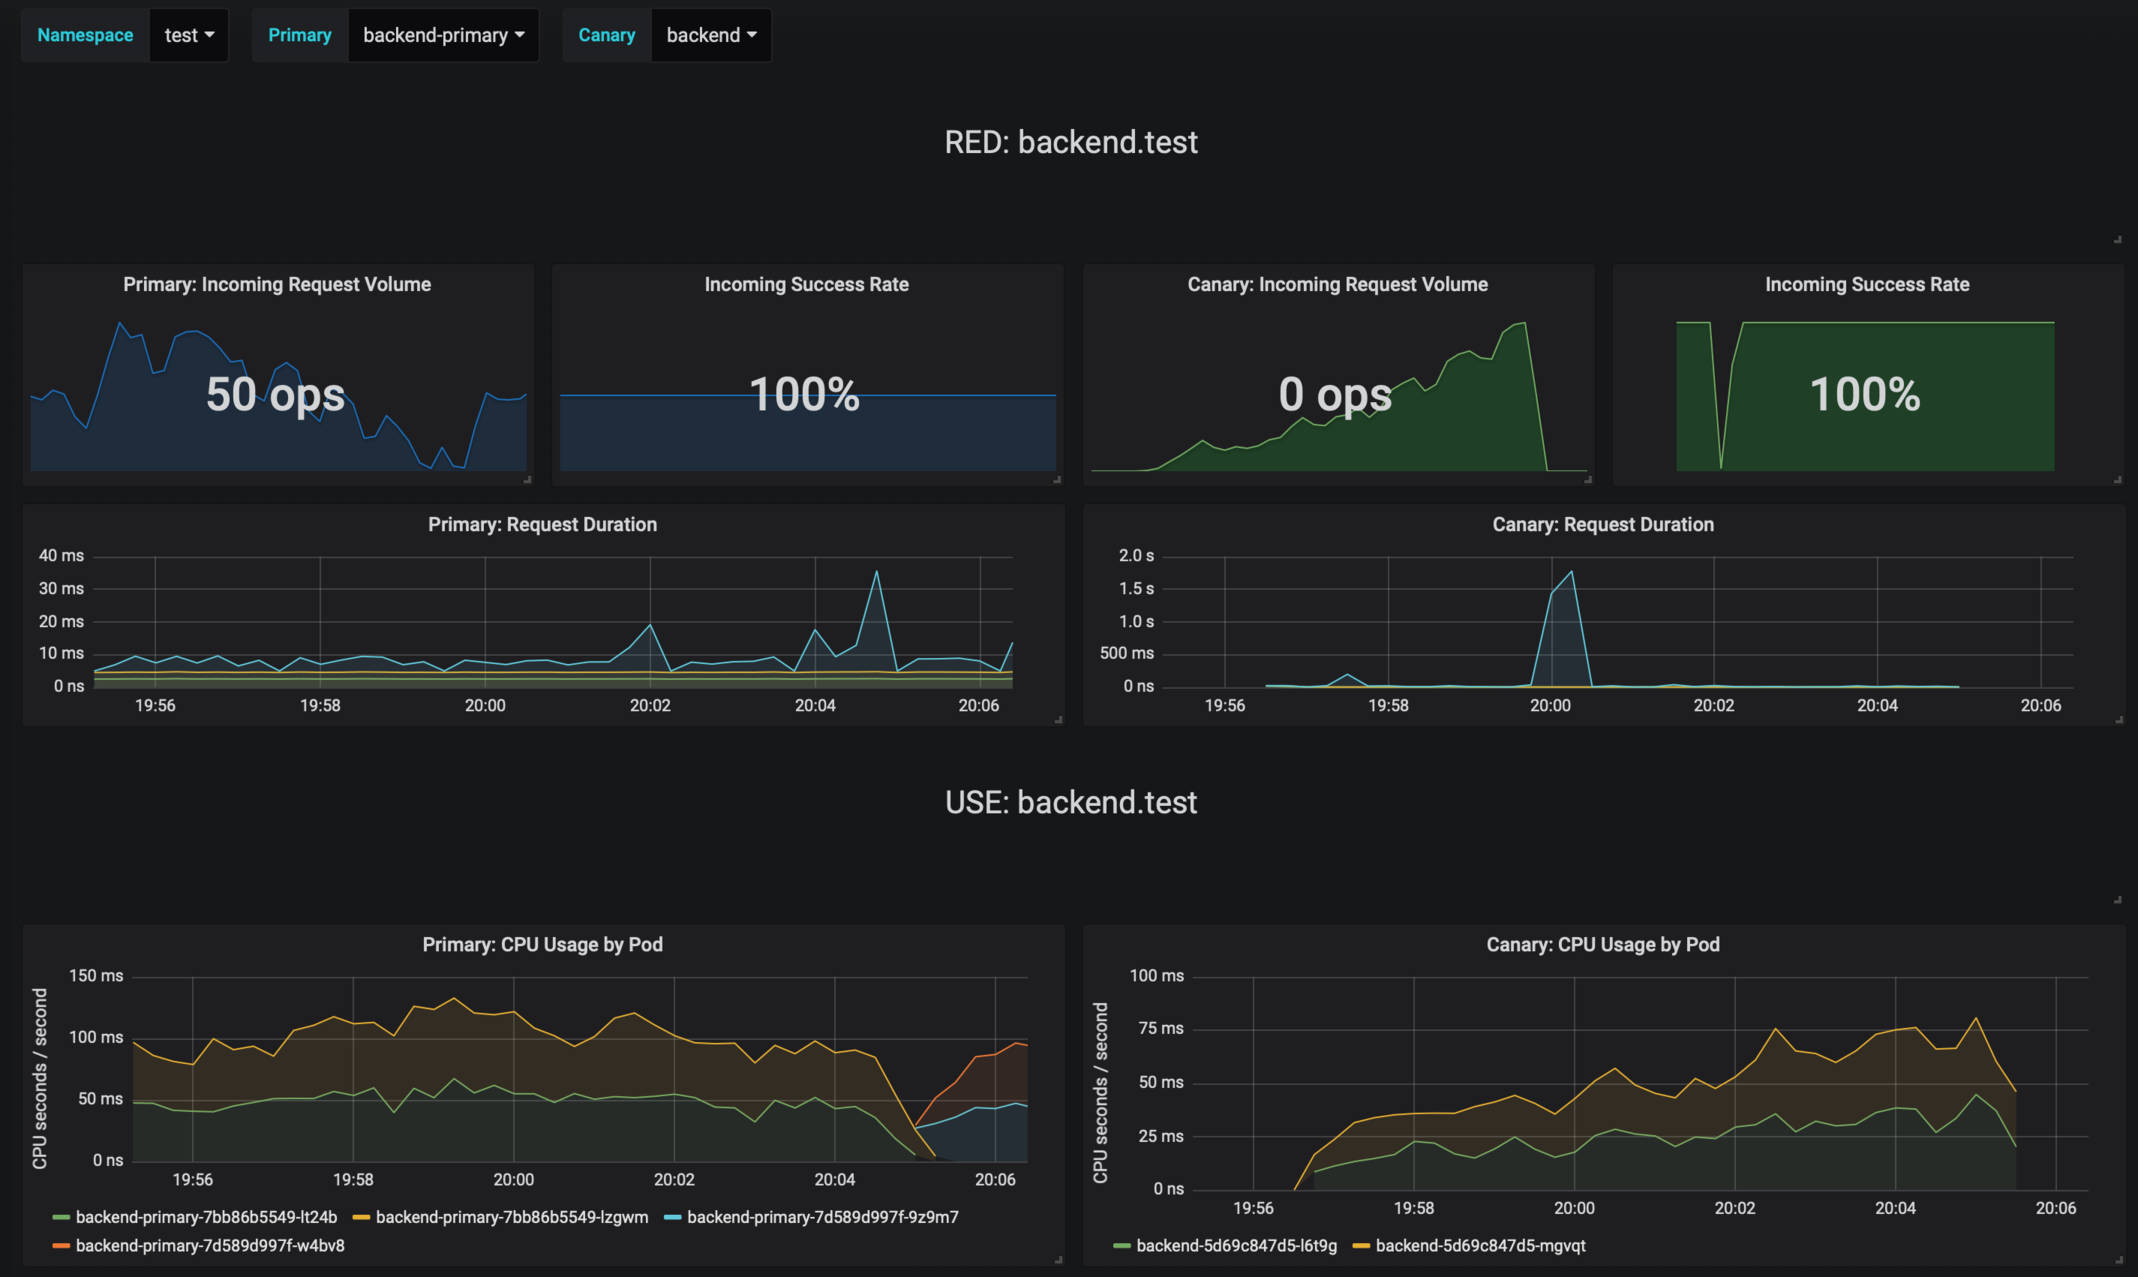
Grafana dashboards for monitoring progressive deployments powered by Flagger and Prometheus.
- Kubernetes >= 1.11
- Prometheus >= 2.6
Add Flagger Helm repository:
helm repo add flagger https://flagger.appTo install the chart for Istio run:
helm upgrade -i flagger-grafana flagger/grafana \
--namespace=istio-system \
--set url=http://prometheus:9090
To install the chart for AWS App Mesh run:
helm upgrade -i flagger-grafana flagger/grafana \
--namespace=appmesh-system \
--set url=http://appmesh-prometheus:9090
The command deploys Grafana on the Kubernetes cluster in the default namespace. The configuration section lists the parameters that can be configured during installation.
To uninstall/delete the flagger-grafana deployment:
helm delete --purge flagger-grafanaThe command removes all the Kubernetes components associated with the chart and deletes the release.
The following tables lists the configurable parameters of the Grafana chart and their default values.
| Parameter | Description | Default |
|---|---|---|
image.repository |
Image repository | grafana/grafana |
image.pullPolicy |
Image pull policy | IfNotPresent |
image.tag |
Image tag | <VERSION> |
replicaCount |
desired number of pods | 1 |
resources |
pod resources | none |
tolerations |
List of node taints to tolerate | [] |
affinity |
node/pod affinities | node |
nodeSelector |
node labels for pod assignment | {} |
service.type |
type of service | ClusterIP |
url |
Prometheus URL | http://prometheus:9090 |
Specify each parameter using the --set key=value[,key=value] argument to helm install. For example,
helm install flagger/grafana --name flagger-grafana \
--set token=WEAVE-CLOUD-TOKEN
Alternatively, a YAML file that specifies the values for the above parameters can be provided while installing the chart. For example,
helm install flagger/grafana --name flagger-grafana -f values.yamlTip: You can use the default values.yaml