This example demonstrates how to analyze Apache logs for security vulnerabilities using the Graph capability of the Elastic Stack. The aim here is to begin exploration of the data from a security vulnerability that is well known (and likely unsuccessful) and can be identified in the logs e.g. an attempted directory traversal. From here, the user identify:
- The origin of the request and subsequently other statistically significant attempts by the same source
- From other threats identified in (1) other potential sources of threat.
These above steps can be repeated as the graph and 'threat space' is explored.
The data analyzed in this example is from the secrepo.com and represents the sites apache logs. This data, published by Mike Sconzo, is licensed under a Creative Commons Attribution 4.0 International License .
This example historically used Logstash for ingestion. These configurations have been retained for reference only. Per recommended best practices, this example uses the Filebeat.
Example has been tested in following versions:
- Elasticsearch 5.4
- X-Pack 5.4
- Kibana 5.4
- Filebeat 5.0
- Python 3.5.x
- Elasticsearch user agent plugin 5.4
- Elasticsearch user geoip plugin 5.4
- download_data.py - Python script to download secrepo logs
- requirements.txt - Pip python dependencies file
- secrepo.json - ES Index Template
- secrepo_pipeline.json - ES Ingestion Pipeline
- filebeat_secrepo.yml - Filebeat configuration file
- secrepo_logstash.conf - Logstash configuration. REFERENCE ONLY.
- patterns - Custom logstash patterns
-
Follow the Installation & Setup Guide to install and test the elastic stack (you can skip this step if you already have a working installation of the Elastic stack)
-
Install the X-Pack plugin for both Kibana and Elasticsearch
<path_to_elasticsearch_root_dir>/elasticsearch-plugin install x-pack
<path_to_kibana_root_dir>/bin/kibana-plugin install x-pack
-
Install the required plugins into Elasticsearch
  <path_to_elasticsearch_root_dir>/bin/elasticsearch-plugin install ingest-user-agent
  <path_to_elasticsearch_root_dir>/bin/elasticsearch-plugin install ingest-geoip
-
Run Elasticsearch & Kibana
<path_to_elasticsearch_root_dir>/bin/elasticsearch
<path_to_kibana_root_dir>/bin/kibana
The following assumes the default username and password of "elastic" and "changeme". These can be changed as detailed here. If changed, ensure the Logstash.conf file is updated accordingly to permit ingestion.
-
Check that Elasticsearch and Kibana are up and running.
- Open
localhost:9200in web browser and authenticate with "elastic" and "changeme" -- should return status code 200 - Open
localhost:5601in web browser -- should display Kibana UI.
Note: By default, Elasticsearch runs on port 9200, and Kibana run on ports 5601. If you changed the default ports, change the above calls to use appropriate ports.
- Open
-
Download and install Filebeat as described here. Do not start Filebeat
Download the raw data from the secrepo website using the script download_data.py before processing and indexing the raw files using the provided Logstash configuration.
The following details the required steps:
-
Download the contents of this folder
-
download_data.py- Python script to download the raw files. -
requirements.txt- Python dependencies for above script -
secrepo.json- ES template -
secrepo_pipeline.json- Ingestion pipeline -
filebeat_secrepo.yml- Filebeat configurationwget https://raw.githubusercontent.com/elastic/examples/master/apache_logs_security_analysis/download_data.py wget https://raw.githubusercontent.com/elastic/examples/master/apache_logs_security_analysis/requirements.txt wget https://raw.githubusercontent.com/elastic/examples/master/apache_logs_security_analysis/secrepo.json wget https://raw.githubusercontent.com/elastic/examples/master/apache_logs_security_analysis/secrepo_pipeline.json wget https://raw.githubusercontent.com/elastic/examples/master/apache_logs_security_analysis/filebeat_secrepo.yml
-
-
Setup Python environment
Requires Python 3. Install dependencies with pip i.e.
pip install -r requirements.txt -
Run Python script to download data. This will download all data starting from 2015-01-17 to the current day. This script will create a subfolder
datainto which a log file for each day will be extracted. Some days may not be available.python3 download_data.pyThe start date and output folder can be optionally specified as parameters e.g.
python3 download_data.py --start_date 2016-01-17 --output_folder ./secrepo_data -
Install the ingest pipeline
curl -XPUT -H 'Content-Type: application/json' 'localhost:9200/_ingest/pipeline/secrepo_pipeline' -d @secrepo_pipeline.json -u elastic:changeme
-
Copy the
secrepo.jsonandfilebeat_secrepo.ymlfiles to the installation directory of Filebeat.cp secrepo.json <path_to_filebeat_root_dir>/secrepo.json cp filebeat_secrepo.yml <path_to_filebeat_root_dir>/filebeat_secrepo.yml
-
Start Filebeat to begin ingesting data to Elasticsearch. Notice how we use commmand line parameters to override the path to the files downloaded above and set the Elasticsearch username and password. The latter is only required if you have changed the defaults.
cd <filebeat_installation_dir>
./filebeat -e -c filebeat_secrepo.yml -E filebeat.prospectors.0.paths.0="<PATH_TO_SECREPO_DATA>/access*" -E output.elasticsearch.username=elastic -E output.elasticsearch.password=changeme
-
Check data availability. Once the index is indexed you can check to see if all the data is available in Elasticsearch. If you have downloaded all of the data from 2015-01-17 to the current day, you should get a
countresponse greater than300840when you run the following command (assumes default user).curl -H "Content-Type: application/json" -XGET localhost:9200/filebeat-*/_count -u elastic:changeme
- Access Kibana by going to
http://localhost:5601in a web browser - Login with the default credentials: username:
elasticand password:changeme - Connect Kibana to the
secrepoindex in Elasticsearch- Click the Management tab >> Index Patterns tab >> Create New. Specify
secrepoas the index pattern name, using the default field@timestampas the Time-field name, and click Create to define the index pattern. (Leave the Use event times to create index names box unchecked)
- Click the Management tab >> Index Patterns tab >> Create New. Specify
- Open graph
- Click on Graph app in the side navigation
- Select index
secrepoin the upper left. - Add the fields
url.parts,url,paramsandsrcas graph nodes using the (+) icon. Select an appropriate icon/colour for the node types. Not all of these fields are required and certain attack vectors maybe more effective by exploring specific fields. - Search for a common attack vector. Suggestions:
- Directory traversal - e.g.
%255c,%2e%2e/ - SQL injections e.g.
select AND from - Wordpress exploits e.g.
wordpress - Hint: Explore the ip
71.19.248.47
- Directory traversal - e.g.
- Expand the selection of nodes to explore common behaviours and to identify other potential threats and high risk sources.
For further simple common attack vectors see here
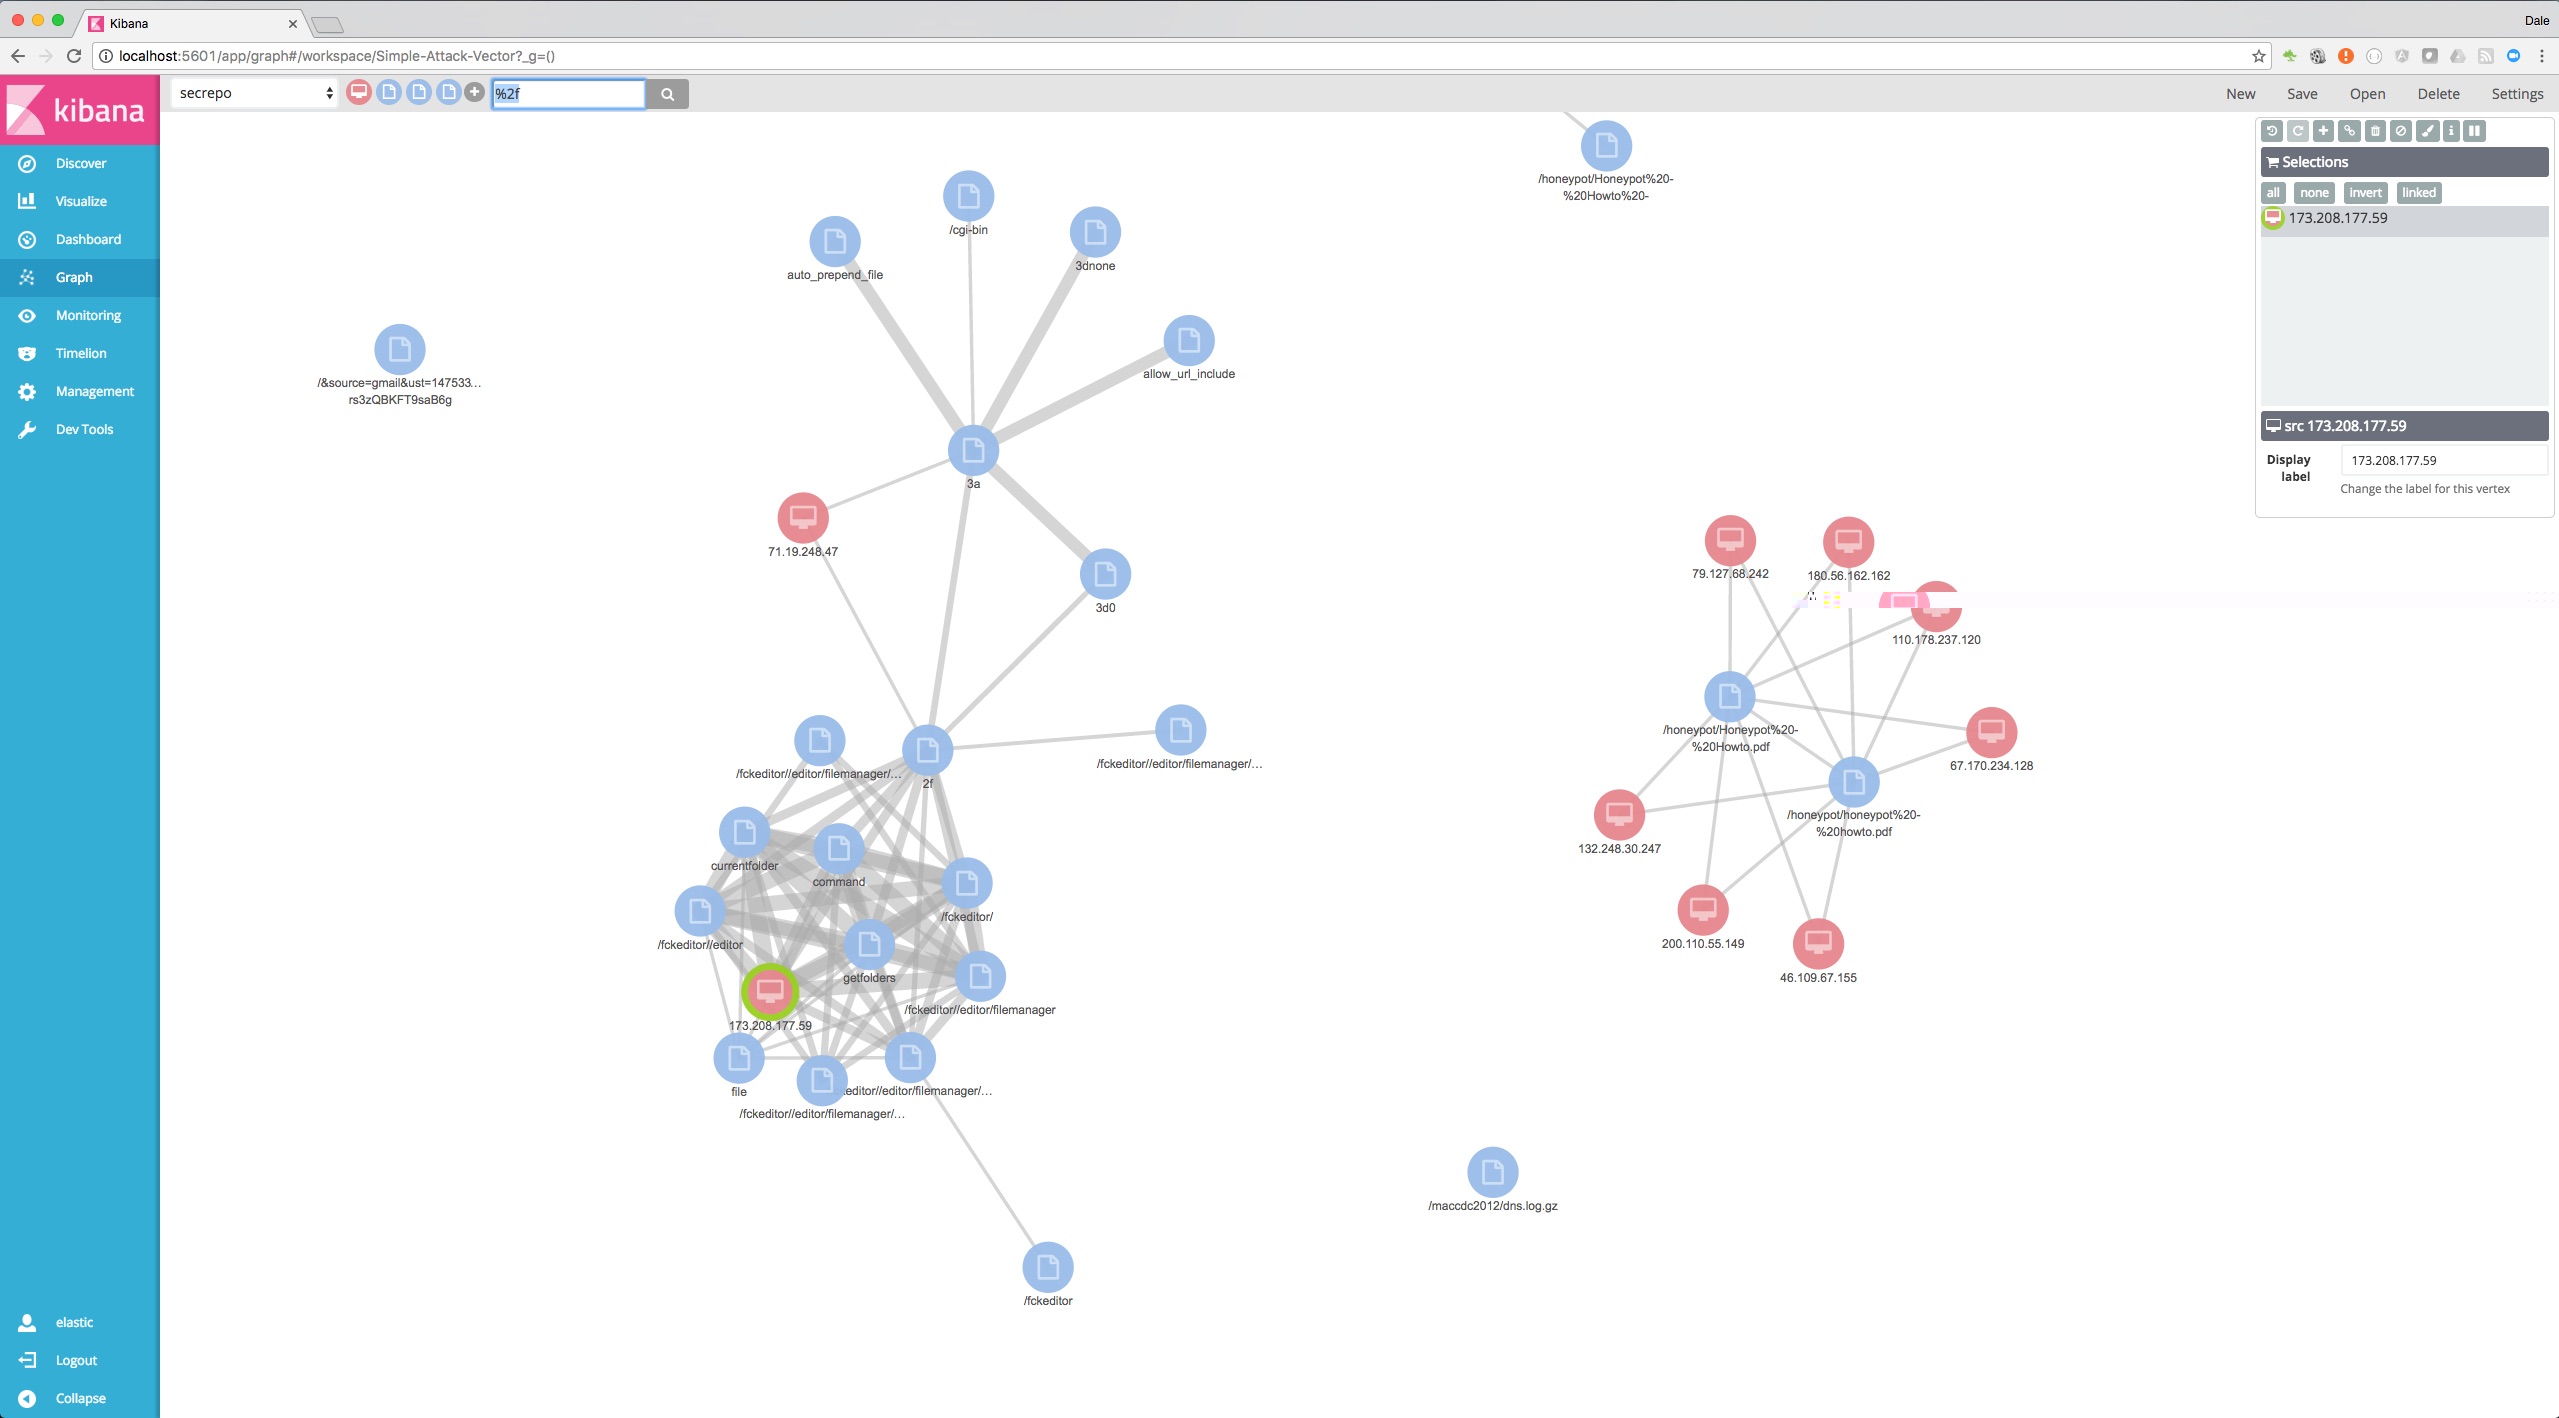
The following illustrates a search for %2f, using the fields url.parts, url, params and src as nodes.
If you run into issues running this example or have suggestions to improve it, please use Github issues to let us know. Have an easy fix? Submit a pull request. We will try our best to respond in a timely manner!
Have you created interesting examples using the Elastic Stack? Looking for a way to share your amazing work with the community? We would love to include your awesome work here. For more information on how to contribute, check out the Contribution section!