In this lab you will use an Azure Logic App to connect to Twitter and generate a stream of messages using the hashtag #NYC. The logic app will invoke the Azure Text Analytics Cognitive service to score Tweet sentiment and send the messages to Event Hubs. You will use Stream Analytics to generate the average Tweet sentiment in the last 60 seconds and send the results to a real-time dataset in Power BI.
IMPORTANT: This lab requires you have a valid Twitter account. If you don’t have one, you can sign up for free following the instructions here: https://twitter.com/signup.
IMPORTANT: This lab requires you have a valid Power BI account. If you don’t have one you can register for a 60-day trial here: https://powerbi.microsoft.com/en-us/power-bi-pro/
The estimated time to complete this lab is: 60 minutes.
IMPORTANT: Some of the Azure services provisioned require globally unique name and a “-suffix” has been added to their names to ensure this uniqueness. Please take note of the suffix generated as you will need it for the following resources in this lab:
| Name | Type |
|---|---|
| mdwdatalakesuffix | Storage Account |
| MDWEventHubs-suffix | Event Hubs Namespace |
| MDWStreamAnalytics-suffix | Stream Analytics job |
In this section you will create a container in your MDWDataLake that will be used as a repository for the NYC image files. You will copy 30 files from the MDWResources Storage Account into your NYCTaxiData container.
| IMPORTANT |
|---|
| Execute these steps on your host computer |
-
In the Azure Portal, go to the MDW-Lab resource group, and then locate and click the Azure Storage account mdwdatalakesuffix.
-
On the Overview panel, click Blobs.
-
On the mdwdalalakesuffix – Blobs blade, click + Container.
-
On the New container blade, enter the following details:
- Name: nyctweets
- Public access level: Private (no anonymous access) -
Click OK to create the new container.
In this section you will prepare Event Hubs to ingest Twitter data collected by the Logic App and save incoming messages to your Data Lake storage account.
| IMPORTANT |
|---|
| Execute these steps on your host computer |
-
In the Azure Portal, go to the lab resource group and locate the Event Hubs resource MDWEventHubs-suffix.
-
On the Event Hubs panel, click + Event Hub button to create a new event hub.
-
On the Create Event Hub blade, type “NYCTweets” in the Name field and leave the remaining fields with their default values.
-
Click Create.
-
Once the NYCTweets event hub is created, click Capture on the left-hand side menu.
-
Enter the following details:
- Capture: On
- Time window (minutes): 1
- Do not emit empty files when no events occur during the capture time window: Checked.
- Capture Provider: Azure Storage
- Azure Storage Container: [select the nyctweets container in your MDWDataLakesuffix storage account] -
Leave remaining fields with their default values.
-
Click Save Changes.
In this section you will create a Logic App to invoke the Twitter API and retrieve tweets for the hashtag #NYC. Tweets will then be formatted into a JSON message and sent to Event Hubs for processing.
| IMPORTANT |
|---|
| Execute these steps on your host computer |
-
In the Azure Portal, go to the lab resource group and locate the Logic App resource MDWLogicApp.
-
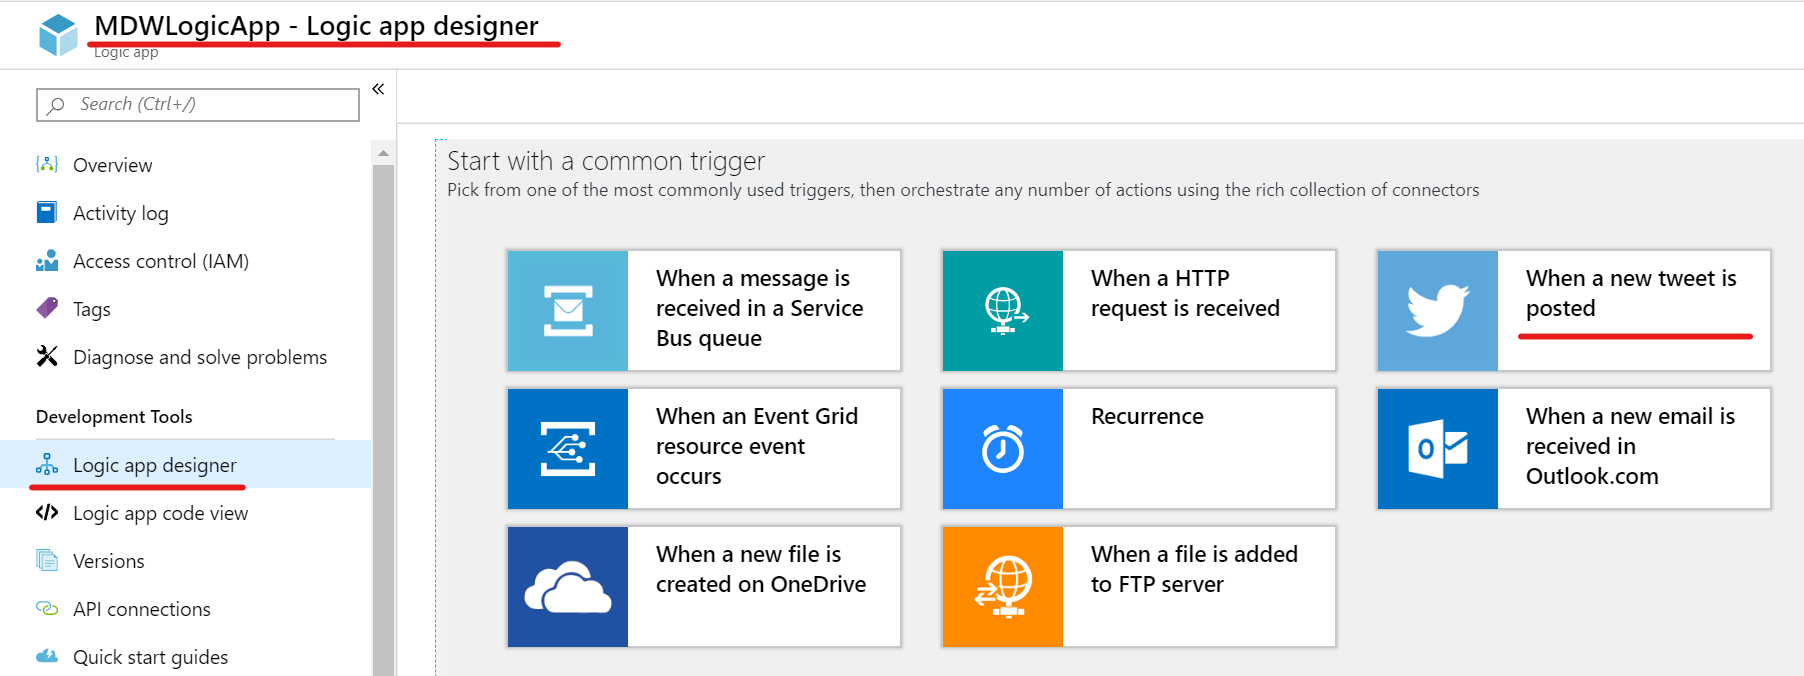
On the MDWLogicApp menu, click Logic app designer to open the design blade.
-
On the Logic app designer blade, scroll down to the section Start with a common trigger.
-
Click When a new tweet is posted.
-
On the design surface you will see the Twitter connector. Click Sign in and use your personal Twitter account to authenticate.
-
On the log on screen review the permissions that will be granted to logic apps. If you agree with the permissions granted then enter your credentials and click Authorise app.
-
On the Confirmation Required page, click Allow access to proceed with the authentication process and to grant the right permissions to Logic Apps.
-
Once authenticated with Twitter you will notice the green tick next to your user name.
-
Click Continue to configure the Twitter connector.
-
On the When a new tweet is posted activity properties, enter the follow details:
- Search text: #NYC
- Interval: 10
- Frequency: Seconds -
Leave remaining fields with their default values.
-
Click + New step to create a new Logic App task.
-
On the Choose an action box, type “Text Analytics” in the search field. Select Detect Sentiment (preview) from the Actions tab.
-
On the Text Analytics properties, type “MDWTextAnalyticsConnection” in the Connection Name field.
-
Open the Azure Portal in a new browser tab and copy Endpoint and Key values for MDWTextAnalytics.
-
Paste the values in the respective fields in the Text Analytics properties.
-
Click Create.
-
In the Detect Sentiment (preview) properties, click Add new parameter.
-
Select Text check box.
-
In the Text parameter box, select Tweet Text from the Dynamic content list.
-
Click + New step to create a new task
-
Type “Compose” in the search box and select the Compose Data Operation.
-
On the Compose properties, use the Inputs field to build a new JSON message using data elements returned by the previous tasks. Type the JSON structure you see in the picture below and use the correct fields from the Dynamic content panel for element values. Your JSON message should look like this.
IMPORTANT: Please pay special attention to the correct JSON format described as it will impact future lab steps involving Event Hubs and Stream Analytics. Note the " (double-quotes) surrounding each JSON element name and also the CreatedAt and TweetText element values. TweetID and SentimentScore element values do not need " (double-quotes).
Alternatively you can copy and paste the JSON definition below:
{
    "TweetID": @{triggerBody()?['TweetId']},
    "CreatedAt": "@{triggerBody()?['CreatedAtIso']}",
    "TweetText": "@{triggerBody()?['TweetText']}",
    "SentimentScore": @{body('Detect_Sentiment')?['score']}
}-
Click + New step to create a new task.
-
On the Choose an action box, type “Send event” in the search field. Select Send Event from the Actions tab.
-
On the Send event properties, type “MDWEventHubsConnection” in the Connection Name field.
-
Select MDWEventHubs-suffix from the list of Event Hubs Namespaces.
-
Select the default access policy RootManageSharedAccessKey.
-
Click Create.
-
On the Send event properties, select nyctweets in the Event Hub name field.
-
Click Add new parameter and select Content.
-
Click on the Content field. From the Dynamic content pop-up window, select click the See more link under Compose to display the Outputs field.
-
Select Outputs as the value for the Content field.
-
Click the Save button to save your Logic App.
-
On the Overview panel, click Enable.
-
In the Azure Portal, navigate to the MDWDataLakesuffix storage account.
-
Wait a couple of minutes and you should be able to see new files being created in the nyctweets container.
In this section you will configure Stream Analytics to perform analytic queries on streaming data sent by Event Hubs and generate outputs to Power BI.
| IMPORTANT |
|---|
| Execute these steps on your host computer |
-
In the Azure Portal, go to the lab resource group and locate the Stream Analytics resource MDWStreamAnalytics-suffix.
-
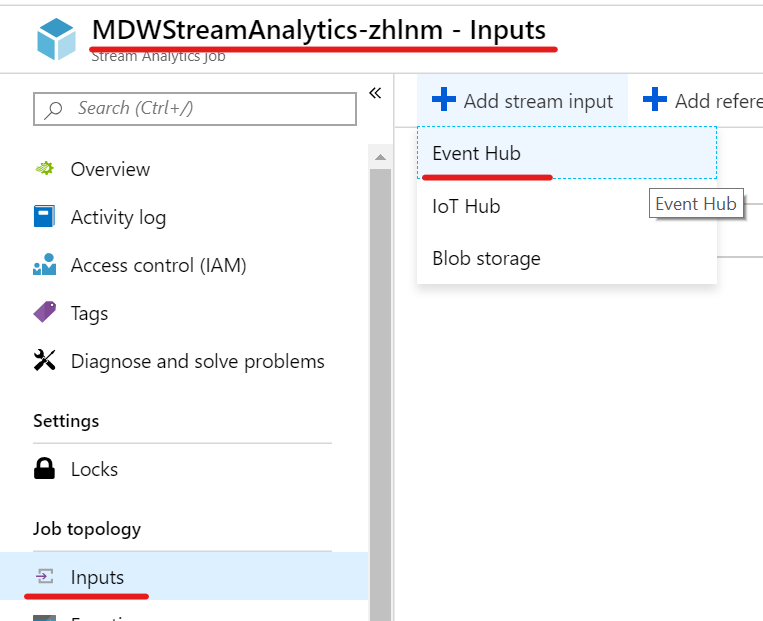
On the Inputs panel, click + Add stream input button and select Event Hub to create a new stream input.
-
On the Event Hub New input blade enter the following details:
- Input alias: MDWEventHubs
- Event Hub namespace: MDWEventHubs-suffix
- Event hub name > Use existing: nyctweets -
Leave remaining fields with their default values.
-
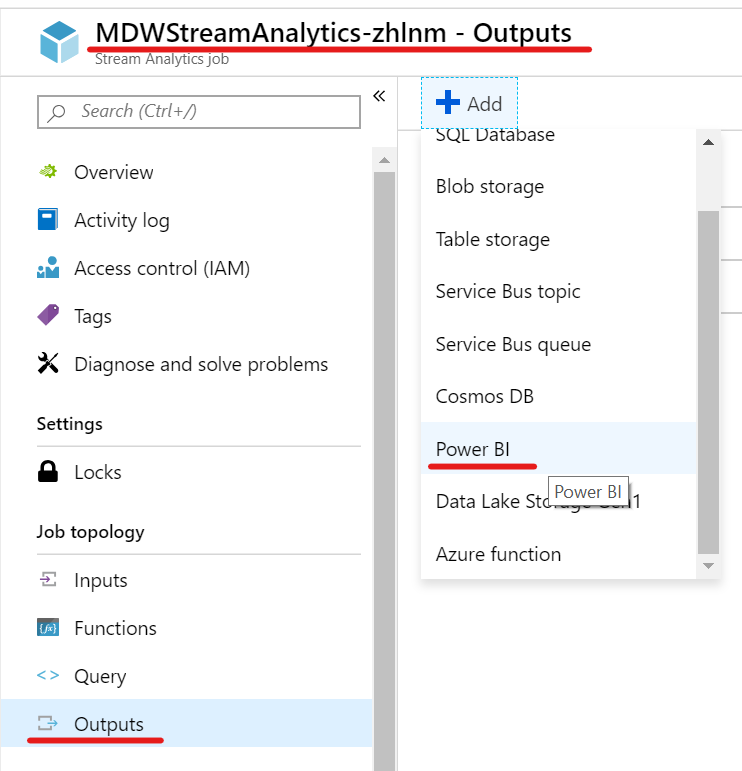
On the Outputs panel, click + Add button and select Power BI to create a new stream output.
-
On the Power BI New Output blade, click Authorize to authenticate with Power BI.
-
Once authenticated, enter the following details:
- Output alias: PBITweetDetails
- Group Workspace: My Workspace
- Dataset name: NYCTweetStats
- Table name: TweetDetails -
Leave remaining fields with their default values.
-
Click Save.
-
Repeat the process to create another Power BI Output. This time enter the following details:
- Output alias: PBITweetStats
- Group Workspace: My Workspace
- Dataset name: NYCTweetStats
- Table name: TweetStats -
Click Save.
-
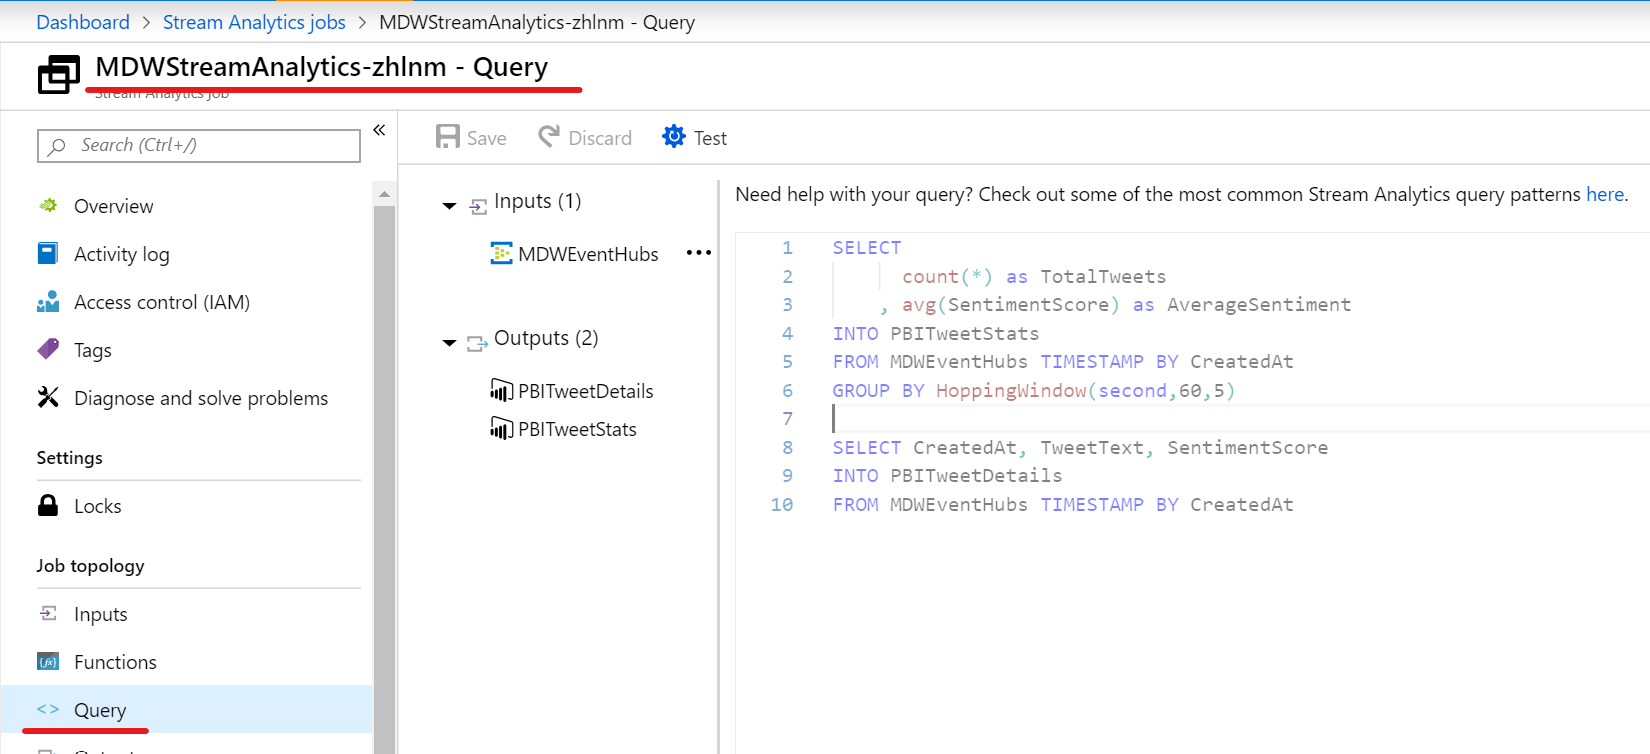
On the Query panel, note the inputs and outputs you created in the previous steps.
-
Enter the following SQL commands in the query window.
SELECT count(*) as TotalTweets
    , avg(SentimentScore) as AverageSentiment
INTO PBITweetStats
FROM MDWEventHubs TIMESTAMP BY CreatedAt
GROUP BY HoppingWindow(second,60,5)

SELECT CreatedAt
    , TweetText
    , SentimentScore
INTO PBITweetDetails
FROM MDWEventHubs TIMESTAMP BY CreatedAt
In this section you will log on to the Power BI portal to create a dashboard to visualize real-time Tweeter statistics data sent by Stream Analytics.
| IMPORTANT |
|---|
| Execute these steps on your host computer |
-
Open a new browser tab and navigate to https://www.powerbi.com
-
Enter your credentials to authenticate with the Power BI service.
-
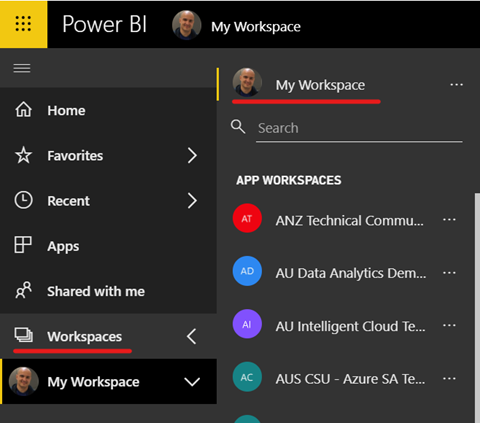
Once authenticated, open the Workspaces menu and click My Workspace at the top of the Workspaces list.
-
Navigate to the Datasets tab and verify that two datasets have been created by Stream Analytics: NYCTweetDetails and NYCTweetStats.
-
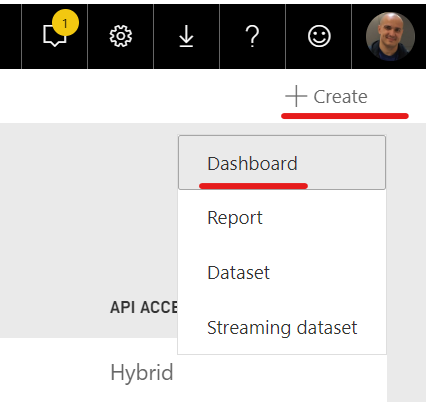
On the top right-hand side corner click + Create and then click Dashboard from the dropdown menu to create a new dashboard.
-
Type “NYC Tweet Stats” in the Dashboard name field and click Create.
-
Click + Add tile button on the toolbar.
-
On the Add tile blade, select Custom Streaming Data under the Real-Time Data section.
-
Click Next.
-
On the Add a custom streaming data tile blade, select the NYCTweetStats dataset.
-
Click Next.
-
On the Visualization Type field select Card.
-
On the Fields field select totaltweets.
-
Click Next.
-
On the Tile details blade, enter the following details:
- Title: Total Tweets
- Subtitle: in the last minute. -
Leave remaining fields with their default values.
-
Click Apply.
-
Repeat the process to create another tile, this time to display the average sentiment score. Use the following details:
- Dataset: NYCTweetStats
- Visualization Type: Card
- Fields: averagesentiment
- Data Label > Value decimal places: 3
- Details > Display Title and Subtitle: Checked
- Details > Title: Average Sentiment Score
- Details > Subtitle: in the last minute -
You should be able to see the values for both tiles changing every few seconds.
-
Try logging on to Tweeter and posting different messages with the hashtag #NYC. Go back to your Power BI dashboard and see the effect your messages had on the average sentiment score.
In this section you will log on to the Power BI portal to create a dashboard to visualize real-time Tweeter details data sent by Stream Analytics.
| IMPORTANT |
|---|
| Execute these steps on your host computer |
-
On the Power BI portal navigate to My Workspace and click on the Datasets tab again.
-
Click on the Create Report icon under Actions for the NYCTweetDetails dataset.
-
On the report canvas add a Table visual and add the following dataset fields to the Values property:
- createdat
- tweettext
- sentimentscore -
Change the default aggregation function for sentimentscore to Average.
-
On the report canvas add a Line chart visual and add the following dataset fields:
- Axis: createdat
- Values: sentimentscore -
Change the default aggregation function for sentimentscore to Average.
-
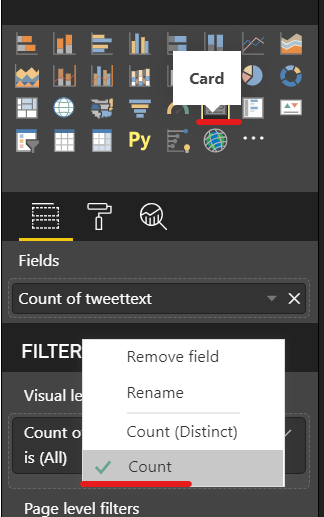
On the report canvas add a Card visual and add the following dataset fields to its Fields property:
- tweettext -
Change the default aggregation function for tweettext to Count.
-
On the report canvas add a Card visual and add the following dataset fields to its Fields property:
- sentimentscore -
Change the default aggregation function for sentimentscore to Average.
-
Place your visuals in a way you can see all of them.
-
Click the Save button on the toolbar to save your report.
-
Type “NYC Tweet Details” in the Report name field.


