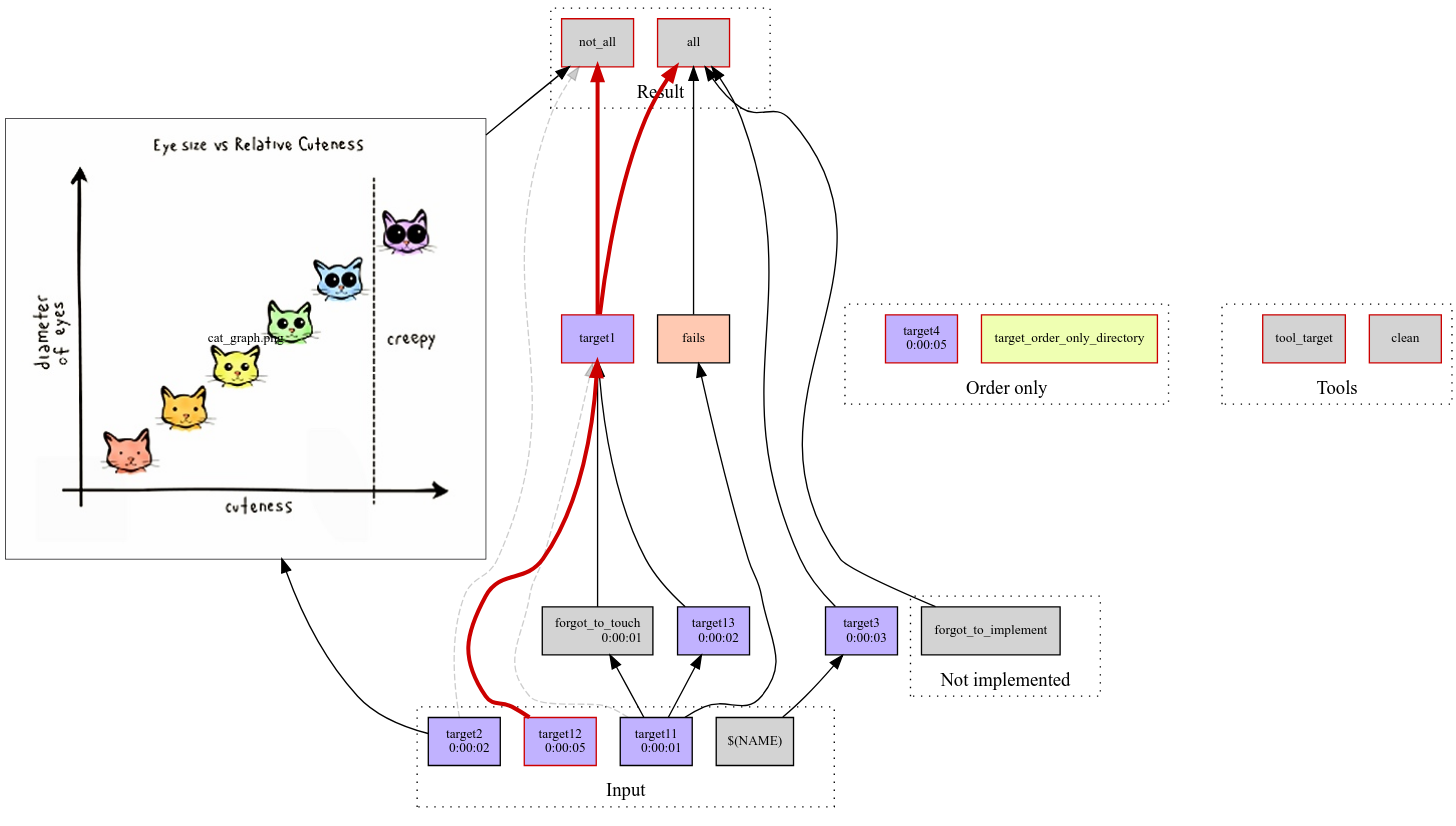
Helps managing a large data processing pipeline written in Makefile.
- SVG build overview (example: https://github.com/gojuno/make-profiler/blob/master/make.svg);
-
Critical Path is highlighted;
-
Inline pictures-targets into build overview;
-
Logs for each target marked with timestamps;
-
Distinguish a failed target execution from forgotten touch;
-
Navigate to last run's logs from each target directly from call graph;
-
Support for self-documented Makefiles according to http://marmelab.com/blog/2016/02/29/auto-documented-makefile.html
sudo apt install python3-pip graphviz gawk
sudo pip3 install https://github.com/gojuno/make-profiler/archive/master.zip

cd your_project
profile_make -h                 # have a look at help

profile_make                    # generate overview graph without profiling data
xdg-open make.svg               # have a look at call graph

profile_make_clean target_to_remove_with_children

profile_make -j -k target_name  # run some target, record execution times and logs
xdg-open make.svg               # have a look at call graph with timing data
