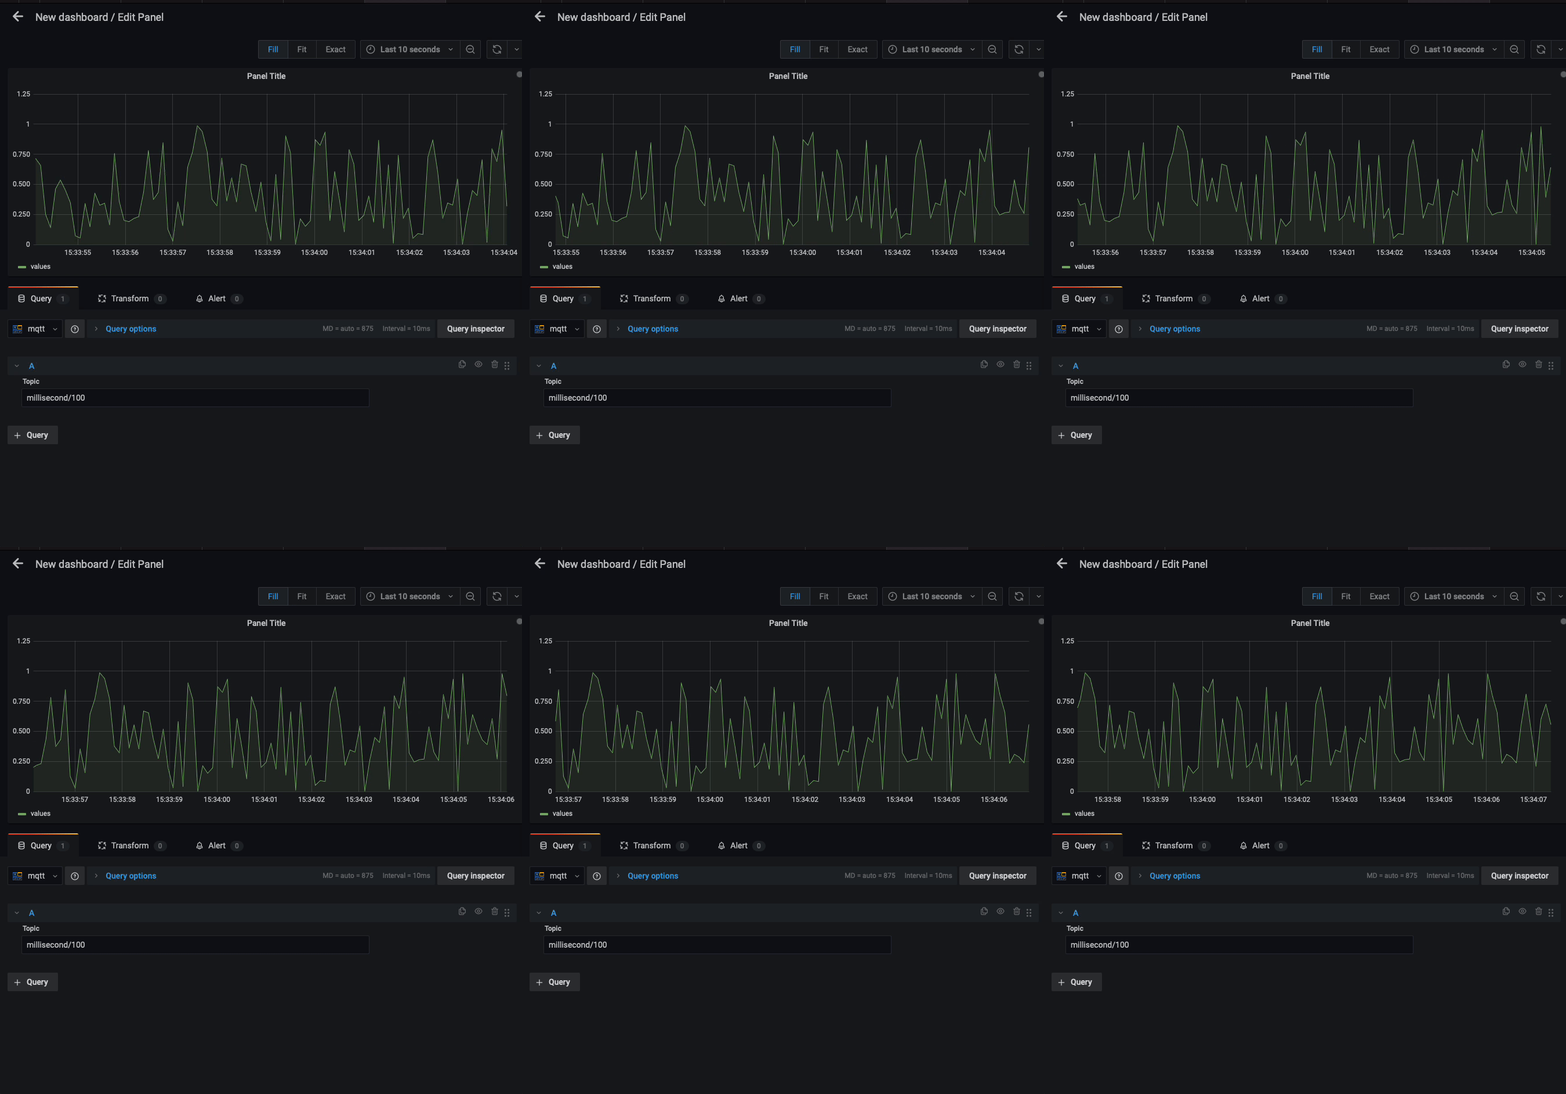
The MQTT data source plugin allows you to visualize streaming MQTT data from within Grafana.
This datasource is under active development, all feedback and help is encouraged!
The MQTT data source has the following requirements:
- Grafana user with a server or organization administration role; refer to Permissions.
- Access to a MQTT broker.
- The plugin currently does not support all of the MQTT CONNECT packet options.
- The plugin currently does not support TLS.
- Including multiple topics in a panel is not yet well supported.
- This plugin automatically supports topics publishing json formatted messages.
Refer to: Building a Backend Datasource Plugin
- Clone the plugin to your Grafana plugins directory.
- Build the plugin by running
yarn installand thenyarn build. - Run
mage reloadPluginor restart Grafana for the plugin to load.
This plugin currently supports MQTT v3.1.x.
- In Grafana from the left-hand menu, navigate to Configuration > Data sources.
- From the top-right corner, click the Add data source button.
- Search for
MQTTin the search field, and hover over the MQTT search result. - Click the Select button for MQTT.
Add a data source by filling in the following fields:
| Field | Description |
|---|---|
| Name | A name for this particular AppDynamics data source |
| Host | The hostname or IP of the MQTT Broker |
| Port | The port used by the MQTT Broker (default 1883) |
| Field | Description |
|---|---|
| Username | (Optional) The username to use when connecting to the MQTT broker |
| Password | (Optional) The password to use when connecting to the MQTT broker |
The query editor allows you to specify which MQTT topics the panel will subscribe to. Refer to the MQTT v3.1.1 specification for more information about valid topic names and filters.
