To download STMViewer installer please proceed to the releases page.
STMViewer is an open-source GUI debug tool for STM32 microcontrollers that consists of two modules:
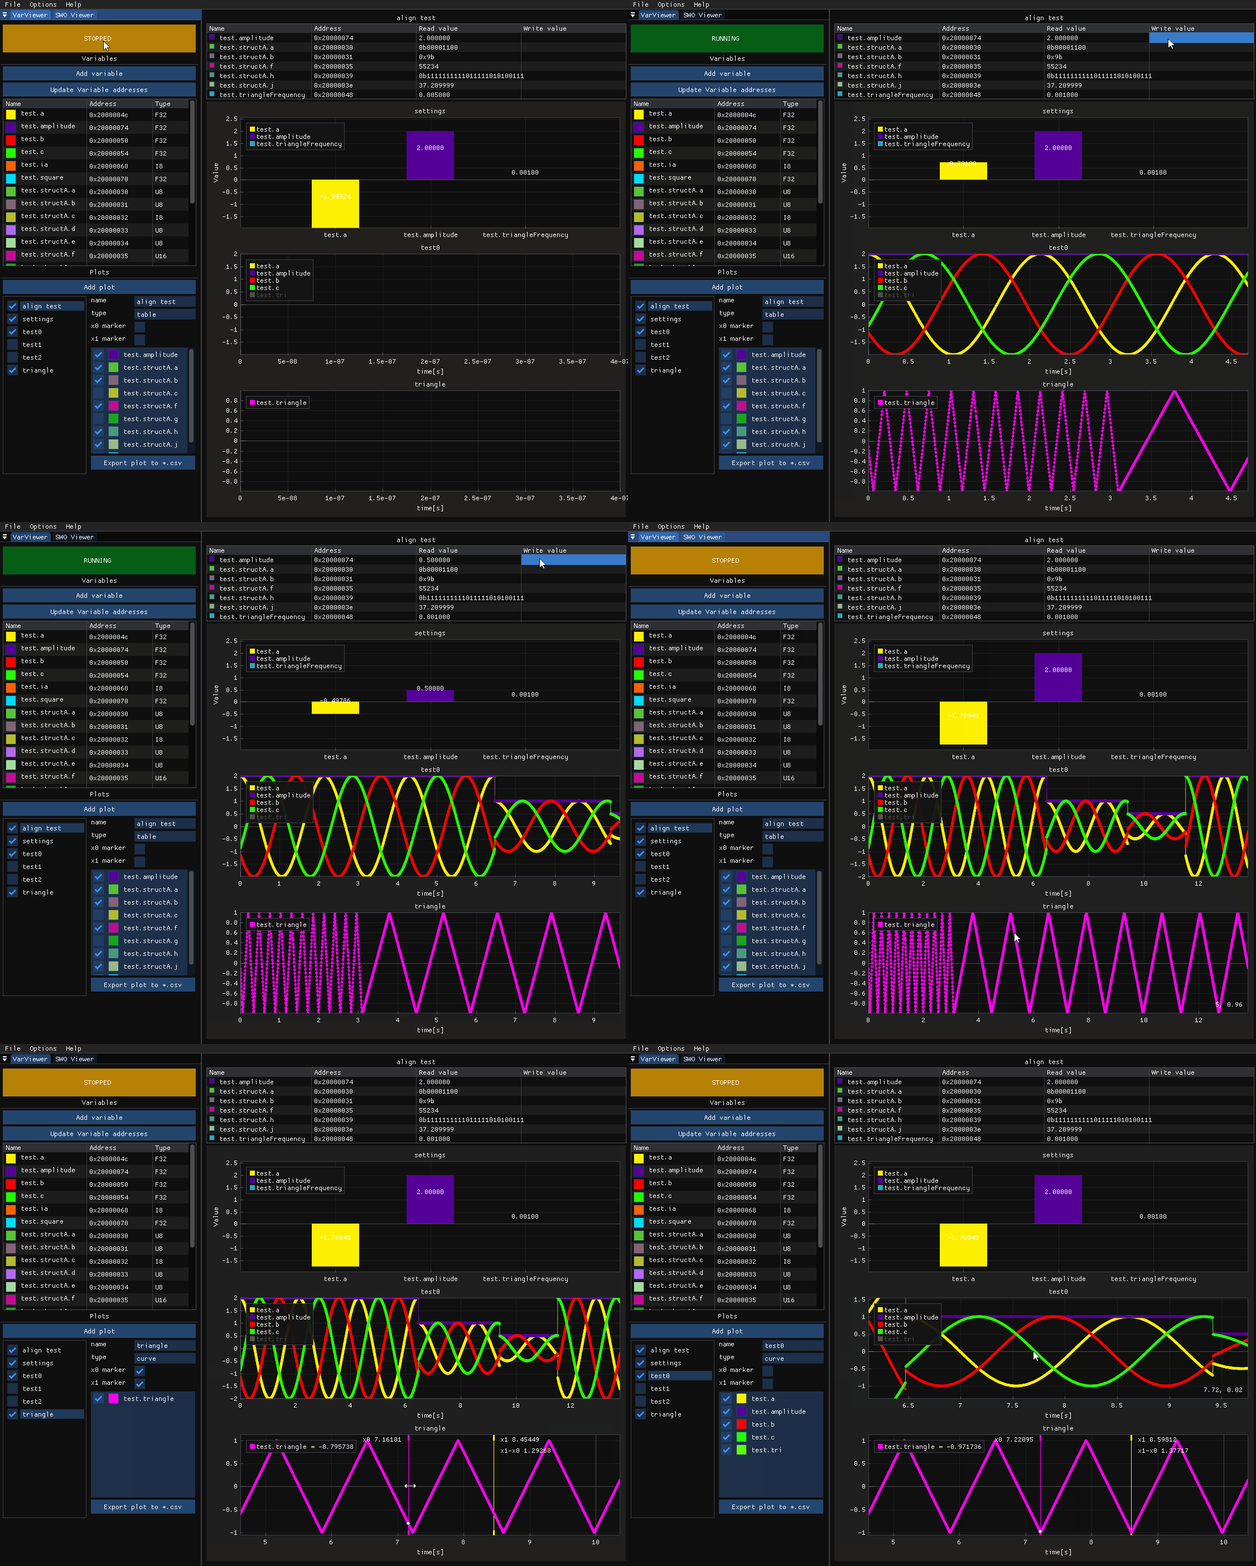
- Variable Viewer - used for viewing, logging, and manipulating variables data in realtime using debug interface (SWDIO / SWCLK / GND)
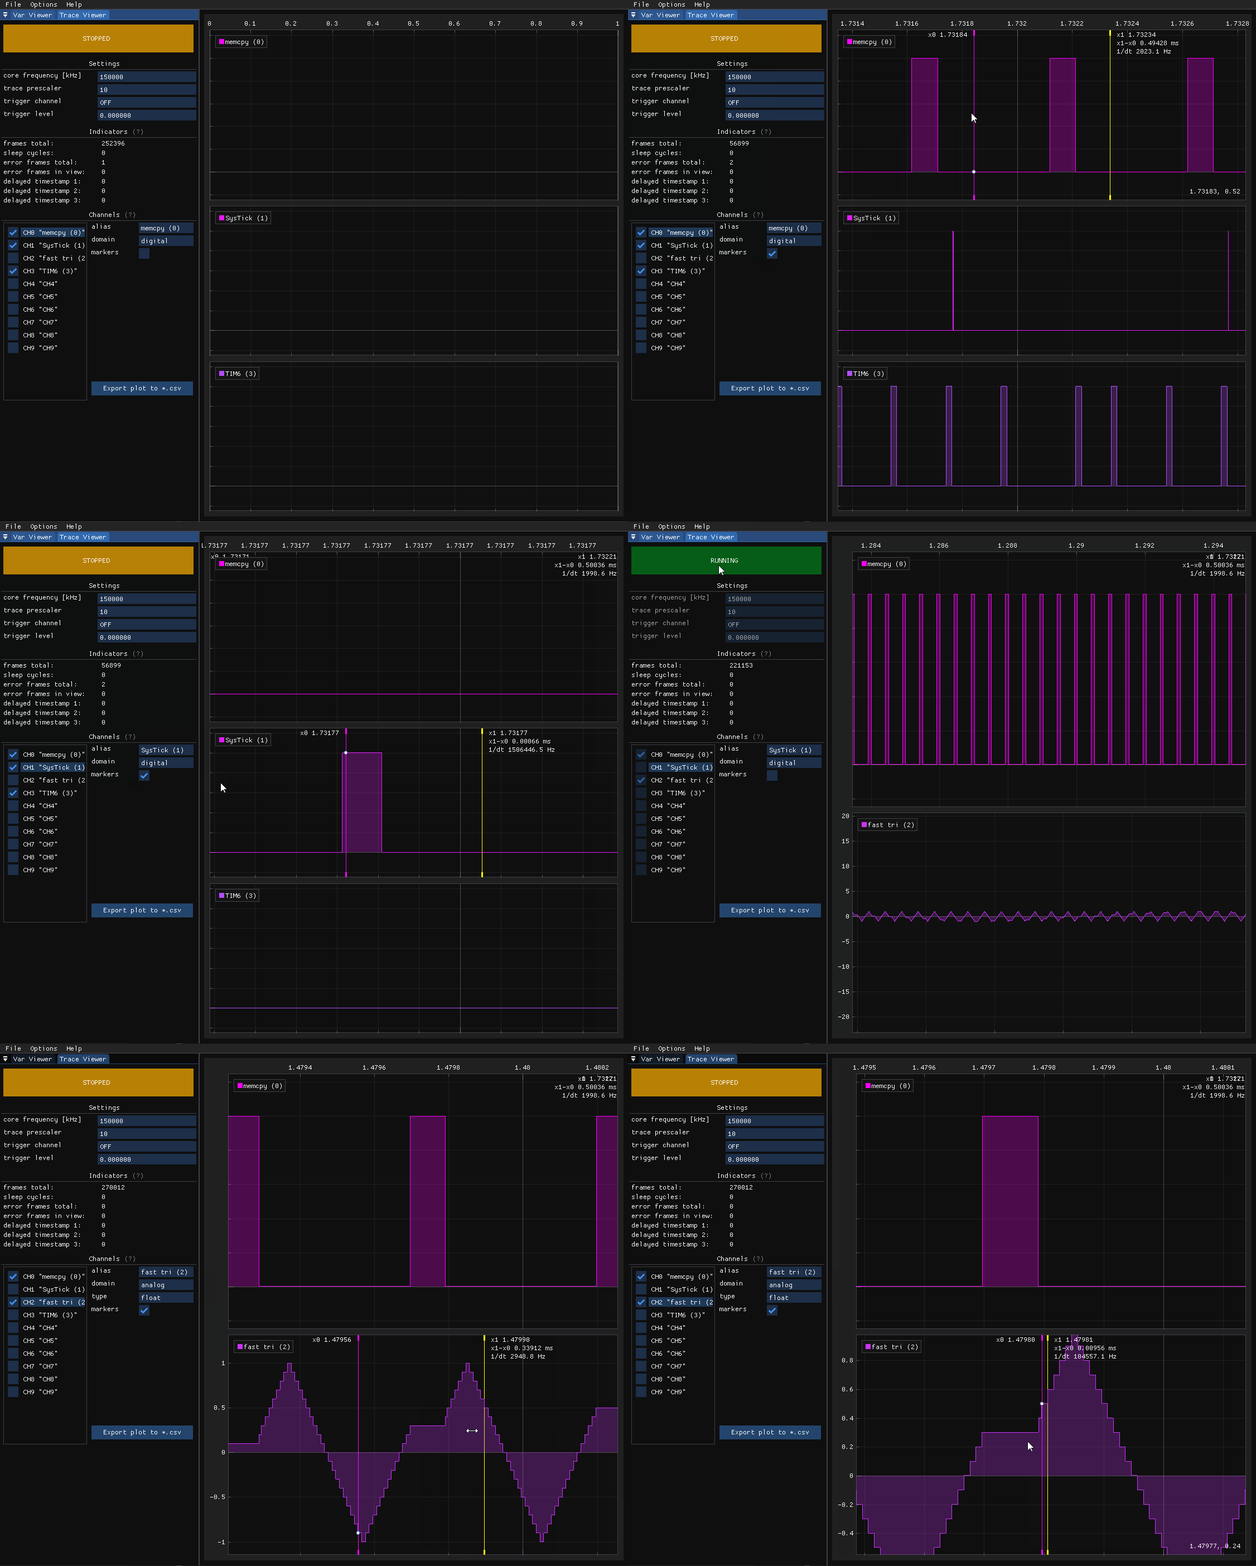
- Trace Viewer - used for graphically representing real-time SWO trace output (SWDIO / SWCLK / SWO / GND)
The only piece of hardware required is an STLink or JLink programmer.
Variable Viewer can be used to visualize your embedded application data in real time with no overhead in a non-intrusive way. The software works by reading variables' values directly from RAM using probe's debug interface. Addresses are read from the *.elf file which is created when you build your embedded project. This approach's main downside is that the object's address must stay constant throughout the whole program's lifetime, which means the object has to be global. Even though it seems to be a small price to pay in comparison to running some debug protocol over for example UART which is also not free in terms of intrusiveness.
Variable Viewer is a great tool for debugging, but might be not enough for some high frequency signals - in such cases check out the Trace Viewer below.
Trace Viewer is a new module that lets you visualize SWO trace data. It can serve multiple purposes such as profiling a function execution time, confirming the timer's interrupt frequency, or displaying very high frequency signals. All this is possible thanks to hardware trace peripherals embedded into Cortex M3/M4/M7/M33 cores. For prerequisites and usage please see the Quick Start section.
TraceViewer is not influenced by optimizations, which means it is a great tool to use for profiling on release builds. Moreover it has a very low influence on the program execution as each datapoint is a single register write.
Note: currently only STLink debug probe is supported. JLink support is in progress.
- First make sure you've got GDB installed and that it's at least 12.1.
- Download the *.deb package and install it using:
sudo apt install ./STMViewer-x.y.z-Linux.debAll dependencies should be installed and you should be ready to go.
Stlink users:
- in case your STLink is not detected, please copy the
/launch/udevrules/folder contents to your/etc/udev/rules.d/directory.
- Download and run the STMViewer installer from the releases page (right hand side menu of the main repo page).
Stlink users:
- make sure the STLink is in "STM32 Debug + Mass Storage + VCP" mode as for some reason "STM32 Debug + VCP" throws libusb errors on Windows. This needs further investigation.
You can assign the external GPU to STMViewer for improved performance.
- Open
Options -> AcqusitionSettings window in the top menu. - Select your project's elf file. Make sure the project is compiled in debug mode. Click done.
- Click the
Import variables form *.elf. Select variables and clickImport. Note: the import feature is still in beta. If your variable is not automatically detected just clickAdd variableand input the name yourself. Please let me know if that happens by opening a new issue with *.elf file attached. - After adding all variables click
Update variable addresses. The type and address of the variables you've added should change from "NOT FOUND!" to a valid address based on the *.elf file you've provided. Note: 64-bit variables (such as uint64_t and double) are not yet supported #13. - Drag and drop the variable to the plot area.``
- Make sure the debug probe is connected and a proper type is selected (STLink/JLink). Download your executable to the microcontroller and press the
STOPPEDbutton.
In case of any problems, please try the example/STMViewer_test CubeIDE project and the corresponding STMViewer_test.cfg project file. Please remember to build the project and update the elf file path in the Options -> Acqusition Settings.
- Turn on the SWO pin functionality - in CubeMX System Core -> SYS Mode and Configuration -> choose Trace Asynchronous Sw
- Place enter and exit markers in the code you'd like to profile. Example for digital data:
ITM->PORT[x].u8 = 0xaa; //enter tag 0xaa - plot state high
foo();
ITM->PORT[x].u8 = 0xbb; //exit tag 0xbb - plot state low
And for tracing "analog" signals you can use:
float a = sin(10.0f * i);          // some high frequency signal to trace
ITM->PORT[x].u32 = *(uint32_t*)&a; // type-punn to desired size: sizeof(float) = sizeof(uint32_t)
or
uint16_t a = getAdcSample();       // some high frequency signal to trace
ITM->PORT[x].u16 = a;
The ITM registers are defined in CMSIS headers (core_xxxx.h).
- Compile and download the program to your STM32 target.
- In the
Settingswindow type in the correct System Core Clock value in kHz (very important as it affects the timebase) - Try different trace prescallers that result in a trace speed lower than the max trace speed of your programmer (for example STLINK V2 can read trace up to 2Mhz, whereas ST-Link V3 is theoretically able to do 24Mhz). Example:
- System Core Clock is 160 000 kHz (160 Mhz)
- We're using ST-link V2 so the prescaler should be at least 160 Mhz / 2 Mhz = 80
- Configure
analogchannels types according to the type used in your code. - Press the
STOPPEDbutton to start recording.
Example project with STMViewer config file is located in test/STMViewer_test directory.
FAQ and common issues:
-
Problem: My trace doesn't look like it's supposed to and I get a lot of error frames Answer: Try lowering the trace prescaller and check the SWO pin connection - the SWO pin output is high frequency and it shouldn't be too long.
-
Problem: My trace looks like it's supposed to but I get the "delayed timestamp 3" indicator Answer: Try logging fewer channels simultaneously. It could be that you've saturated the SWO pin bandwidth.
-
Problem: My trace looks like it's supposed to but I get the "delayed timestamp 1" indicator Answer: This is not a critical error, however, you should be cautious as some of the trace frames may be delayed. To fix try logging fewer channels simultaneously.
STMViewer is build like any other CMake project:
If you're a Linux user be sure to install:
- libusb-1.0-0-dev
- libglfw3-dev
- libgtk-3-dev
After a successful build, copy the ./third_party/stlink/chips directory to where the binary is located. Otherwise the STlink will not detect your STM32 target.
- Install MSYS2
- In the MinGW console run
pacman -Syu - Install the following packages
pacman -S base-devel mingw-w64-ucrt-x86_64-toolchain mingw-w64-ucrt-x86_64-llvm mingw-w64-x86_64-lld - Make sure you've added minGW folder to the PATH (
C:\msys64\usr\bin) - In the main repo directory call
mkdir buildcd buildcmake .. -G"MinGW Makefilesmingw32-make.exe -j8
After a successful build, copy the ./third_party/stlink/chips directory to where the binary is located. Otherwise the STlink will not detect your STM32 target.
I'm working in the motor control industry where it is crucial to visualize some of the process data in real-time. Since the beginning, I have been working with STMStudio, which is, or rather was a great tool. Unfortunately, ST stopped supporting it which means there are some annoying bugs, and it doesn't work well with mangled c++ object names. Also, it works only on Windows which is a big downside. If you've ever used it you probably see how big of an inspiration it was for creating STMViewer :) ST's other project in this area - Cube Monitor - has, in my opinion, too much overhead on adding variables, plots and writing values. I think it's designed for creating dashboards, and thus it serves a very different purpose. On top of that, I think the plot manipulation is much worse compared to STMStudio or STMViewer.
Since the Trace Viewer module was added STMViewer has a unique property of displaying SWO trace data which both CubeMonitor and STMStudio currently lack. Moreover it now supports JLink programmer as well.

