The InfluxDB mixin is a set of configurable Grafana dashboards and alerts.
The InfluxDB mixin contains the following dashboards:
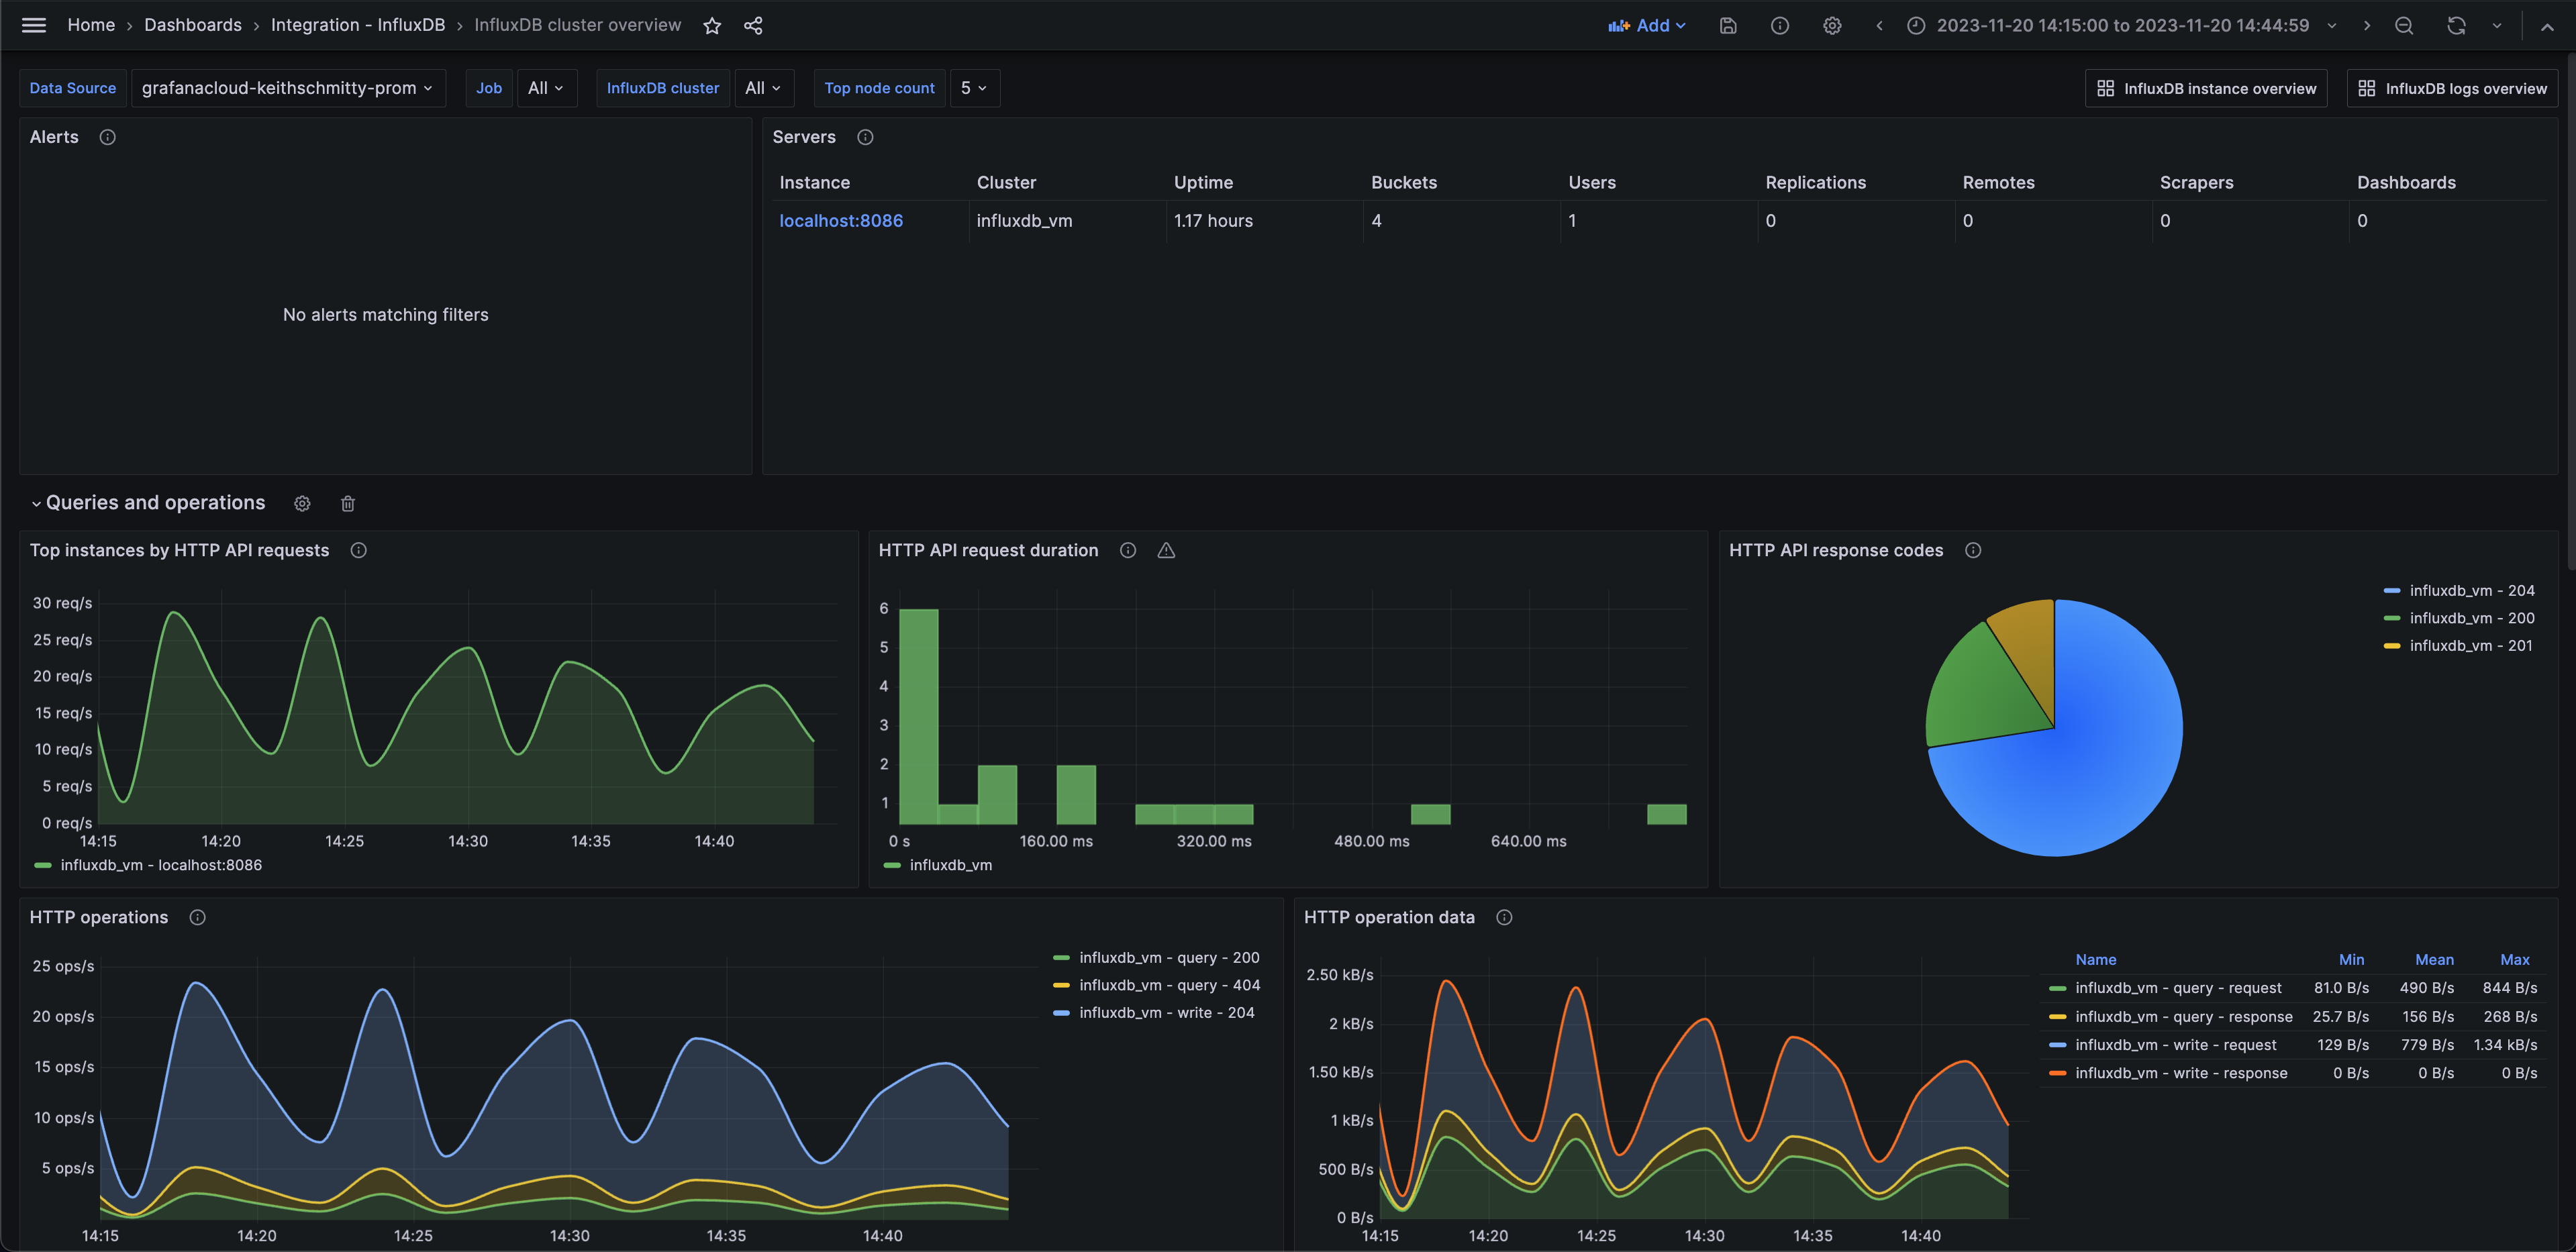
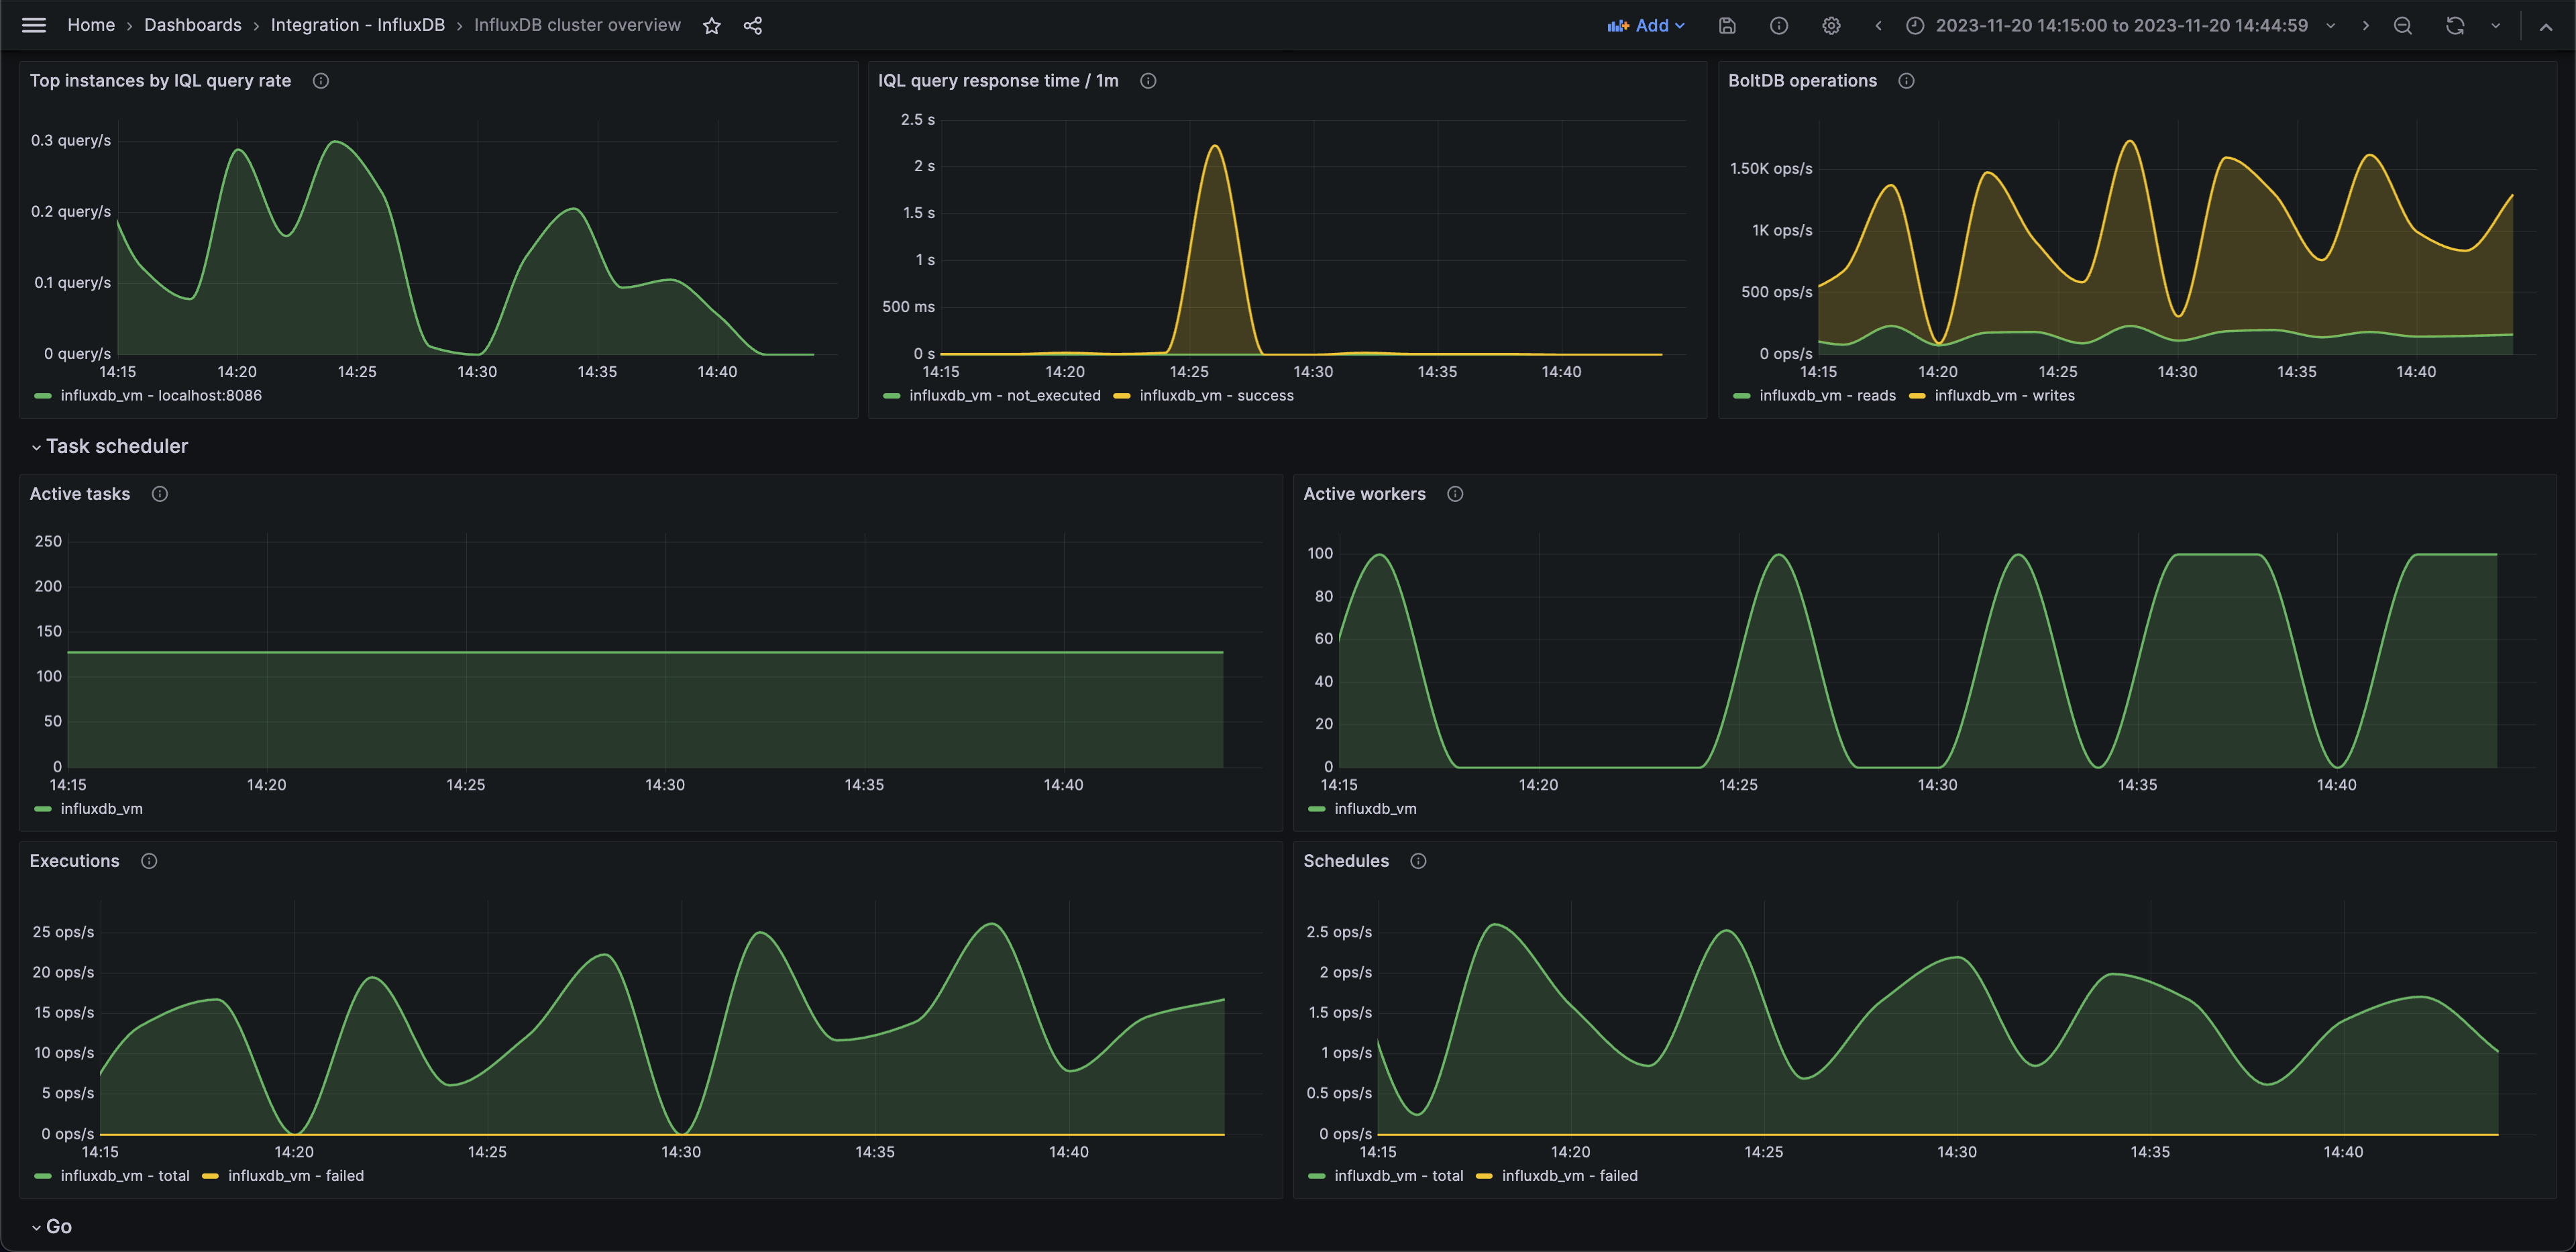
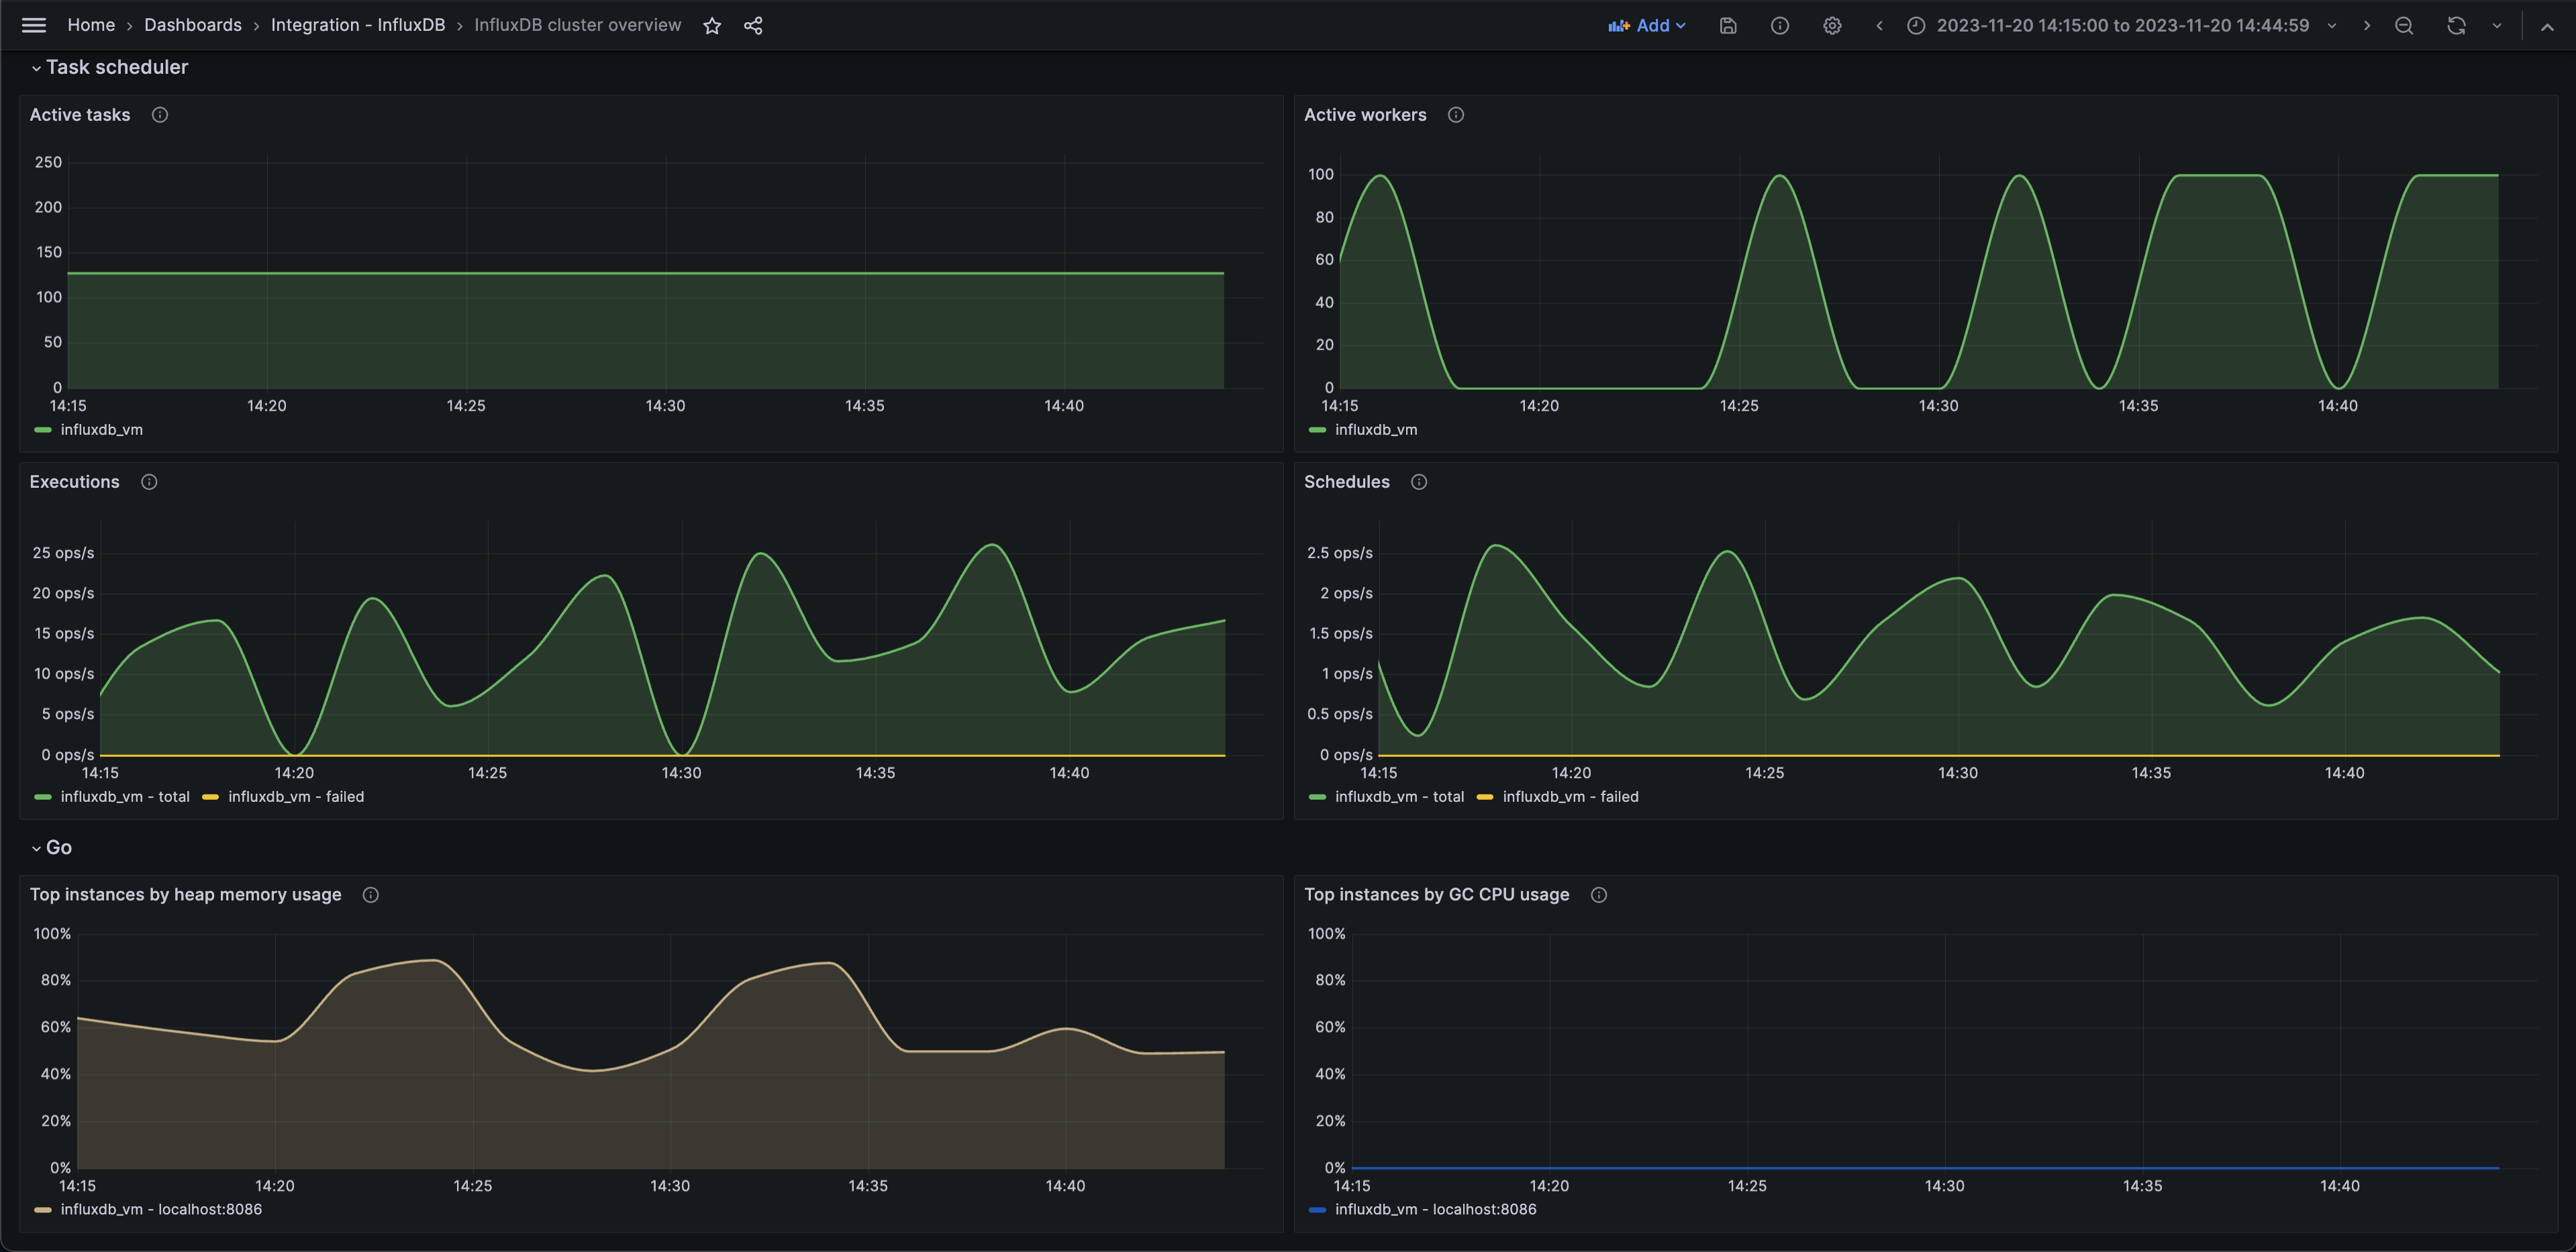
- InfluxDB cluster overview
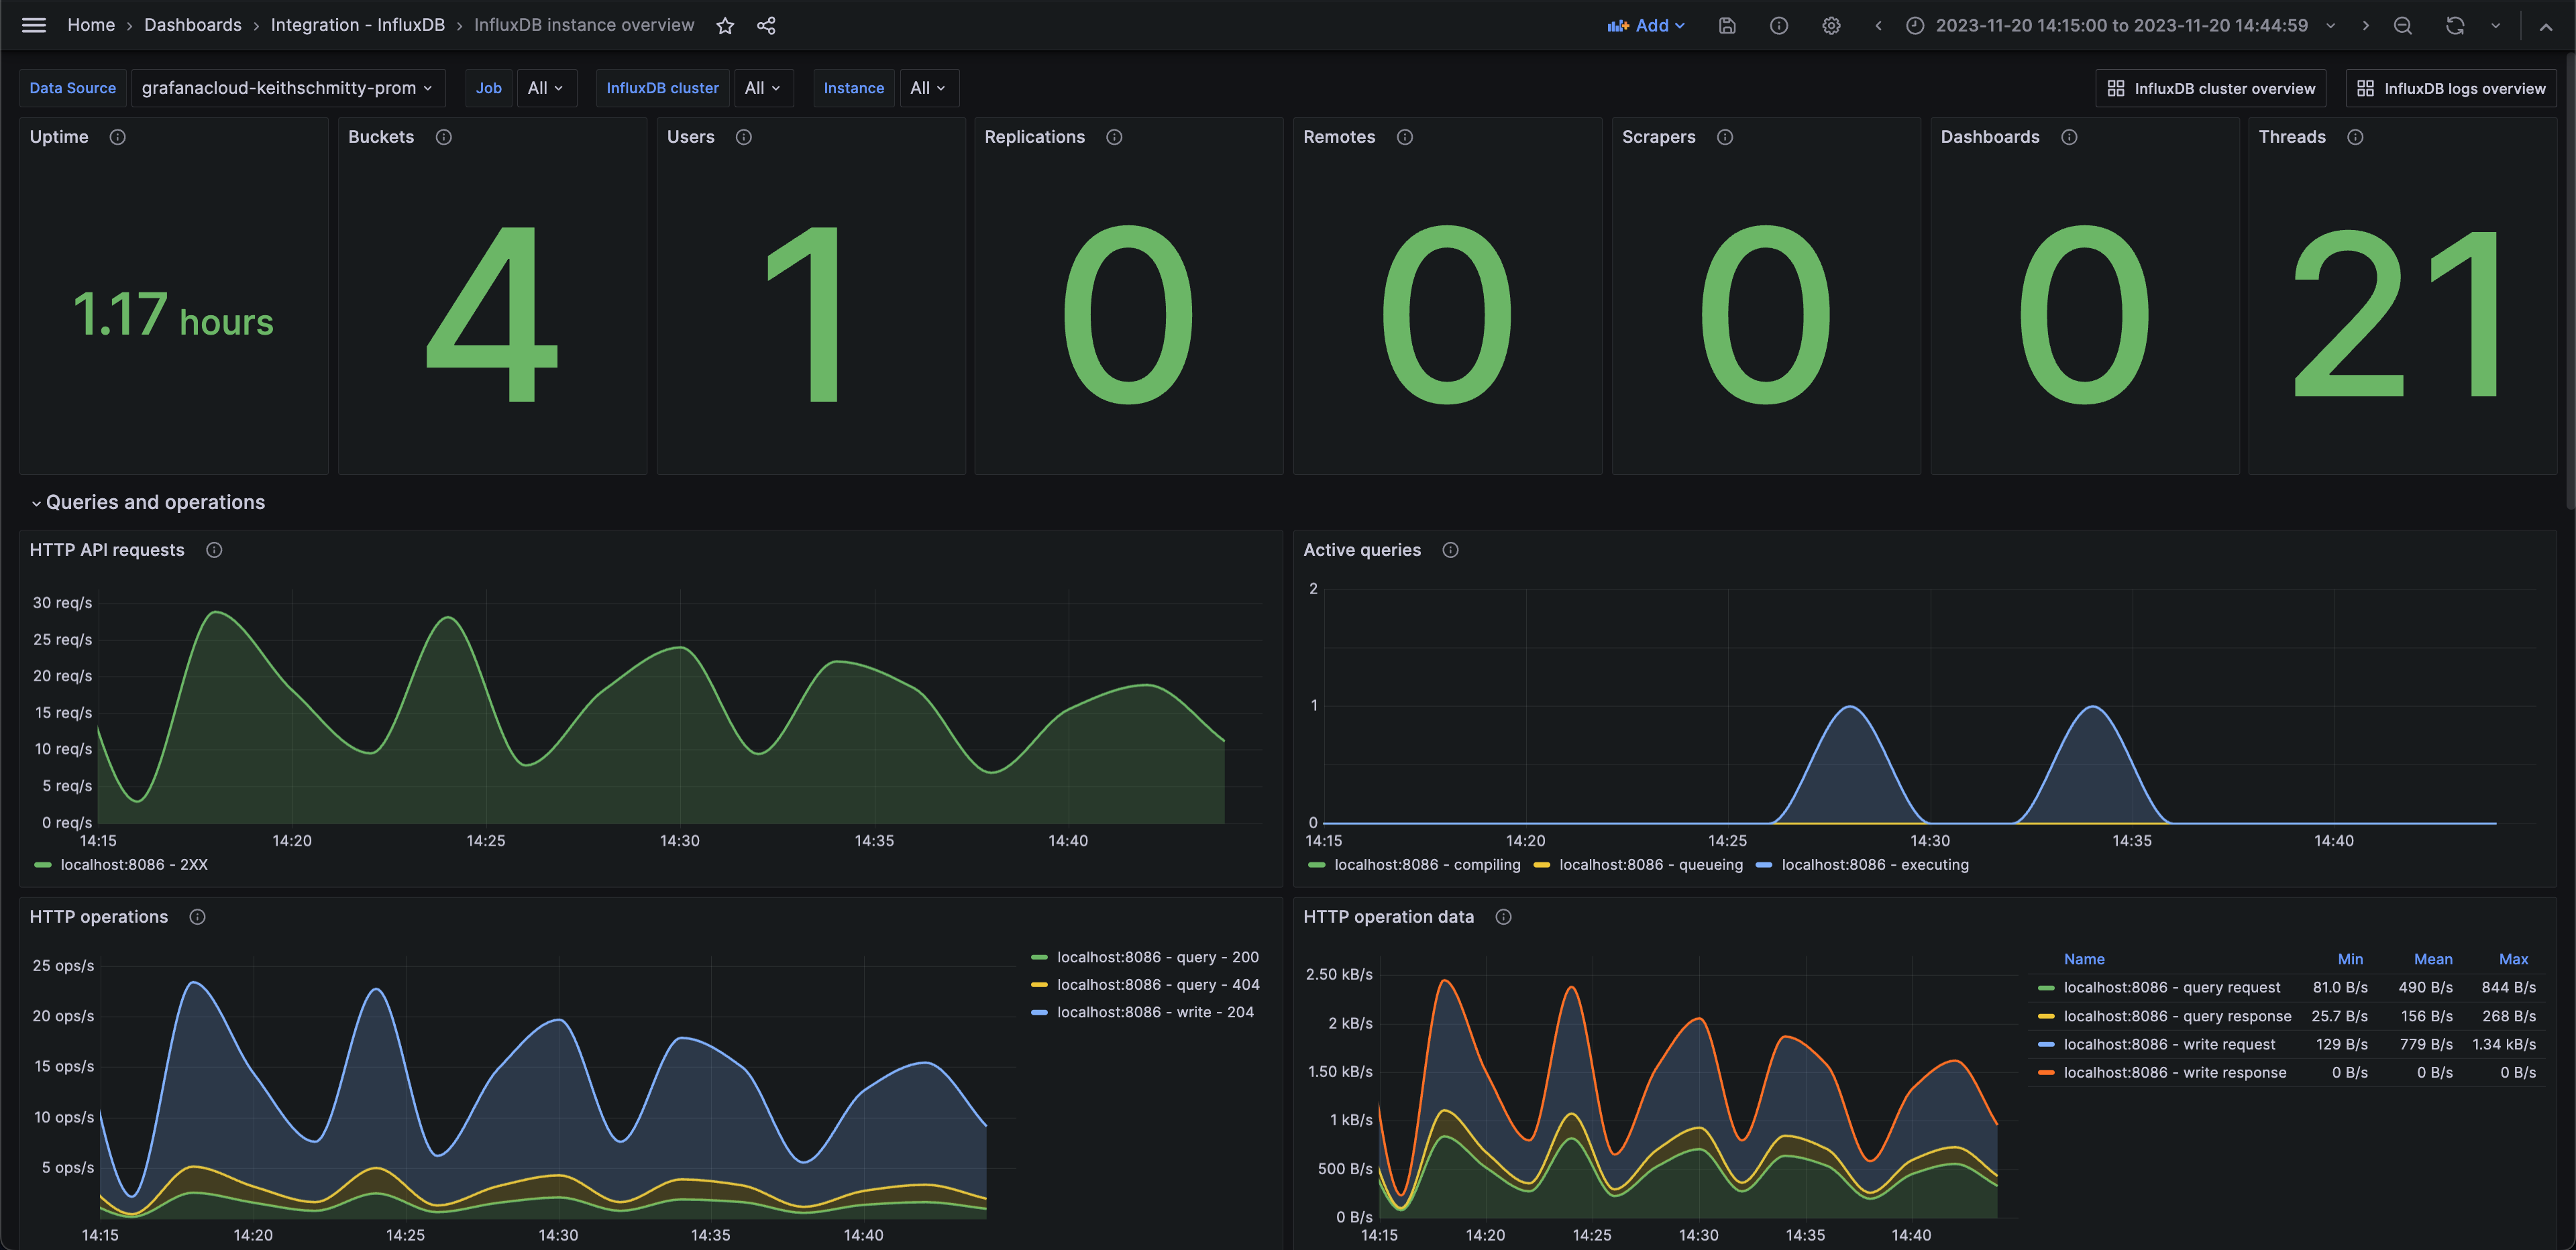
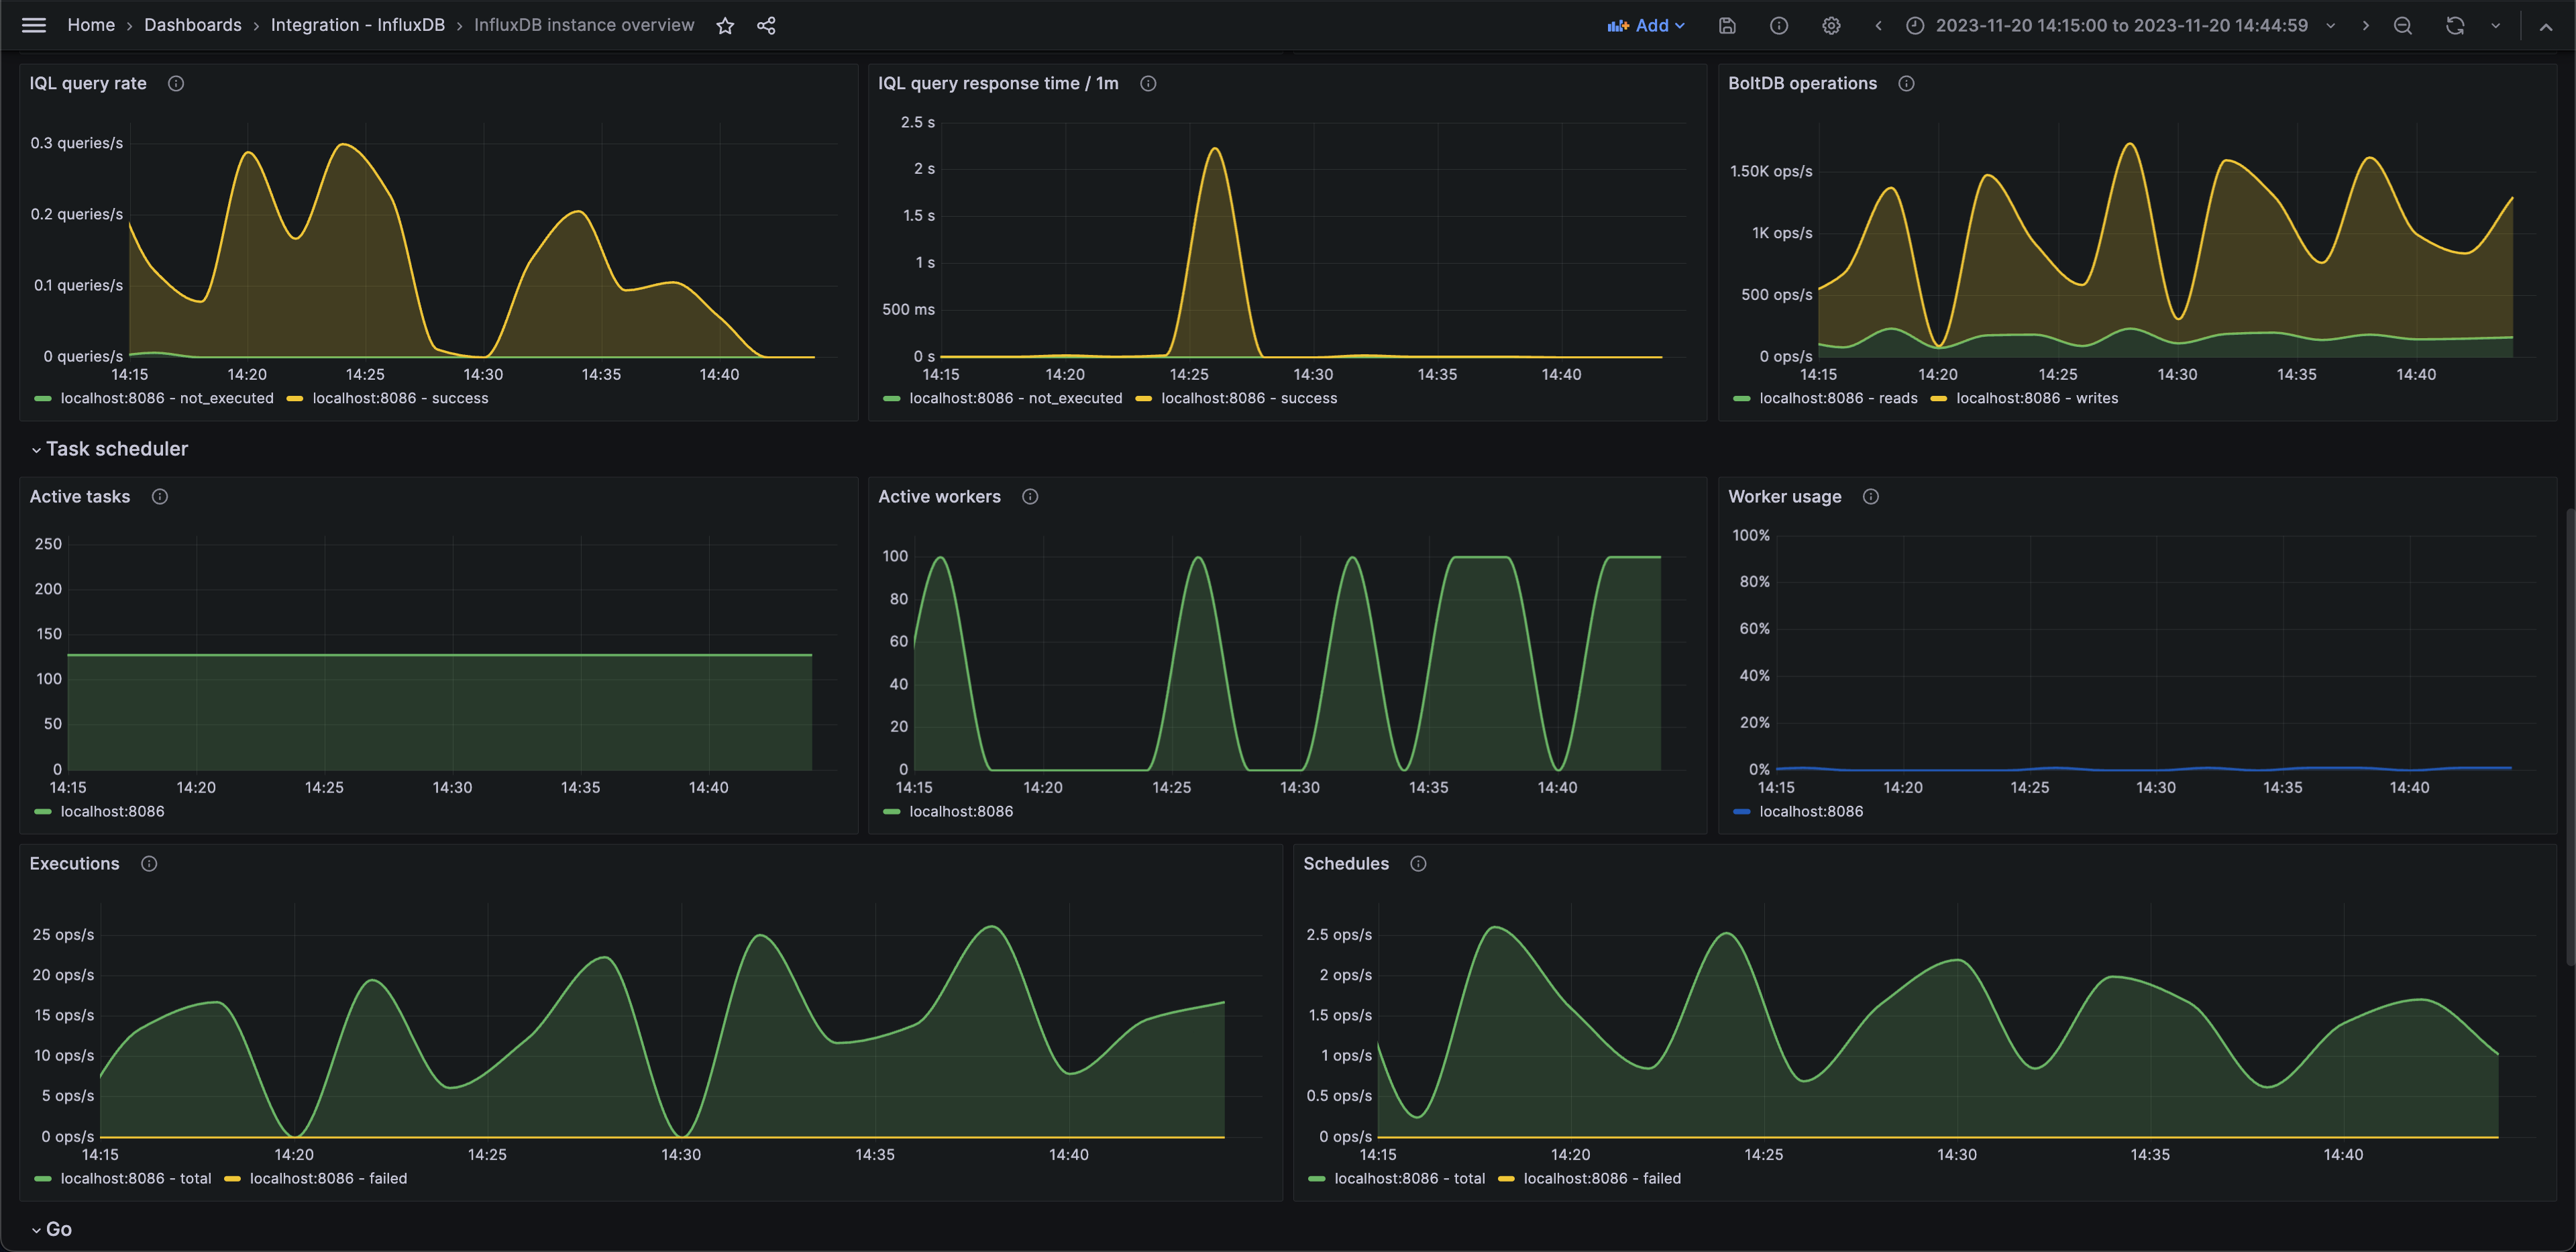
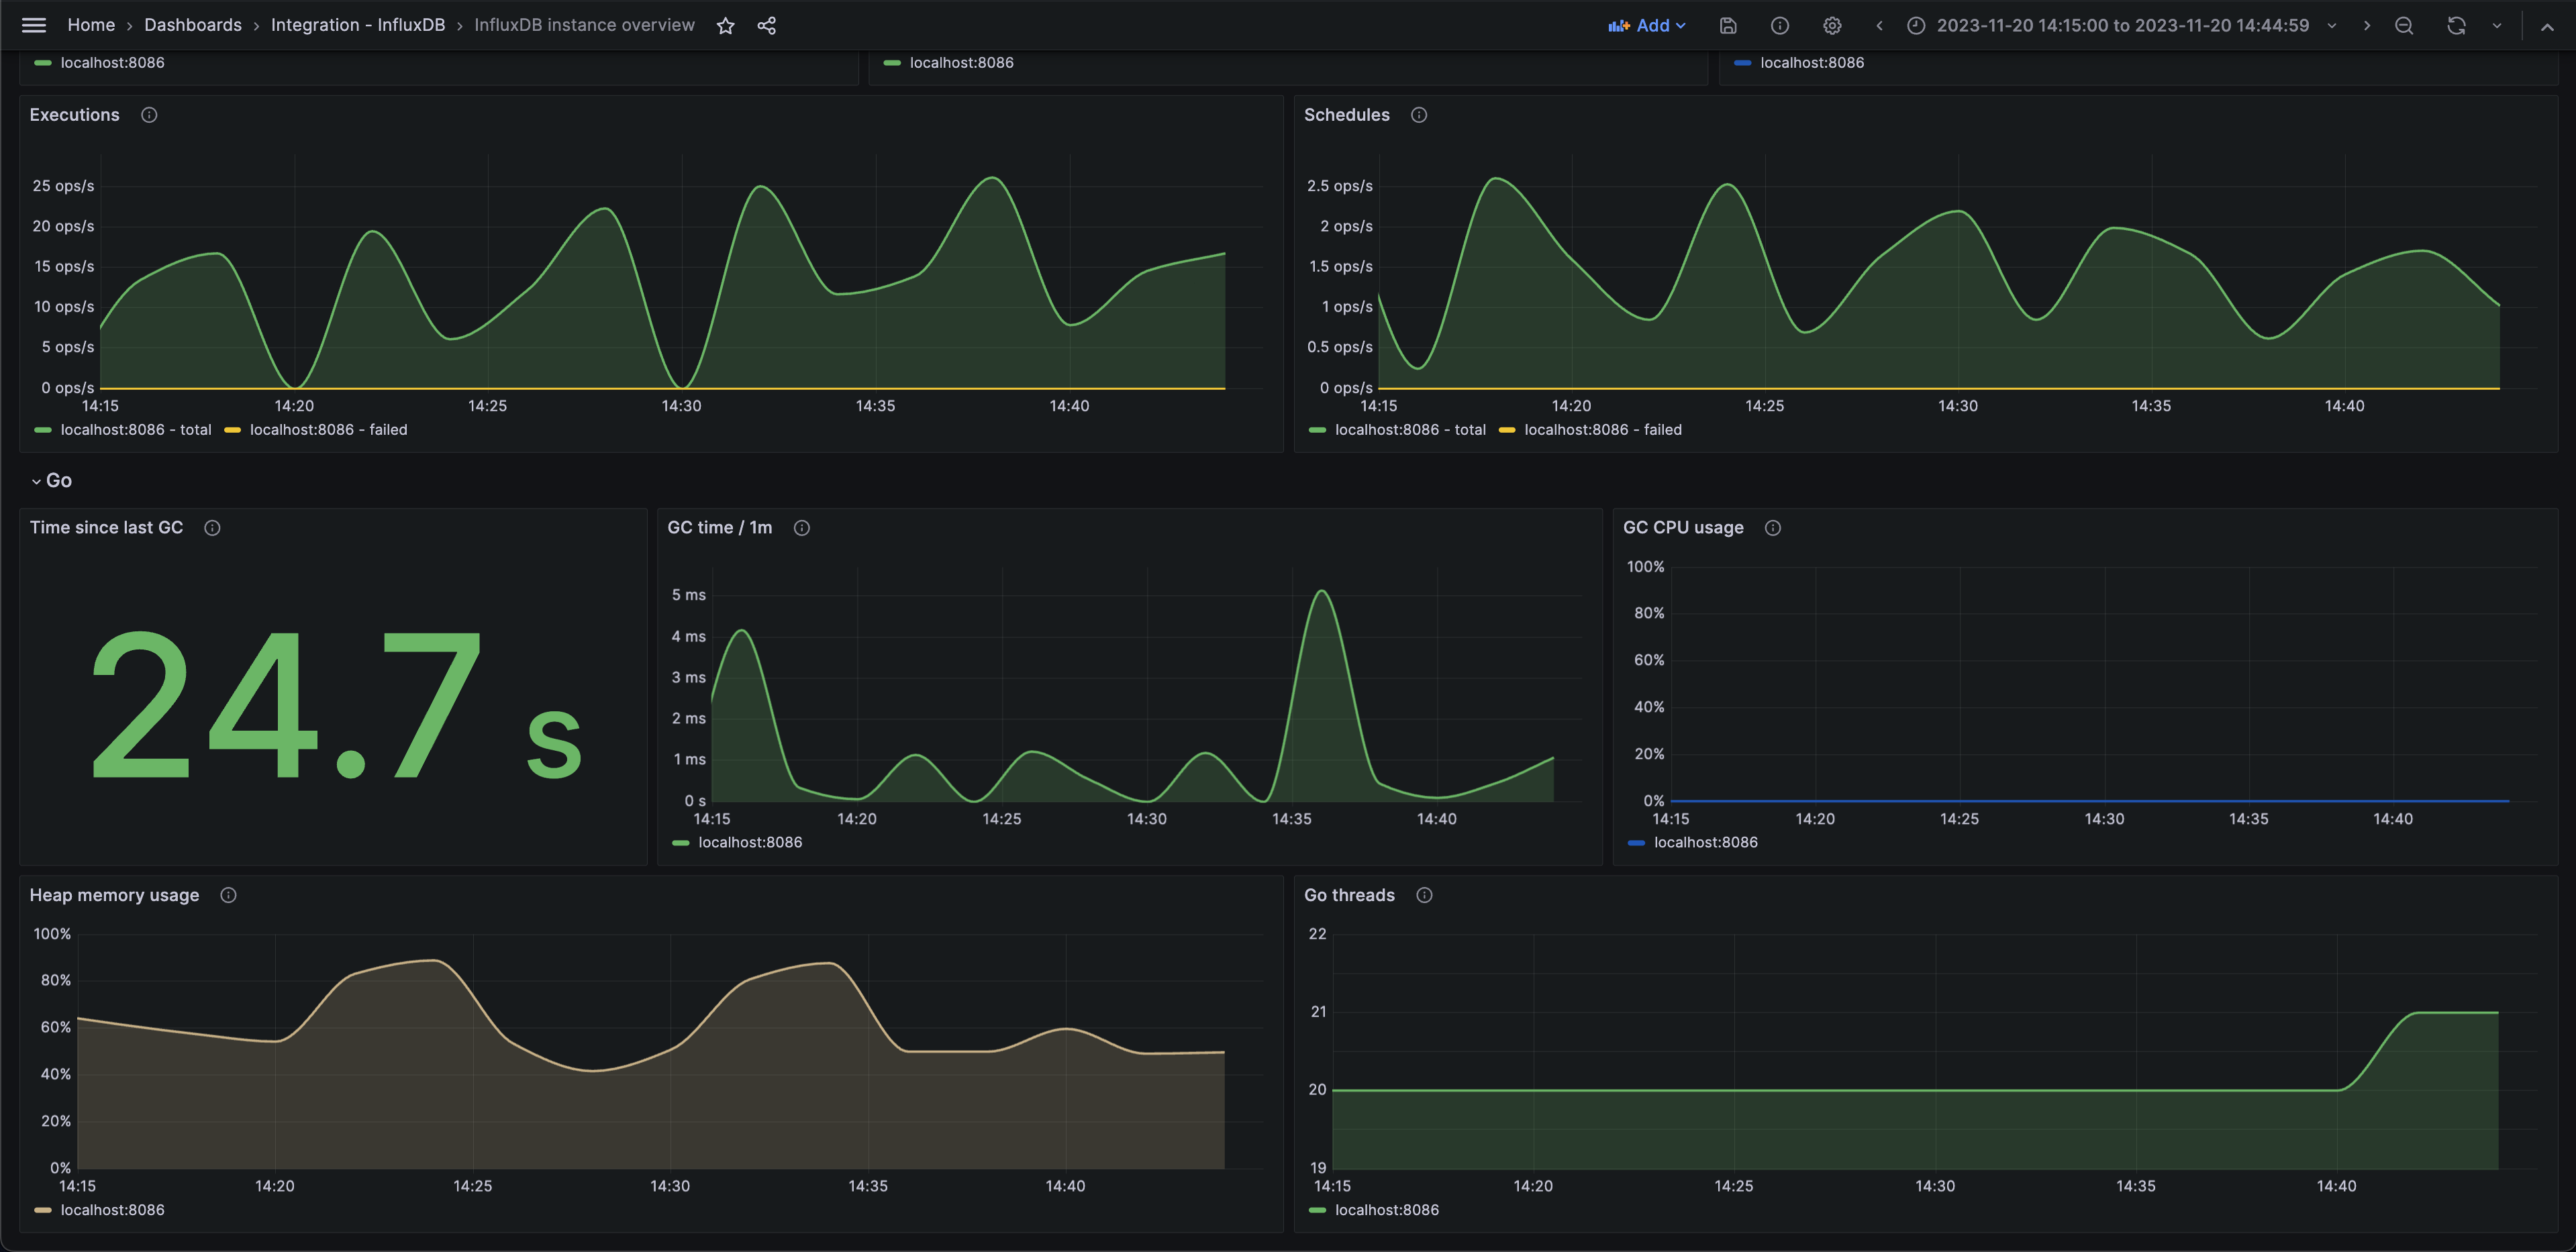
- InfluxDB instance overview
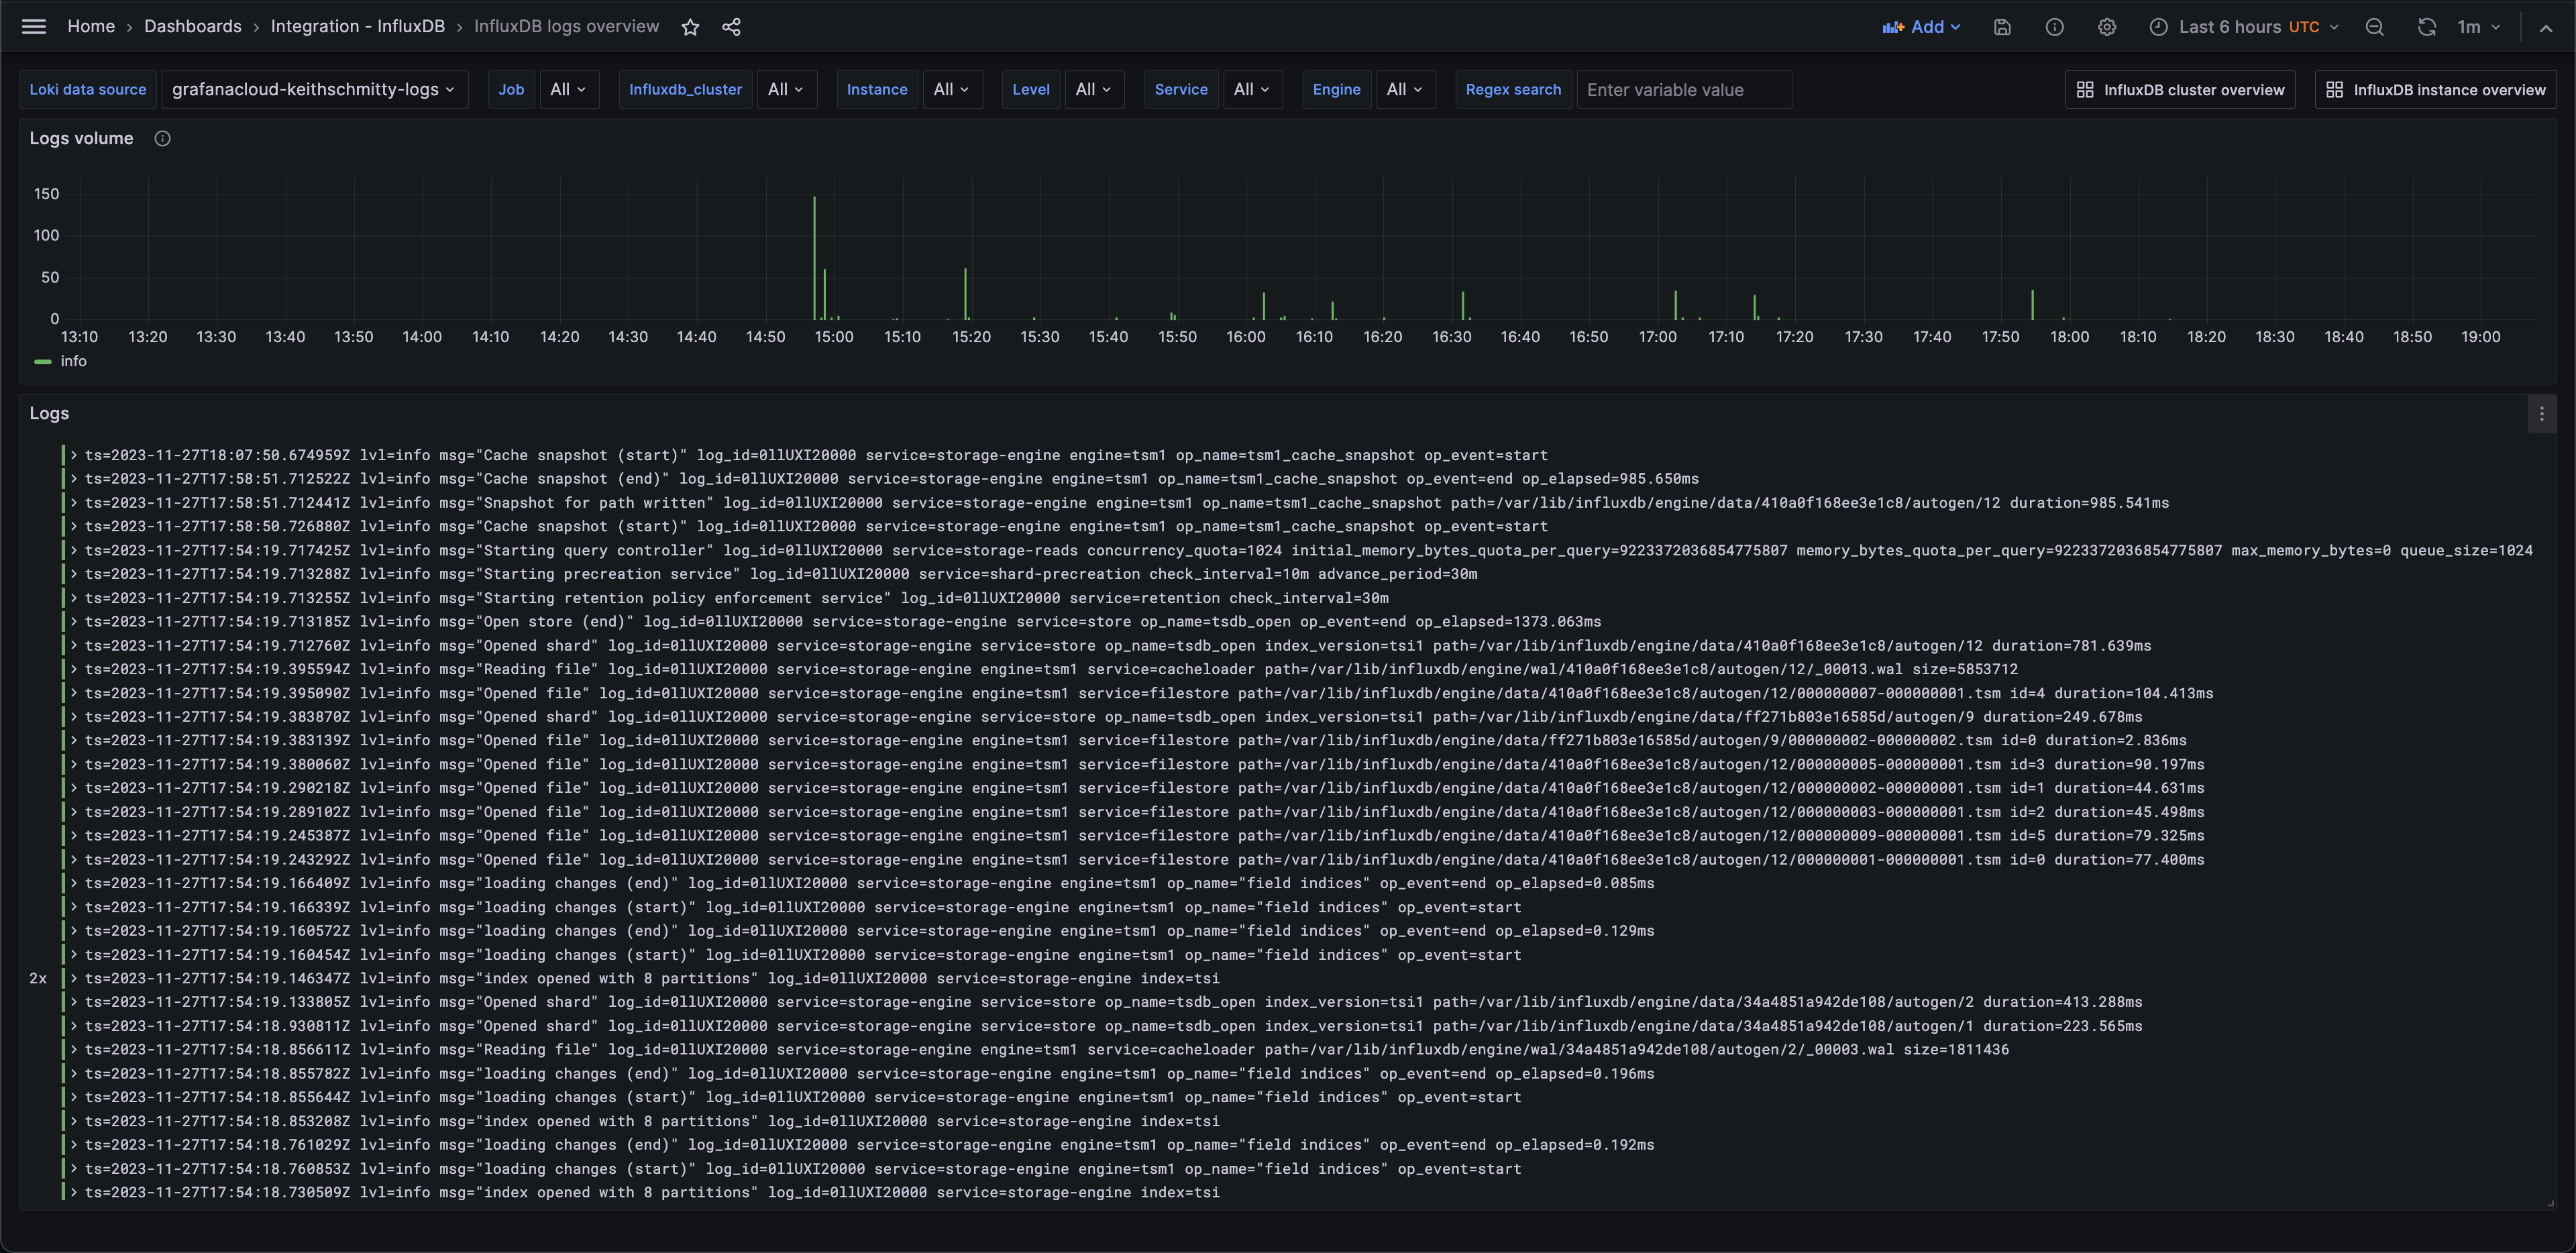
- InfluxDB logs overview
and the following alerts:
- InfluxDBWarningTaskSchedulerHighFailureRate
- InfluxDBCriticalTaskSchedulerHighFailureRate
- InfluxDBHighBusyWorkerPercentage
- InfluxDBHighHeapMemoryUsage
- InfluxDBHighAverageAPIRequestLatency
- InfluxDBSlowAverageIQLExecutionTime
The InfluxDB cluster overview dashboard provides details on the cluster's performance and highlights top instances. The dashboard covers all available aspects of InfluxDB performance and integration health, including Golang performance, query/request load, and task scheduler activity.
The InfluxDB instance overview dashboard provides details on one or more instances, including instance configuration stats, Golang performance, query/request load, and task scheduler activity.
The InfluxDB logs overview dashboard allows users to view incoming InfluxDB logs. The dashboard also allows users to filter logs based on level, service, engine, and custom regex.
InfluxDB system logs are enabled by default in the config.libsonnet and can be disabled by setting enableLokiLogs to false. Then run make again to regenerate the dashboard:
{
  _config+:: {
    enableLokiLogs: false,
  },
}
For the selectors to properly work for InfluxDB logs ingested into your logs datasource, please also include the matching instance, job, and influxdb_cluster labels in the scrape_configs to match the labels for ingested metrics.
scrape_configs:
  - job_name: integrations/influxdb
    static_configs:
      - targets: [localhost]
        labels:
          job: integrations/influxdb
          influxdb_cluster: "<your-cluster-name>"
          instance: "<your-instance-name>"
          __path__: /var/log/influxdb/influxdb.log
    pipeline_stages:
        - multiline:
            firstline: 'ts=\d{4}'
        - regex:
            expression: 'ts=(\S+) lvl=(?P<level>\w+) msg=.* log_id=(\S+) (service=(?P<service>\S+) ){0,1}(engine=(?P<engine>\S*) ){0,1}.*$'
        - labels:
            level:
            service:
engine:- InfluxDBWarningTaskSchedulerHighFailureRate: Automated data processing tasks are failing at a high rate.
- InfluxDBCriticalTaskSchedulerHighFailureRate: Automated data processing tasks are failing at a critical rate.
- InfluxDBHighBusyWorkerPercentage: There is a high percentage of busy workers.
- InfluxDBHighHeapMemoryUsage: There is a high amount of heap memory being used.
- InfluxDBHighAverageAPIRequestLatency: Average API request latency is too high. High latency will negatively affect system performance, degrading data availability and precision.
- InfluxDBSlowAverageIQLExecutionTime: InfluxQL execution times are too slow. Slow query execution times will negatively affect system performance, degrading data availability and precision.
Default thresholds can be configured in config.libsonnet.
{
  _config+:: {
    alertsWarningTaskSchedulerHighFailureRate: 25, // %
    alertsCriticalTaskSchedulerHighFailureRate: 50,  // %
    alertsWarningHighBusyWorkerPercentage: 80,  // %
    alertsWarningHighHeapMemoryUsage: 80,  // %
    alertsWarningHighAverageAPIRequestLatency: 0.1, // count
    alertsWarningSlowAverageIQLExecutionTime: 0.1, // count
  },
}go install github.com/jsonnet-bundler/jsonnet-bundler/cmd/jb@latest
go install github.com/monitoring-mixins/mixtool/cmd/mixtool@latestFor linting and formatting, you would also need jsonnetfmt installed. If you
have a working Go development environment, it's easiest to run the following:
go install github.com/google/go-jsonnet/cmd/jsonnetfmt@latestThe files in dashboards_out need to be imported
into your Grafana server. The exact details will depend on your environment.
prometheus_alerts.yaml needs to be imported into Prometheus.
Edit config.libsonnet if required and then build JSON dashboard files for Grafana:
makeFor more advanced uses of mixins, see https://github.com/monitoring-mixins/docs.