This project integrates Perforce's Helix Core Server (p4d) with the Prometheus monitoring framework and associated tools. It allows real-time metrics from analysis of p4d log files and other monitoring commands to be collected by Prometheus and shown on Grafana dashboards. The metrics can also used for system alerting.
Prometheus has many integrations with other monitoring packages and other systems, so just because you are not using Prometheus doesn't mean this isn't useful! This project has simple installation instructions and scripts for all the required components.
The p4prometheus component itself (from this project) continuously parses p4d log files and writes a summary to
a specified Prometheus compatible metrics file which can be handled via the node_exporter
textfile collector module. Other components of this package collect related metrics by interrogating p4d server
and other associated logs.
Uses go-libp4dlog for actual log file parsing.
This is currently a Community Supported Perforce tool.
This is part of a solution consisting of the following components:
- Prometheus - time series metrics management system
- VictoriaMetrics - (optional but recommended) high performing storage management which is Prometheus-compatible
- Grafana - The leading open source software for time series analytics
- node_exporter - Prometheus collector for basic Linux metrics
- windows_exporter - Prometheus collector for Windows machines
- alertmanager - handles alerting including de-duplication etc - part of Prometheus
Custom components in this project:
- p4prometheus - a released binary executable
- monitor_metrics.sh - an SDP compatible bash script to generate simple supplementary metrics - see also installation instructions
- other useful scripts and tools
Check out the Prometheus architecture below. The custom components referred to above interface with "Prometheus targets" (or "Jobs/exporters") in the lower left of the diagram.
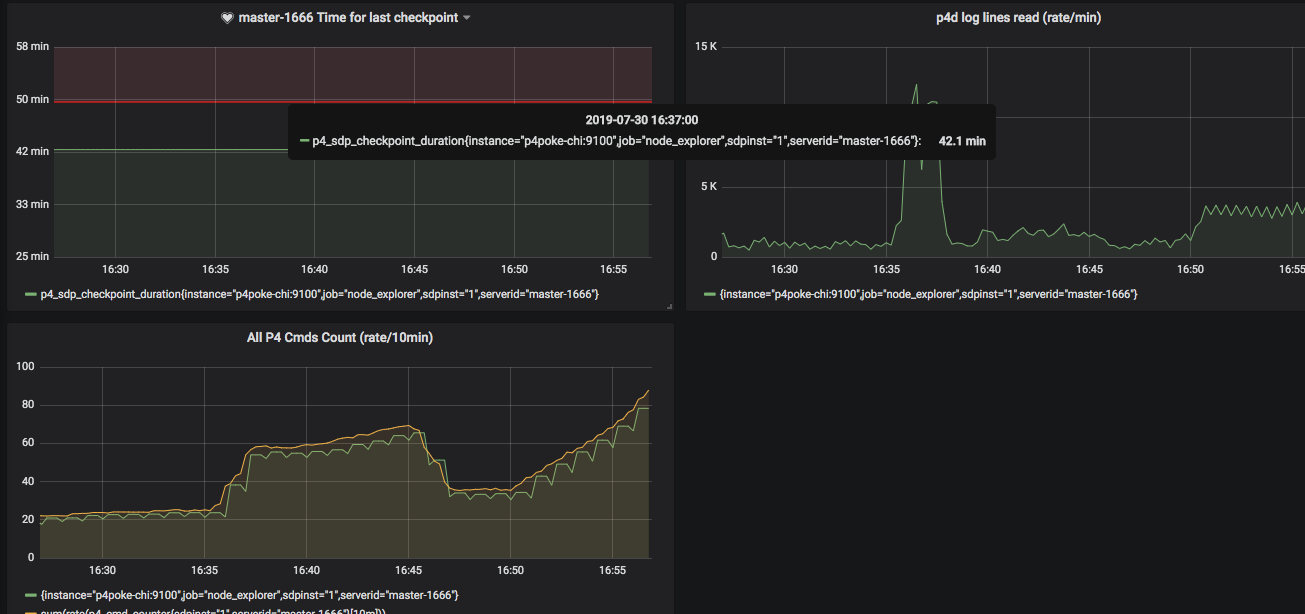
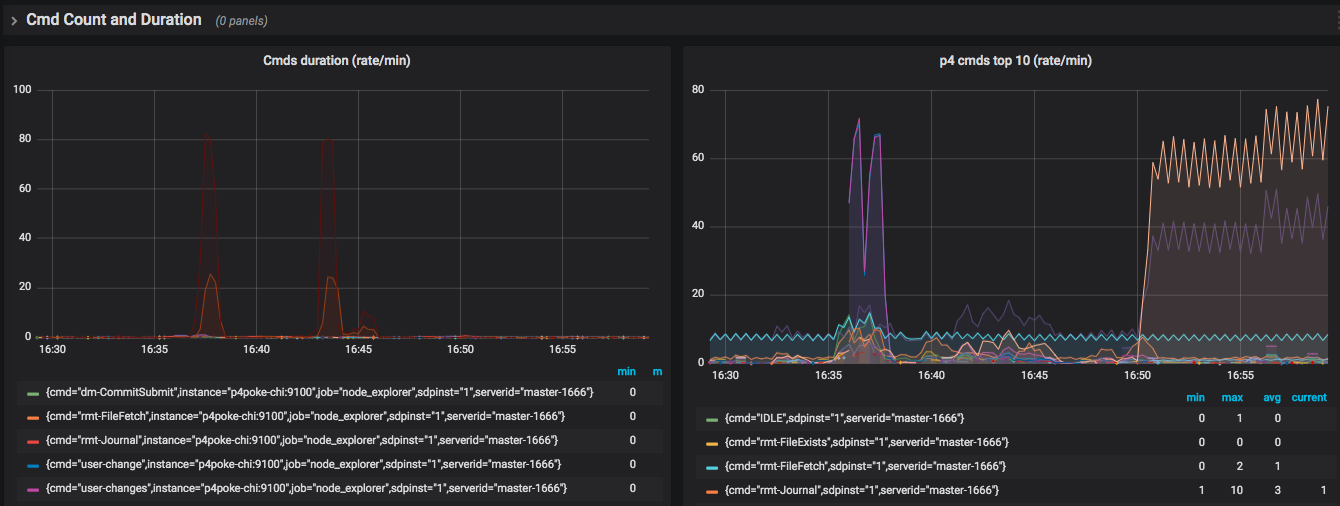
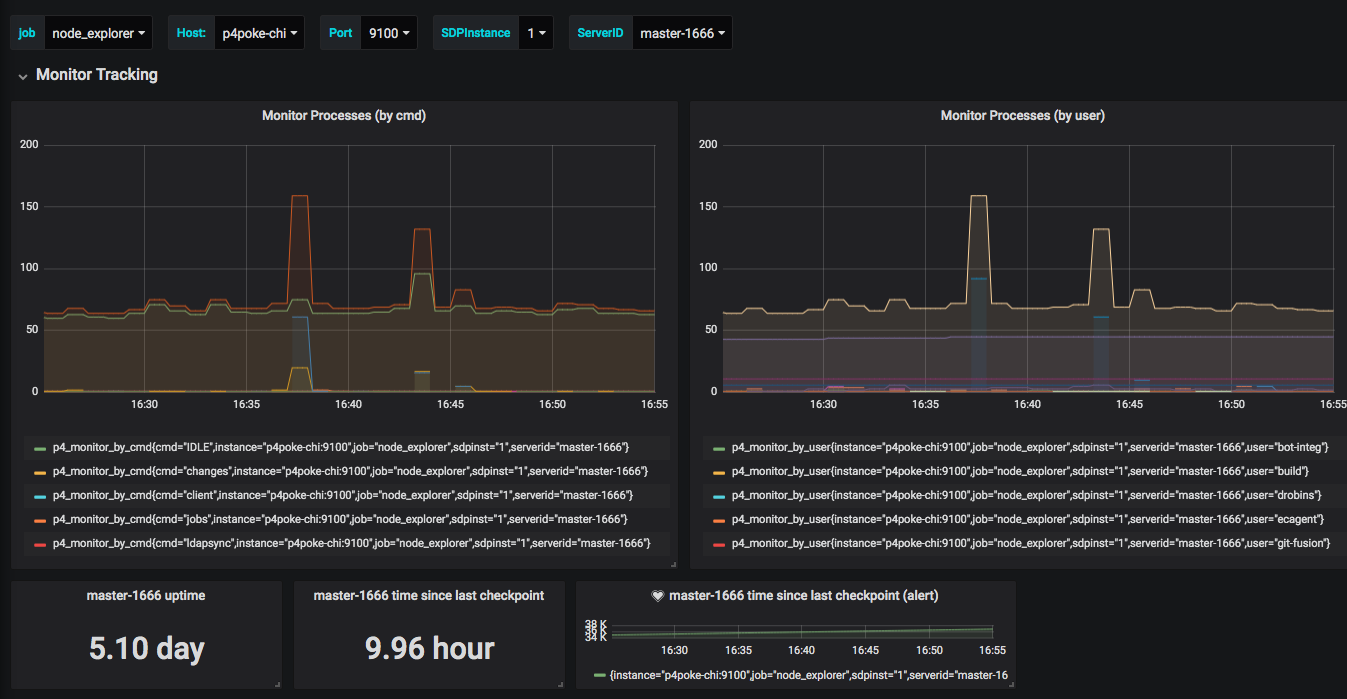
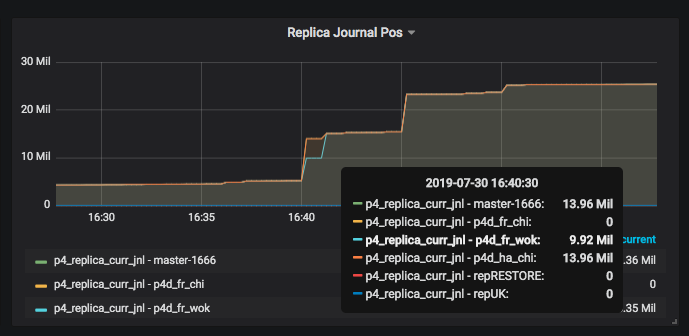
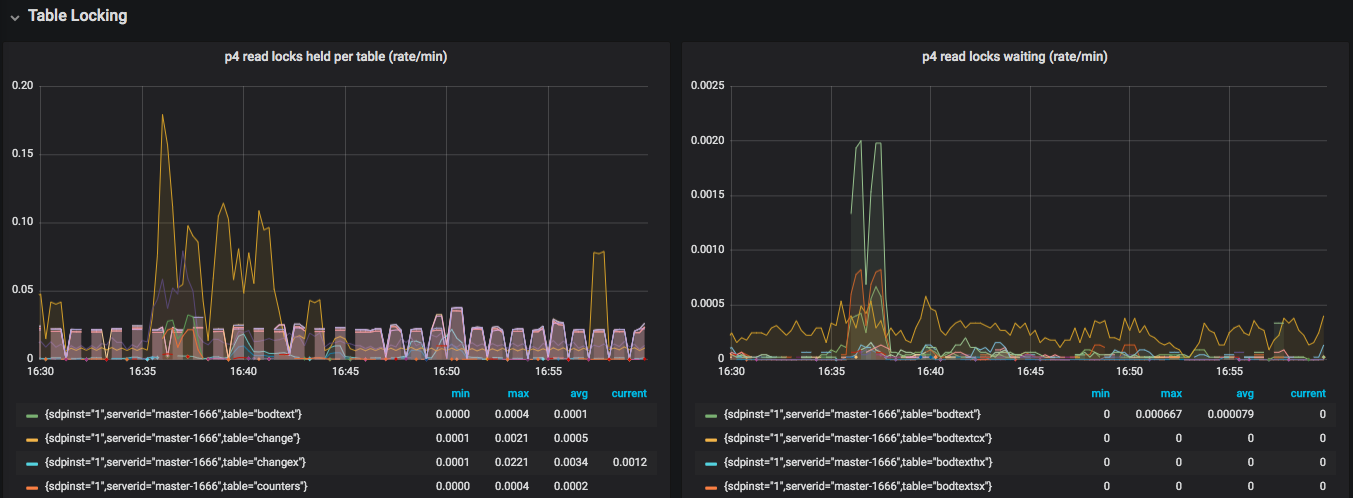
When installed and setup, you can get dashboards such as the following:
Commands Summary:
Rates for command durations and count:
Active commands (monitor):
Replication status (there is a lag in the middle of the picture - which might exceed a configurable threshold for your site and trigger an alert):
Read/write locks held/waiting status:
Dashboard alerts can be defined, as well as alert rules which are actioned by alertmanager - see installation link below for examples.
You need to install Prometheus and Grafana using standard methods. This is typically done on a seperate VM/machine to the Perforce server itself (for security and HA reasons).
Note that all the components do run on Windows but you may need an appropriate Service wrapper.
See Detailed Installation Instructions (INSTALL.md) in this project.
The basic metrics are those implemented in P4D Log Parsing library which it calls.
Note these metrics will all have these labels: sdpinst (if SDP), serverid. Extra metric labels are shown in the table.
| Metric Name | Labels | Description |
|---|---|---|
| p4_prom_log_lines_read | A count of log lines read - useful to make sure p4prometheus is working as expected | |
| p4_prom_cmds_processed | A count of all cmds processed - a key metric to show as a rate | |
| p4_prom_cmds_pending | A count of all current cmds (not completed) - too high a value indicates issues with log commands | |
| p4_cmd_running | The number of running commands at any one time - a high value indicates concurrent jobs and/or locks | |
| p4_prom_cpu_user | User CPU used by p4prometheus | |
| p4_prom_cpu_system | System CPU used by p4prometheus | |
| p4_sync_files_added | The number of files added to workspaces by syncs | |
| p4_sync_files_updated | The number of files updated in workspaces by syncs | |
| p4_sync_files_deleted | The number of files deleted in workspaces by syncs | |
| p4_sync_bytes_added | The number of bytes added to workspaces by syncs | |
| p4_sync_bytes_updated | The number of bytes updated in workspaces by syncs | |
| p4_cmd_counter | cmd | A count of completed p4 cmds (by cmd) |
| p4_cmd_cumulative_seconds | cmd | The total in seconds (by cmd) |
| p4_cmd_cpu_user_cumulative_seconds | cmd | The total in user CPU seconds (by cmd) |
| p4_cmd_cpu_system_cumulative_seconds | cmd | The total in system CPU seconds (by cmd) |
| p4_cmd_error_counter | cmd | A count of cmd errors (by cmd) |
| p4_cmd_user_counter | user | A count of completed p4 cmds (by user) |
| p4_cmd_user_cumulative_seconds | user | The total in seconds (by user) |
| p4_cmd_ip_counter | ip | A count of completed p4 cmds (by IP) - can be turned off for large sites |
| p4_cmd_ip_cumulative_seconds | ip | The total in seconds (by IP) - can be turned off for large sites |
| p4_cmd_user_detail_counter | user, cmd | A count of completed p4 cmds (by user and cmd) - can be turned off for large sites or specify only named automation users |
| p4_cmd_user_detail_cumulative_seconds | user, cmd | The total in seconds (by user and cmd) - as above |
| p4_cmd_replica_counter | replica | A count of completed p4 cmds (by broker/replica/proxy) |
| p4_cmd_replica_cumulative_seconds | replica | The total in seconds (by broker/replica/proxy) |
| p4_cmd_program_counter | program | A count of completed p4 cmds (by program) - identifies program/app versions, e.g. p4 or p4v or API |
| p4_cmd_program_cumulative_seconds | program | The total in seconds (by program) |
| p4_total_read_wait_seconds | table | The total waiting for read locks in seconds (by table) |
| p4_total_read_held_seconds | table | The total read locks held in seconds (by table) |
| p4_total_write_wait_seconds | table | The total waiting for write locks in seconds (by table) |
| p4_total_write_held_seconds | table | The total write locks held in seconds (by table) |
| p4_total_trigger_lapse_seconds | trigger | The total lapse time for triggers in seconds (by trigger) |
Note these metrics will all have these labels: sdpinst (if SDP), serverid. Extra metric labels are shown in the table.
| Metric Name | Labels | Description |
|---|---|---|
| p4_server_uptime | P4D Server uptime (seconds) | |
| p4_change_counter | P4D change counter - monitor normal activity for submits etc | |
| p4_monitor_by_cmd | cmd | P4 running processes - counted by cmd |
| p4_monitor_by_user | user | P4 running processes - counted by user |
| p4_process_count | P4 running processes - counted via 'ps' | |
| p4_completed_cmds | Completed p4 commands - simple grep of log file (turned off for large logs) | |
| p4_sdp_checkpoint_log_time | Time of last checkpoint log - helps check if automated jobs are running | |
| p4_sdp_checkpoint_duration | Time taken for last checkpoint/restore action - check for sudden increases | |
| p4_replica_curr_jnl | servername | Current journal for server (from "servers -J" |
| p4_replica_curr_pos | servername | Current journal for server - key measure of replication lag (from "servers -J" |
| p4_error_count | subsystem, error_id, level | Server errors by id - for sudden spurts of errors |
| p4_pull_errors | P4 pull transfers failed count - to monitor replication status | |
| p4_pull_queue | P4 pull files in queue count - for replication | |
| p4_pull_replica_journals_behind | How many journals replica is behind | |
| p4_pull_replication_error | Set to 1 if replication error detected or 0 if working | |
| p4_pull_replica_lag | How many bytes replica is behind in current journal (-1 = error) | |
| p4_licensed_user_count | P4D Licensed User count | |
| p4_licensed_user_limit | P4D Licensed User Limit | |
| p4_license_expires | P4D License expiry (epoch secs) | |
| p4_license_time_remaining | P4D License time remaining (secs) | |
| p4_license_support_expires | P4D License support expiry (epoch secs) | |
| p4_license_info | info | P4D License info (if present) |
| p4_license_IP | IP | P4D License IP address (if present) |
| p4_filesys_min | filesys | Value of P4D configurable filesys.*.min |
| p4_p4d_build_info | version | P4D Version/build info |
| p4_p4d_server_type | services | P4D server type/services |
| p4_ssl_cert_expires | P4D SSL certificate expiry epoch seconds | |
| p4_sdp_version | version | SDP Version |
This is only available on Linux and requires the lslocks utility to be installed.
These are generated by monitor_wrapper.sh which calls monitor_metrics.py.
Note these metrics will all have these labels: sdpinst (if SDP), serverid. Extra metric labels are shown in the table.
| Metric Name | Description | |
|---|---|---|
| p4_locks_db_read | Database read locks | |
| p4_locks_db_write | Database write locks | |
| p4_locks_cliententity_read | clientEntity read locks | |
| p4_locks_cliententity_write | clientEntity write locks | |
| p4_locks_meta_read | meta db read locks | |
| p4_locks_meta_write | meta db write locks | |
| p4_locks_cmds_blocked | cmds blocked by locks |


