Tropict is a set of python and R scripts that adjust the globe to make land masses in the tropics fill up more visual real estate. It does this by exploiting the ways continents "fit into" each other, splicing out wide areas of empty ocean and nestling the continents closer together.
All Tropict scripts are designed to show the region between 30° S and 30° N. In an equirectangular projection, that looks like this:
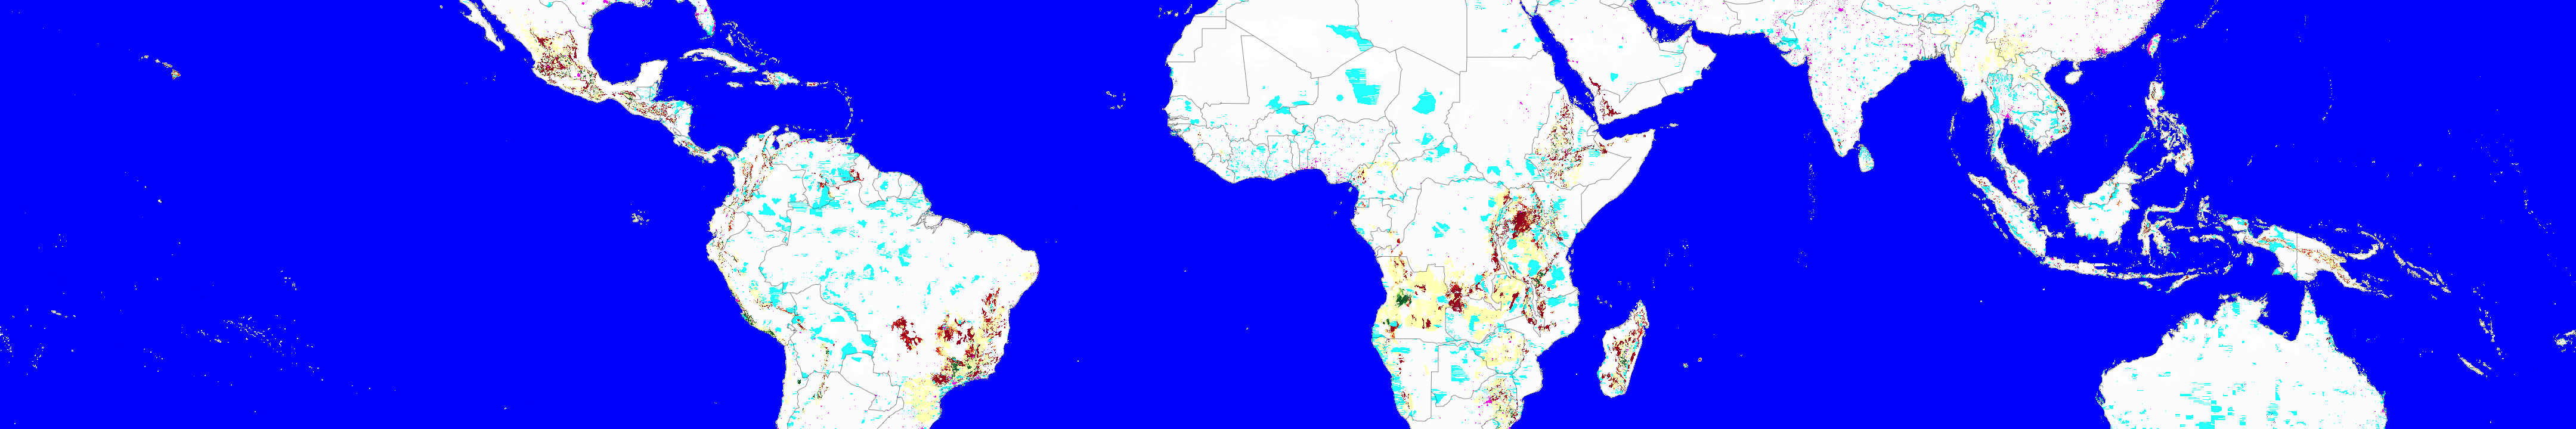
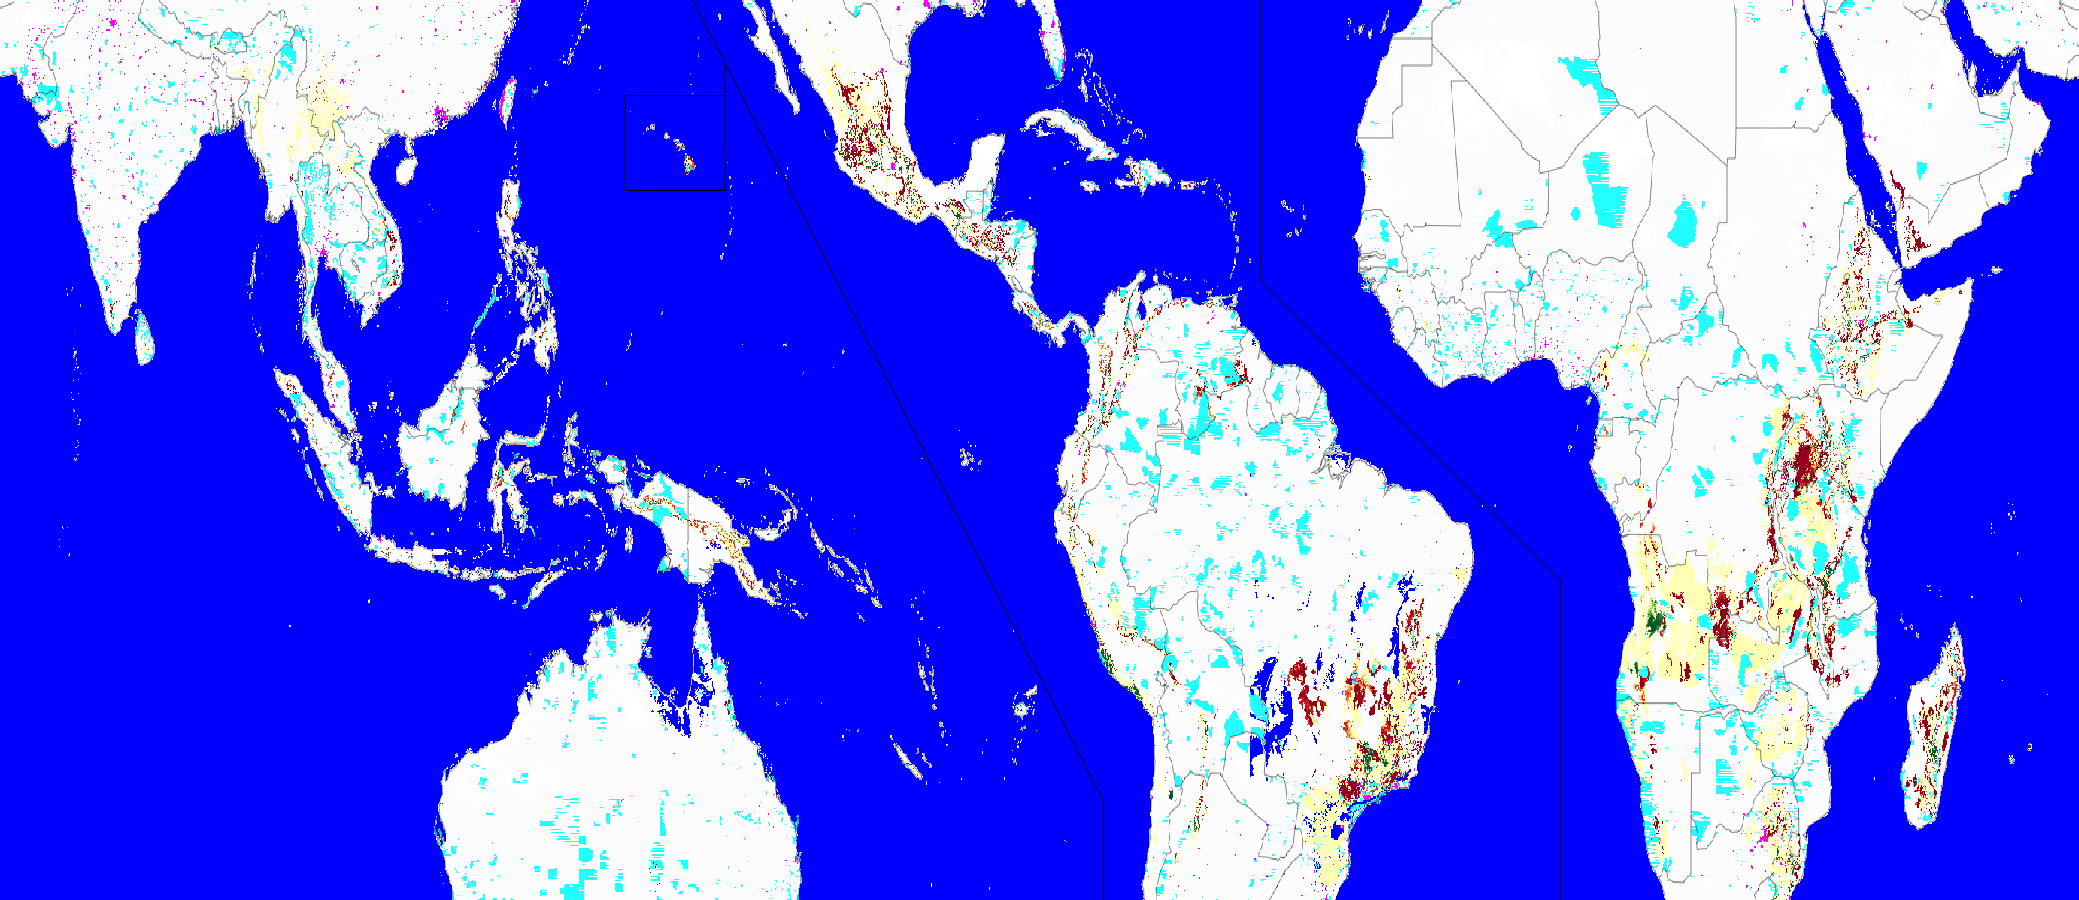
By removing open ocean and applying the Gall-Peters projection, we can see the land much more clearly:
The following scripts are included in the Tropict package:
Syntax: python splice_grid.py <inputfile> <outputfile>
splice_grid can operate on netCDF files or images. In either case,
the original file must be a consist of an equirectangular grid, from
180°W to 180°E and 30°N to 30°S.
To operate on a netCDF files, <outputfile> must have a .nc4
extension. The dimensions must include a lat or latitude
dimension and a lon or longitude dimension. All variables using
these dimensions will be converted. The result will be 2079 x 900
grid pixels, in the same orientation as the original. Ocean areas
should either have the missing value or a value greater than
MAX_NCDF_VALUE (specified at the top of the file).
To operate on an image file, both <inputfile> and <outputfile>
must use extensions specified in the Pillow
documentation.
Ocean areas should either be specified as pure white (255, 255, 255)
or one of the colors in OVERWRITABLE_COLORS, pure blue (0, 0, 255)
by default.
Examples: See examples/process_ncdf.sh and
examples/process_image.sh.
Syntax: python make_shapefile.py <inputpath> <outputpath>
Produce a new tropicted shapefile and a translation configuration file
(a .tsr file) specifying the shifts for doing the tropiction.
The configuration for make_shapefile.py is specified near the top of
the file, and consists of information for identifying Hawaii. Two
methods are provided:
-
By record. If Hawaii is included with a single MultiPolygon record-- even if that MultiPolygon includes other features such as the rest of the United States-- set
CHECK_HAWAII_IN_RECORDtoTrue.SHAPEFILE_REGION_FIELDspecifies a field within each record (e.g."name"), andSHAPEFILE_HAWAII_REGIONspecifies the value for that field for the record containing Hawaii (e.g.,"United States"). -
If
CHECK_HAWAII_IN_RECORDisFalse, Hawaii will be extracted using a rectangular box as specified byHAWAII_REGION(by default, 165°W to 150°W, 15°N to 25°N).
Example: See examples/process_shapefile.sh.
Syntax: python slave_shapefile.py <tsrfile> <inputpath> <outputpath>
The normal make_shapefile.py script determines the shift distances
based on the longitudinal extents of polygons. slave_shapefile.py
is useful when two shapefiles are meant to be used together, and
tropicted identically, but have polygons with somewhat different
extents.
The shifts used by make_shapefile.py are saved to a .tsr file,
which specifies the shift for the Old World, the New World, and
Hawaii. This file is then passed to slave_shapefile.py to reproduce
the shifts.
Example: See examples/process_shapefile.sh.
draw_map.R contains multiple functions as follows.
Example: See examples/example.R.
Syntax: plotMap(border)
Plot the boundaries of countries in the tropics, using the color
specification border.
Syntax: addMap(border)
Plot the boundaries of countries in the tropics, using the color
specification border, atop an existing plot. Typically, such a plot
would be produced by splicerImage below.
Syntax: splicerImage(array, colors, breaks, add)
Generate an image of an already tropicted array in a plot, using the
image command. The tropicted array would typically be produced by
splice_gird.py.
array: An tropicted array
colors: Passed to the image command, specifying the color range for values in array.
breaks: (Optional) Passed to the image command if provided.
add: (Optional, default=F) If add = T, add to an existing plot; otherwise, create a new one.
Syntax: addSeams(col)
Add lines to an existing plot between the Old World and the New World
(in both directions) and around Hawaii. The color of the seams is
specified by col.