library(ISLR)
summary(Weekly)
## Year Lag1 Lag2 Lag3
## Min. :1990 Min. :-18.195 Min. :-18.195 Min. :-18.195
## 1st Qu.:1995 1st Qu.: -1.154 1st Qu.: -1.154 1st Qu.: -1.158
## Median :2000 Median : 0.241 Median : 0.241 Median : 0.241
## Mean :2000 Mean : 0.151 Mean : 0.151 Mean : 0.147
## 3rd Qu.:2005 3rd Qu.: 1.405 3rd Qu.: 1.409 3rd Qu.: 1.409
## Max. :2010 Max. : 12.026 Max. : 12.026 Max. : 12.026
## Lag4 Lag5 Volume Today
## Min. :-18.195 Min. :-18.195 Min. :0.087 Min. :-18.195
## 1st Qu.: -1.158 1st Qu.: -1.166 1st Qu.:0.332 1st Qu.: -1.154
## Median : 0.238 Median : 0.234 Median :1.003 Median : 0.241
## Mean : 0.146 Mean : 0.140 Mean :1.575 Mean : 0.150
## 3rd Qu.: 1.409 3rd Qu.: 1.405 3rd Qu.:2.054 3rd Qu.: 1.405
## Max. : 12.026 Max. : 12.026 Max. :9.328 Max. : 12.026
## Direction
## Down:484
## Up :605
##
##
##
##
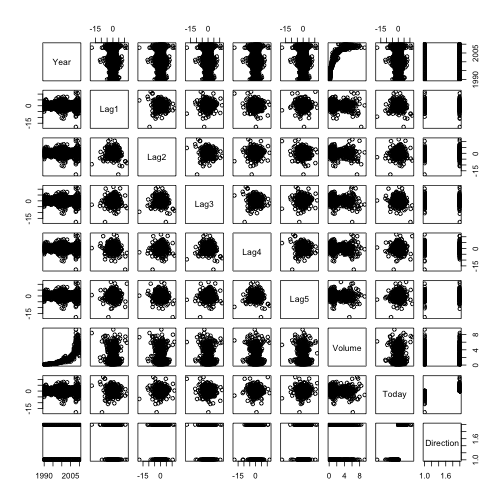
pairs(Weekly)cor(Weekly[, -9])## Year Lag1 Lag2 Lag3 Lag4 Lag5 Volume
## Year 1.00000 -0.032289 -0.03339 -0.03001 -0.031128 -0.030519 0.84194
## Lag1 -0.03229 1.000000 -0.07485 0.05864 -0.071274 -0.008183 -0.06495
## Lag2 -0.03339 -0.074853 1.00000 -0.07572 0.058382 -0.072499 -0.08551
## Lag3 -0.03001 0.058636 -0.07572 1.00000 -0.075396 0.060657 -0.06929
## Lag4 -0.03113 -0.071274 0.05838 -0.07540 1.000000 -0.075675 -0.06107
## Lag5 -0.03052 -0.008183 -0.07250 0.06066 -0.075675 1.000000 -0.05852
## Volume 0.84194 -0.064951 -0.08551 -0.06929 -0.061075 -0.058517 1.00000
## Today -0.03246 -0.075032 0.05917 -0.07124 -0.007826 0.011013 -0.03308
## Today
## Year -0.032460
## Lag1 -0.075032
## Lag2 0.059167
## Lag3 -0.071244
## Lag4 -0.007826
## Lag5 0.011013
## Volume -0.033078
## Today 1.000000
Year and Volume appear to have a relationship. No other patterns are discernible.
attach(Weekly)
glm.fit = glm(Direction ~ Lag1 + Lag2 + Lag3 + Lag4 + Lag5 + Volume, data = Weekly,
    family = binomial)
summary(glm.fit)
##
## Call:
## glm(formula = Direction ~ Lag1 + Lag2 + Lag3 + Lag4 + Lag5 +
## Volume, family = binomial, data = Weekly)
##
## Deviance Residuals:
## Min 1Q Median 3Q Max
## -1.695 -1.256 0.991 1.085 1.458
##
## Coefficients:
## Estimate Std. Error z value Pr(>|z|)
## (Intercept) 0.2669 0.0859 3.11 0.0019 **
## Lag1 -0.0413 0.0264 -1.56 0.1181
## Lag2 0.0584 0.0269 2.18 0.0296 *
## Lag3 -0.0161 0.0267 -0.60 0.5469
## Lag4 -0.0278 0.0265 -1.05 0.2937
## Lag5 -0.0145 0.0264 -0.55 0.5833
## Volume -0.0227 0.0369 -0.62 0.5377
## ---
## Signif. codes: 0 '***' 0.001 '**' 0.01 '*' 0.05 '.' 0.1 ' ' 1
##
## (Dispersion parameter for binomial family taken to be 1)
##
## Null deviance: 1496.2 on 1088 degrees of freedom
## Residual deviance: 1486.4 on 1082 degrees of freedom
## AIC: 1500
##
## Number of Fisher Scoring iterations: 4
Lag 2 appears to have some statistical significance with a Pr(>|z|) = 3%.
glm.probs = predict(glm.fit, type = "response")
glm.pred = rep("Down", length(glm.probs))
glm.pred[glm.probs > 0.5] = "Up"
table(glm.pred, Direction)
## Direction
## glm.pred Down Up
## Down 54 48
## Up 430 557
Percentage of currect predictions: (54+557)/(54+557+48+430) = 56.1%. Weeks the market goes up the logistic regression is right most of the time, 557/(557+48) = 92.1%. Weeks the market goes up the logistic regression is wrong most of the time 54/(430+54) = 11.2%.
train = (Year < 2009)
Weekly.0910 = Weekly[!train, ]
glm.fit = glm(Direction ~ Lag2, data = Weekly, family = binomial, subset = train)
glm.probs = predict(glm.fit, Weekly.0910, type = "response")
glm.pred = rep("Down", length(glm.probs))
glm.pred[glm.probs > 0.5] = "Up"
Direction.0910 = Direction[!train]
table(glm.pred, Direction.0910)
## Direction.0910
## glm.pred Down Up
## Down 9 5
## Up 34 56
mean(glm.pred == Direction.0910)## [1] 0.625
library(MASS)
lda.fit = lda(Direction ~ Lag2, data = Weekly, subset = train)
lda.pred = predict(lda.fit, Weekly.0910)
table(lda.pred$class, Direction.0910)
## Direction.0910
## Down Up
## Down 9 5
## Up 34 56
mean(lda.pred$class == Direction.0910)## [1] 0.625
qda.fit = qda(Direction ~ Lag2, data = Weekly, subset = train)
qda.class = predict(qda.fit, Weekly.0910)$class
table(qda.class, Direction.0910)
## Direction.0910
## qda.class Down Up
## Down 0 0
## Up 43 61
mean(qda.class == Direction.0910)## [1] 0.5865
A correctness of 58.7% even though it picked Up the whole time!
library(class)
train.X = as.matrix(Lag2[train])
test.X = as.matrix(Lag2[!train])
train.Direction = Direction[train]
set.seed(1)
knn.pred = knn(train.X, test.X, train.Direction, k = 1)
table(knn.pred, Direction.0910)
## Direction.0910
## knn.pred Down Up
## Down 21 30
## Up 22 31
mean(knn.pred == Direction.0910)## [1] 0.5
Logistic regression and LDA methods provide similar test error rates.
# Logistic regression with Lag2:Lag1
glm.fit = glm(Direction ~ Lag2:Lag1, data = Weekly, family = binomial, subset = train)
glm.probs = predict(glm.fit, Weekly.0910, type = "response")
glm.pred = rep("Down", length(glm.probs))
glm.pred[glm.probs > 0.5] = "Up"
Direction.0910 = Direction[!train]
table(glm.pred, Direction.0910)
## Direction.0910
## glm.pred Down Up
## Down 1 1
## Up 42 60
mean(glm.pred == Direction.0910)## [1] 0.5865
# LDA with Lag2 interaction with Lag1
lda.fit = lda(Direction ~ Lag2:Lag1, data = Weekly, subset = train)
lda.pred = predict(lda.fit, Weekly.0910)
mean(lda.pred$class == Direction.0910)
## [1] 0.5769
# QDA with sqrt(abs(Lag2))
qda.fit = qda(Direction ~ Lag2 + sqrt(abs(Lag2)), data = Weekly, subset = train)
qda.class = predict(qda.fit, Weekly.0910)$class
table(qda.class, Direction.0910)
## Direction.0910
## qda.class Down Up
## Down 12 13
## Up 31 48
mean(qda.class == Direction.0910)## [1] 0.5769
# KNN k =10
knn.pred = knn(train.X, test.X, train.Direction, k = 10)
table(knn.pred, Direction.0910)
## Direction.0910
## knn.pred Down Up
## Down 17 18
## Up 26 43
mean(knn.pred == Direction.0910)## [1] 0.5769
# KNN k = 100
knn.pred = knn(train.X, test.X, train.Direction, k = 100)
table(knn.pred, Direction.0910)
## Direction.0910
## knn.pred Down Up
## Down 9 12
## Up 34 49
mean(knn.pred == Direction.0910)## [1] 0.5577
Out of these permutations, the original LDA and logistic regression have better performance in terms of test error rate.
