IPyPlot is a small python package offering fast and efficient plotting of images inside Jupyter Notebooks cells. It's using IPython with HTML for faster, richer and more interactive way of displaying big number of images.
Displaying huge numbers of images with Python in Notebooks always was a big pain for me as I always used matplotlib for that task and never have I even considered if it can be done faster, easier or more efficiently.
Especially in one of my recent projects I had to work with a vast number of document images in a very interactive way which led me to forever rerunning notebook cells and waiting for countless seconds for matplotlib to do it's thing..
My frustration grew up to a point were I couldn't stand it anymore and started to look for other options..
Best solution I found involved using IPython.display function in connection with simple HTML. Using that approach I built a simple python package called IPyPlot which finally helped me cure my frustration and saved a lot of my time
Checkout the examples below and gear-images-examples.ipynb notebook which holds end to end examples for using IPyPlot.
IPyPlot can be installed directly from this repo using pip:
pip install git+https://github.com/karolzak/ipyplot
or through PyPI
pip install ipyplot
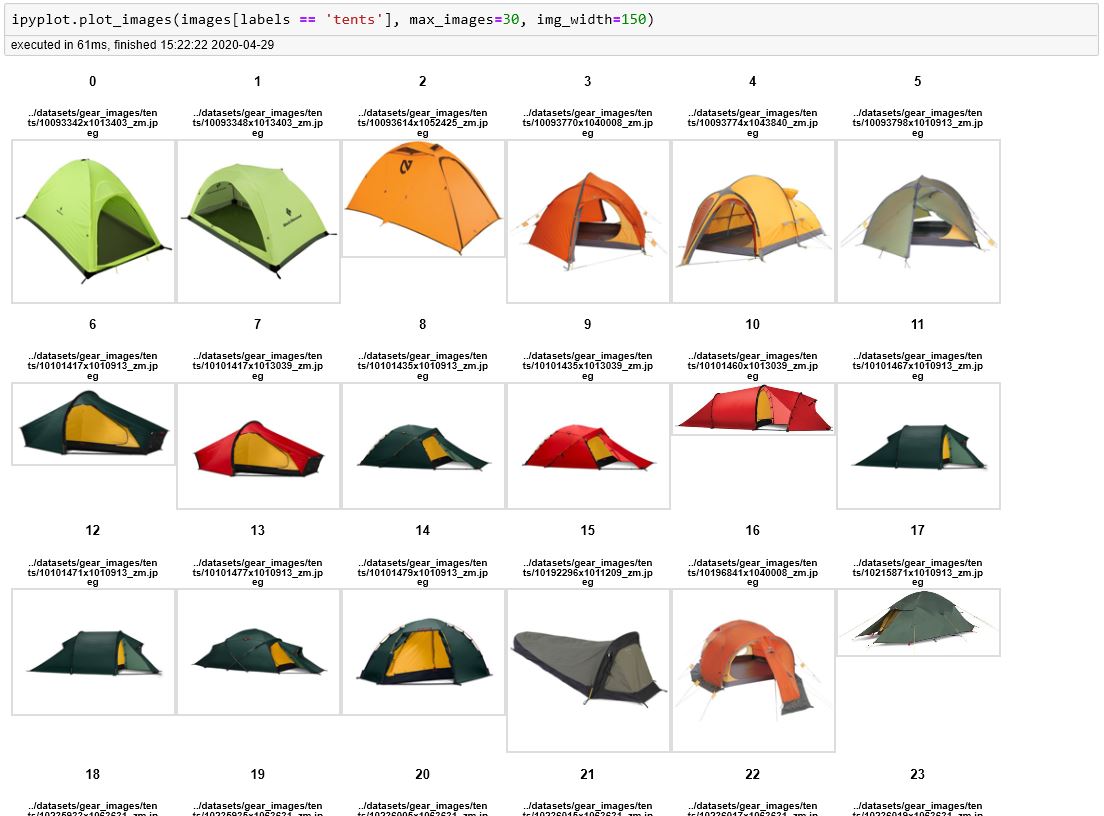
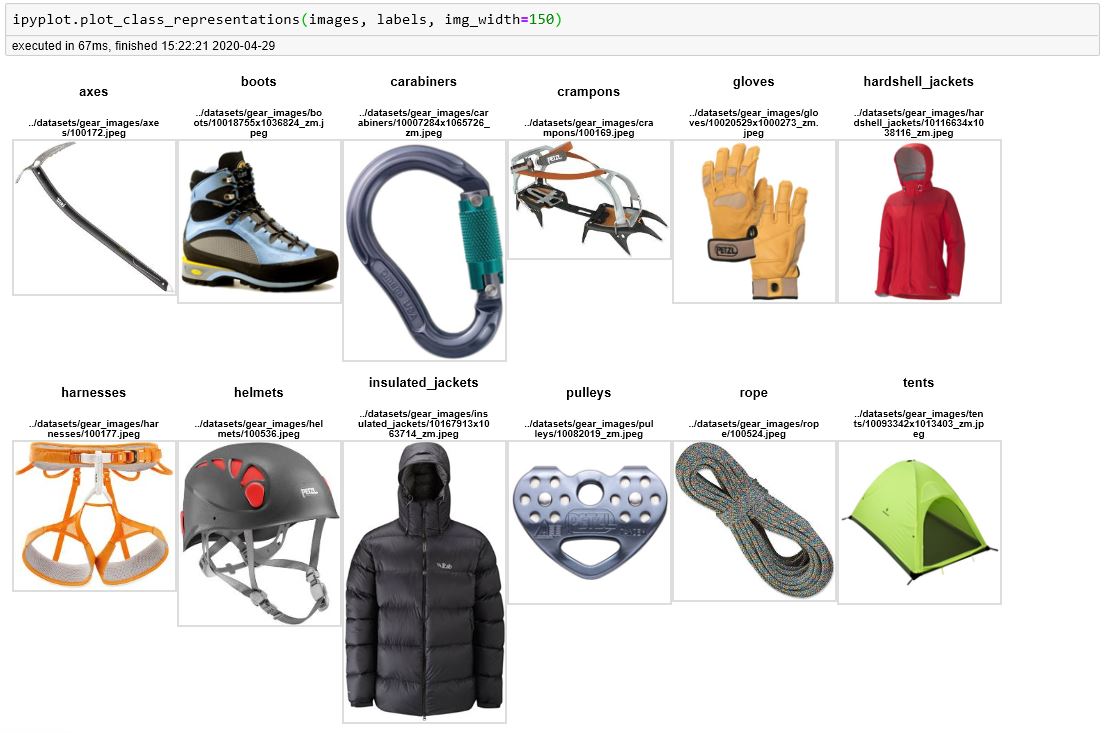
IPyPlot offers 3 main functions which can be used for displaying images in notebooks:
To start working with IPyPlot you need to simply import it like this:
import ipyplotand use any of the available plotting functions shown below (notice execution times).
images - should be a numpy array of either string (image file paths), PIL.Image objects or numpy.array objects representing images
labels - should be a numpy array of string