Serverless computing has seen rapid adoption because of its instant scalability, flexible billing model, and economies of scale. In serverless, developers structure their applications as a collection of functions, sporadically invoked by various events like clicks. The high variability in function image sizes, invocation inter-arrival times, and request burst sizes motivate vendors to scrutinize their infrastructure to ensure a seamless user experience across all of their services. To monitor serverless platform performance, identify pitfalls, and compare different providers, the public attention has turned to benchmarking, whereby measurement functions are deployed to the cloud to gather insights regarding response latencies, transfer speeds, and vendor policies.
This work introduces vHive-bench, our open-source framework for serverless performance evaluation, intending to enable researchers and developers to benchmark multiple cloud platforms. Using this framework, we characterize system performance in AWS Lambda and vHive - the Edinburgh Architecture and Systems (EASE) virtual machine orchestrator system.
To begin with, we provide an overview of our benchmarking solution and define the main terms used throughout the rest of the codebase:
- The coordinator orchestrates the entire benchmarking procedure.
- The experiment configuration is an input JSON file used to specify and customize the experiments.
- An endpoint is a URL used for locating the function instance over the Internet. As seen in the diagram, this URL most often points to resources such as AWS API Gateway, Azure HTTP Triggers, vHive Kubernetes Load Balancer, or similar.
- The vendor endpoints input JSON file is only used for providers such as vHive that do not currently support automated function management (e.g., function listing, deployment, repurposing, or removal via SDKs or APIs).
- The inter-arrival time (IAT) is the time interval that the client waits for in-between sending two bursts to the same endpoint. To add some variability and simulate a more realistic scenario, we sample this from a shifted exponential distribution. For example, if we set the IAT to 10 minutes (modeling cold starts for most vendors), generated values can be, e.g., 10m12s, 10m27s, 11m.
- Multiple endpoints can be used simultaneously by the same experiment to speed up the benchmarking. The JSON configuration field parallelism defines this number: the higher it is, the more endpoints will be allocated, and the more bursts will be sent in short succession (speeding up the process for large IATs).
- The latencies CSV files are the main output of the evaluation framework. They are used in our custom Python plotting utility suite to produce insightful visualizations.
- The logs text file (Figure 4.2) is the final output of the benchmarking client. Log records are useful for optimizing code and debugging problematic behavior.
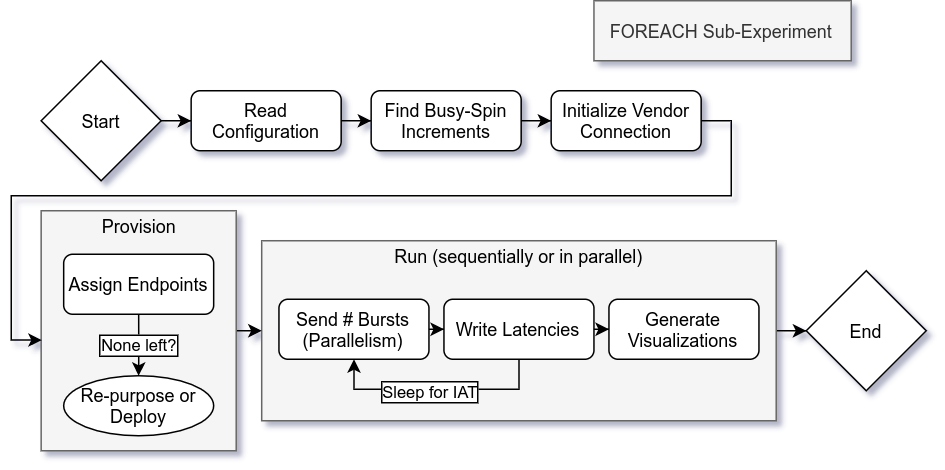
Finally, we look at the procedural steps adopted by the framework:
- The JSON configuration file is read and parsed, and any default field values are assigned. If the configuration file is missing, the program throws a fatal error.
- Experiment service times (e.g., 10 seconds) are translated on the client machine into numbers representing busy-spin increment limits (e.g., 10,000,000). In turn, those are used by the measurement function on the server machine to keep the processor busy-spinning.
- A connection with the serverless vendor is established. This is abstracted away behind a common interface having only four functions: ListAPIs, DeployFunction, RemoveFunction, and UpdateFunction. Used exclusively throughout the codebase, this interface offers seamless integration functionality with any provider.
- In the provisioning phase, existing endpoints are first queried either using official provider APIs or from a local file. The corresponding serverless functions are then updated, deployed, or removed to match the specified configuration file.
- The last step runs all the experiments either sequentially or in parallel: bursts are successively sent to each available endpoint, followed by a sleep duration specified by the IAT. The process is repeated until all responses have been recorded to disk. Finally, statistics and visualizations are generated.
We integrate all necessary server-side functionality into a single function that we call a measurement function. This approach is similar to that taken in [40] and other serverless performance evaluation frameworks. A measurement function can perform up to three tasks, depending on the use case:
- It always collects function instance runtime information.
- If applicable, the function will simulate work by incrementing a variable in a busy-spin loop. This can be as simple as “for i := 0; i<incrementLimit; i++{}”.
- If applicable, the function records invocation timing. This is particularly useful for our data transfer studies where we complement client-measured round-trip time with internal function timestamps for validation purposes.
Zippackaging deployments only apply toproducer-consumerimages and will not be supported by any future images.
- Code storage limit
Cannot update function code: CodeStorageExceededException: Code storage limit exceeded.
{
  RespMetadata: {
    StatusCode: 400,
    RequestID: "886339b1-63ae-4f80-a923-7c1ed4201b6e"
  },
  Message_: "Code storage limit exceeded.",
  Type: "User"
}
-
Regional APIs limit
600 -
Unexplained AWS errors (solved by restarting experiment)
HTTP request failed with error dial tcp: lookup msi6v4vdwk.execute-api.us-west-1.amazonaws.com on 128.110.156.4:53: no such host
HTTP request failed with error dial tcp: lookup 10m09hsby0.execute-api.us-west-1.amazonaws.com on 128.110.156.4:53: server misbehaving
- Unexplained Azure errors (solved by refreshing the function in Visual Studio Code)
HTTP request failed with error 404: Not Found (nginx)


