Setup a Kubernetes cluster using
k3drunning in GitHub Codespaces
This is a template that will setup a Kubernetes developer cluster using k3d in a GitHub Codespace or local Dev Container
We use this for inner-loop Kubernetes development. Note that it is not appropriate for production use but is a great Developer Experience. Feedback calls the approach game-changing - we hope you agree!
For ideas, feature requests, and discussions, please use GitHub discussions so we can collaborate and follow up.
This Codespace is tested with zsh and oh-my-zsh - it "should" work with bash but hasn't been fully tested. For the HoL, please use zsh to avoid any issues.
You can run the dev container locally and you can also connect to the Codespace with a local version of VS Code.
Please experiment and add any issues to the GitHub Discussion. We LOVE PRs!
The motivation for creating and using Codespaces is highlighted by this GitHub Blog Post. "It eliminated the fragility and single-track model of local development environments, but it also gave us a powerful new point of leverage for improving GitHub’s developer experience."
You must have access to Codespaces as an individual or part of a GitHub Team or GitHub Enterprise Cloud
If you are a member of this GitHub organization, you can skip this step and open with Codespaces
Create your repo from this template and add your application code
- Click the
Use this templatebutton - Enter your repo details
Note this screen shot is a little out of date with the released version of Codespaces
We LOVE PRs ... :)
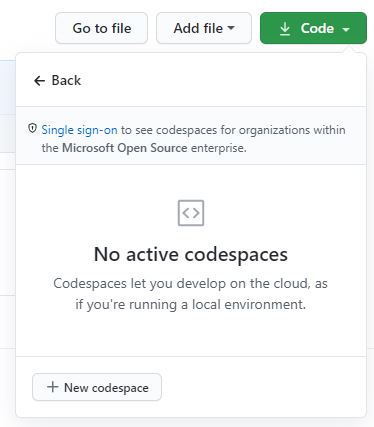
- Click the
Codebutton on your repo - Click
Open with Codespaces - Click
New Codespace - Choose the
4 coreoption- 2 core isn't enough to run everything well
Important!
Another late change - wait until the Codespace is ready before opening the workspace
We LOVE PRs ... :)
- When prompted, choose
Open Workspace
# build the cluster
make all
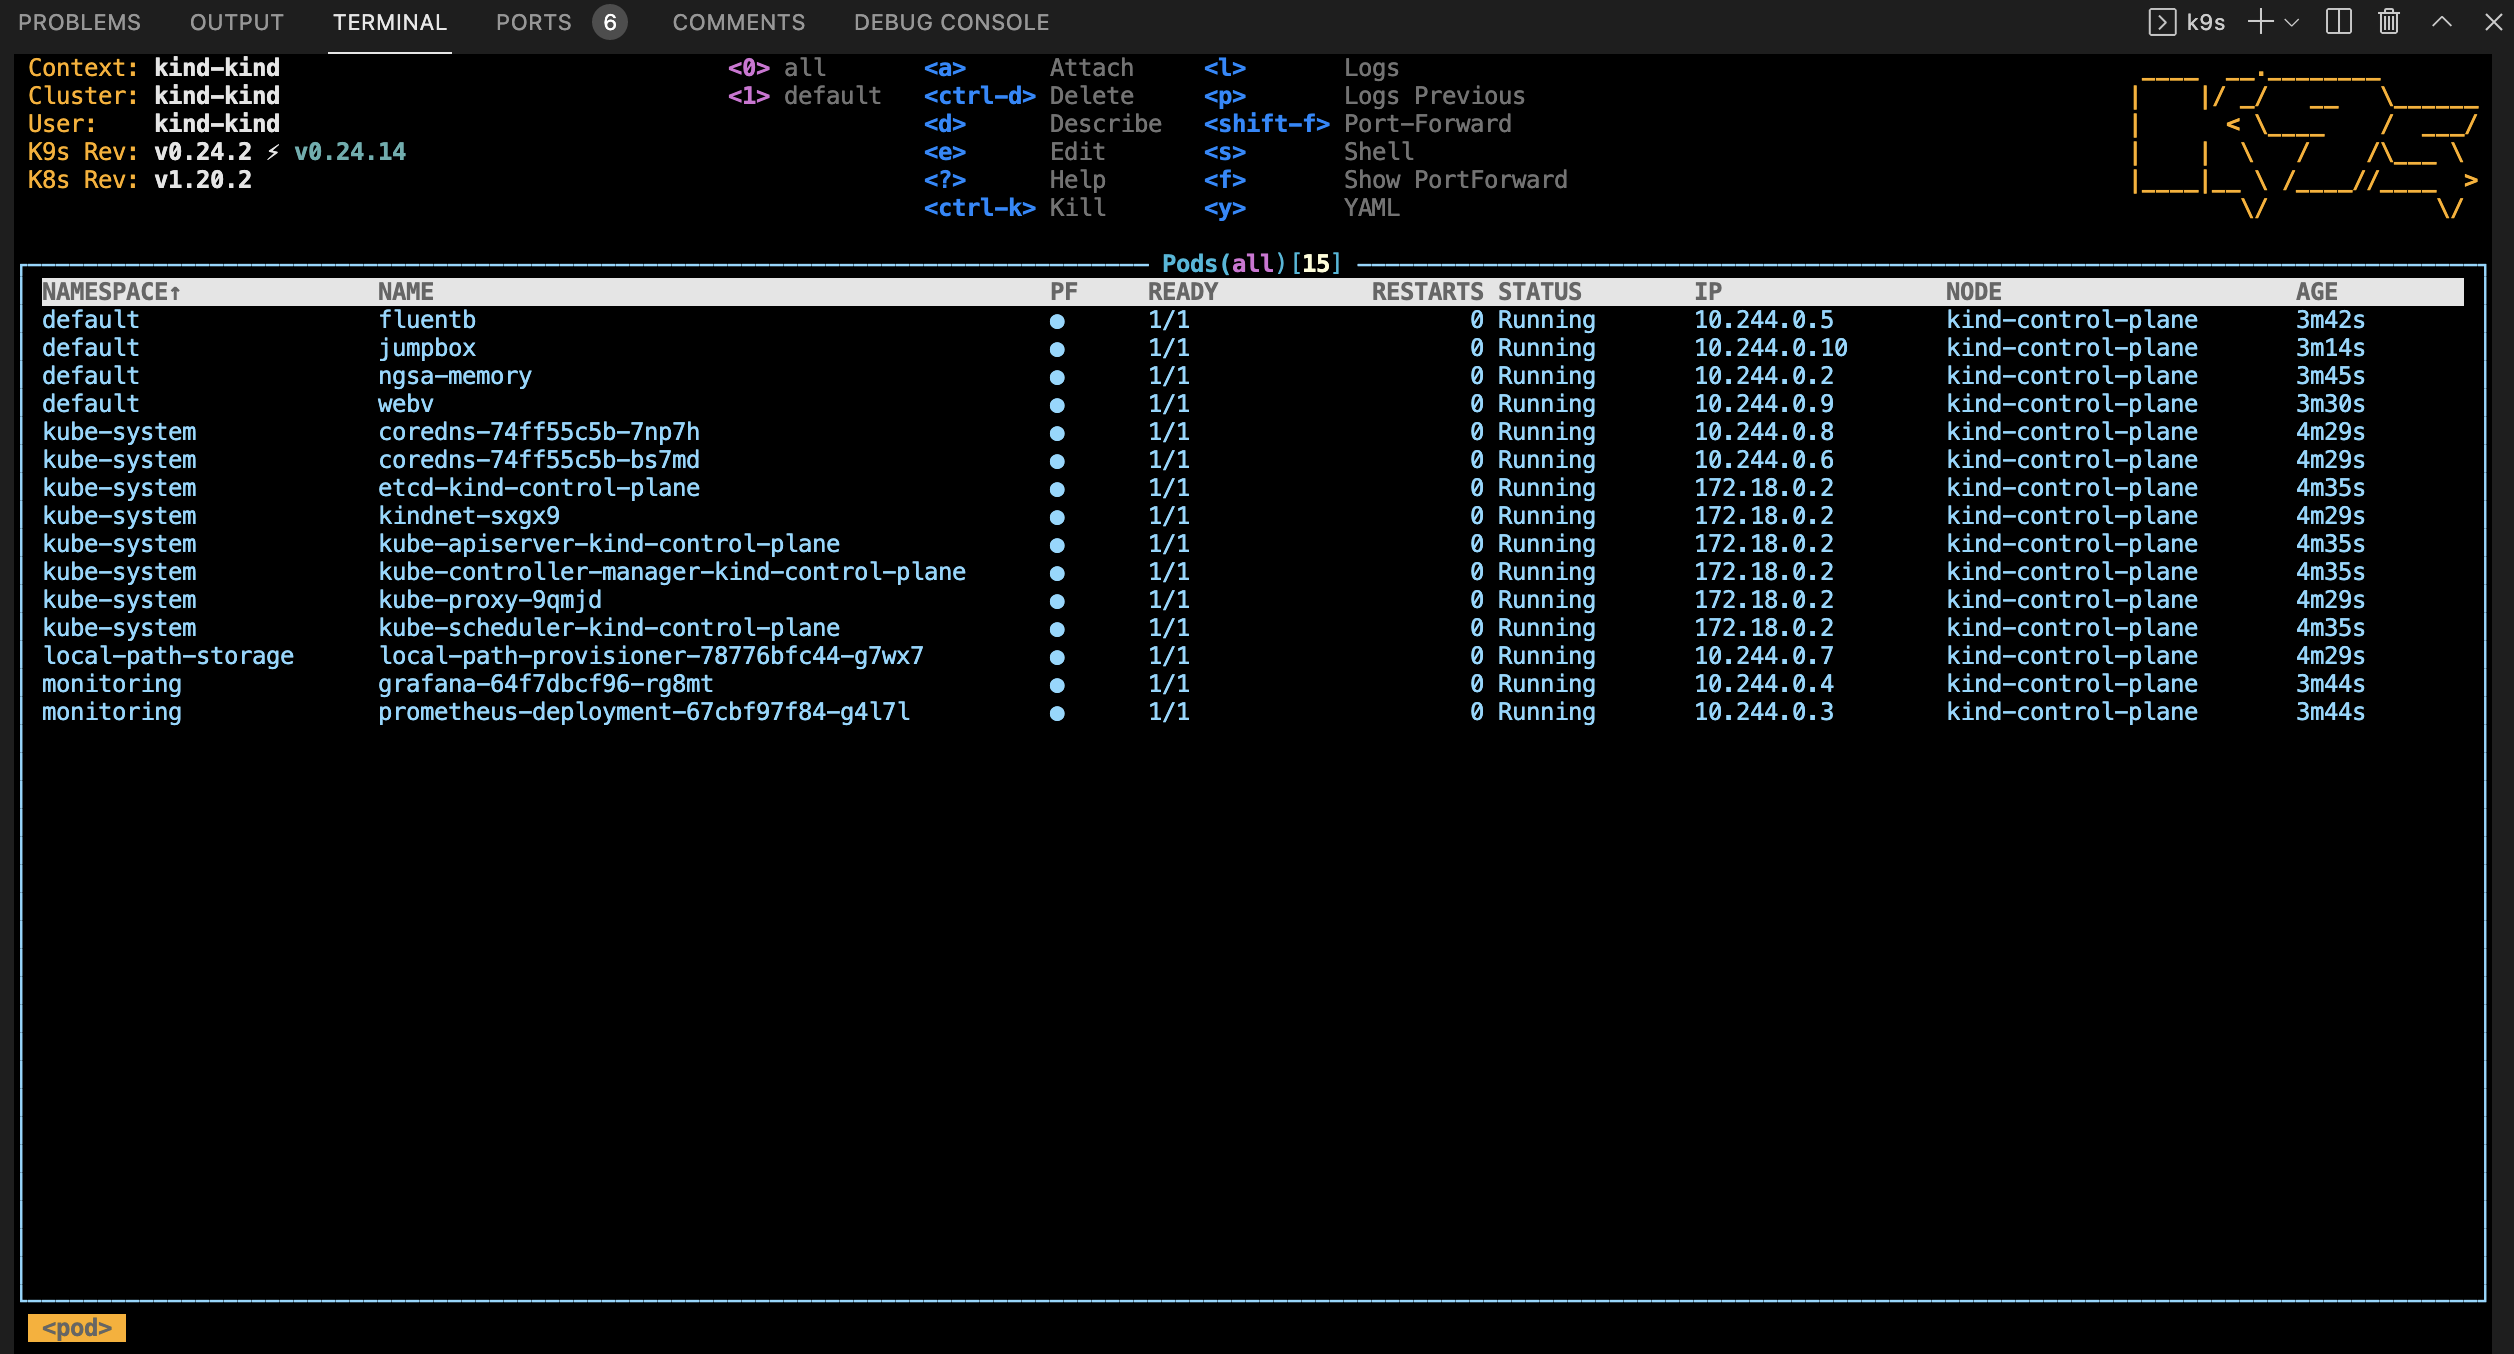
Output from make all should resemble this
default      jumpbox                                   1/1   Running   0   25s
default      ngsa-memory                               1/1   Running   0   33s
default      webv                                      1/1   Running   0   31s
logging      fluentbit                                 1/1   Running   0   31s
monitoring   grafana-64f7dbcf96-cfmtd                  1/1   Running   0   32s
monitoring   prometheus-deployment-67cbf97f84-tjxm7    1/1   Running   0   32s
- All endpoints are usable in your browser via clicking on the
Portstab- Select the
open in browser iconon the far right
- Select the
- Some popup blockers block the new browser tab
- If you get a gateway error, just hit refresh - it will clear once the port-forward is ready
# check endpoints
make check
- From the Codespace terminal window, start
k9s- Type
k9sand press enter - Press
0to select all namespaces - Wait for all pods to be in the
Runningstate (look for theSTATUScolumn) - Use the arrow key to select
nsga-memorythen press thelkey to view logs from the pod - To go back, press the
esckey - Use the arrow key to select
jumpboxthen pressskey to open a shell in the container- Hit the
ngsa-memoryNodePort from within the cluster by executinghttp ngsa-memory:8080/version - Verify 200 status in the response
- To exit -
exit
- Hit the
- To view other deployed resources - press
shift + :followed by the deployment type (e.g.secret,services,deployment, etc). - To exit -
:q <enter>
- Type
Open curl.http
curl.http is used in conjuction with the Visual Studio Code REST Client extension.
When you open curl.http, you should see a clickable
Send Requesttext above each of the URLs
Clicking on Send Request should open a new panel in Visual Studio Code with the response from that request like so:
A jump box pod is created so that you can execute commands in the cluster
-
use the
kjaliaskubectl exec -it jumpbox -- bash -l- note: -l causes a login and processes
.profile - note:
sh -lwill work, but the results will not be displayed in the terminal due to a bug
- note: -l causes a login and processes
-
use the
kjealiaskubectl exec -it jumpbox --
-
example
- run http against the ClusterIP
kje http ngsa-memory:8080/version
- run http against the ClusterIP
-
Click on the
portstab of the terminal window -
Click on the
open in browser iconon the Prometheus port (30000) -
This will open Prometheus in a new browser tab
-
From the Prometheus tab
- Begin typing NgsaAppDuration_bucket in the
Expressionsearch - Click
Execute - This will display the
histogramthat Grafana uses for the charts
- Begin typing NgsaAppDuration_bucket in the
Note: you have to make the changes before you run
make all
Goal: The steps needed to make the Grafana dashboard accessible via a Codespaces forwarded port
- Open
.devcontainer/devcontainer.json - Add port 32000 to
forwardPorts - Add the port label
"32000": { "label": "Grafana" }toportsAttributes - Verify
Grafana (32000)in thePortstab of the Terminal view
- Open
deploy/grafana/deployment.yaml - In the configs for
kind: service, set the ports- This example forwards local port 3000 to NodePort 32000
  ports:
    - port: 3000
      targetPort: 3000
      nodePort: 32000
- Open
deploy/k3d.yaml - Under
portsmap nodePort 32000 to local port 32000 - Under
- port: 32000:32000add the nodeFilter,server[0]- Explanation
- There is only one node, which has the Grafana pod
- That node in the cluster is server node 0 (aka server[0])
- The node filter indicates which node to send traffic to
- For multi-node clusters, you have to update
- Explanation
ports:
  - port: 32000:32000
    nodeFilters:
      - server[0]
-
Grafana login info
- admin
- akdc-512
-
Once
make allcompletes successfully- Click on the
portstab of the terminal window - Click on the
open in browser iconon the Grafana port (32000) - This will open Grafana in a new browser tab
- Click on the
- Click on
Homeat the top of the page - From the dashboards page, click on
NGSA
# from Codespaces terminal

# run a baseline test (will generate warnings in Grafana)
make test

# run a 60 second load test
make load-test
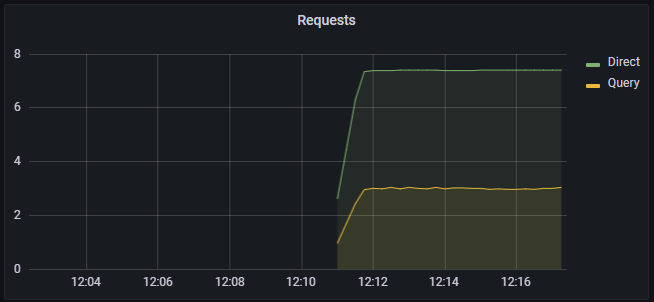
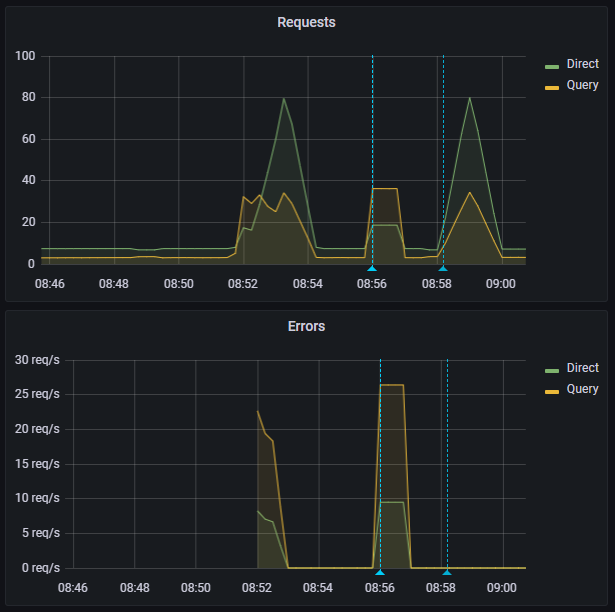
- Switch to the Grafana brower tab
- The test will generate 400 / 404 results
- The requests metric will go from green to yellow to red as load increases
- It may skip yellow
- As the test completes
- The metric will go back to green (1.0)
- The request graph will return to normal
- Start
k9sfrom the Codespace terminal - Press
0to show allnamespaces - Select
fluentbitand pressenter - Press
enteragain to see the logs - Press
sto Toggle AutoScroll - Press
wto Toggle Wrap - Review logs that will be sent to Log Analytics when configured
- See
deploy/loganalyticsfor directions
- See
- Switch back to your Codespaces tab
# from Codespaces terminal

# make and deploy a local version of WebV to k8s
make webv
- Switch back to your Codespaces tab
# from Codespaces terminal

# make and deploy a local version of ngsa-memory to k8s
make app
Makefile is a good place to start exploring
make sure you are in the root of the repo
Create a new dotnet webapi project
mkdir -p dapr-app
cd dapr-app
dotnet new webapi --no-https
Run the app with dapr
dapr run -a myapp -p 5000 -H 3500 -- dotnet run
Check the endpoints
- open
dapr.http- click on the
dotnet appsend requestlink - click on the
dapr endpointsend requestlink
- click on the
Open Zipkin
- Click on the
Portstab- Open the
Zipkinlink - Click on
Run Query- Explore the traces generated automatically with dapr
- Open the
Stop the app by pressing ctl-c
Clean up
cd ..
rm -rf dapr-app
Changes to the app have already been made and are detailed below
- Open
.vscode/launch.json- Added
.NET Core Launch (web) with Daprconfiguration
- Added
- Open
.vscode/task.json- Added
daprd-debuganddaprd-downtasks
- Added
- Open
weather/weather.csproj- Added
dapr.aspnetcorepackage reference
- Added
- Open
weather/Startup.cs- Injected dapr into the services
- Line 29
services.AddControllers().AddDapr()
- Line 29
- Added
Cloud Events- Line 40
app.UseCloudEvents()
- Line 40
- Injected dapr into the services
- Open
weather/Controllers/WeatherForecastController.csPostWeatherForecastis a new function forsendingpub-sub events- Added the
Dapr.Topicattribute - Got the
daprClientvia Dependency Injection - Published the model to the
State Store
- Added the
Get- Added the
daprClientvia Dependency Injection - Retrieved the model from the
State Store
- Added the
- Set a breakpoint on lines 30 and 38
- Click on one of the VS Code panels to make sure it has the focus, then Press
F5to run - Alternatively, you can use the
hamburgermenu, thenRunandStart Debugging - Open
dapr.http- Send a message via dapr
- Click on
Send Requestunderpost to dapr - Click
continuewhen you hit the breakpoint - 200 OK
- Click on
- Get the model from the
State Store- Click on
Send Requestunderdapr endpoint - Click
continuewhen you hit the breakpoint - Verify the value from the POST request appears
- Click on
- Change the
temperatureCvalue in POST request and repeat
- Send a message via dapr
- Why don't we use helm to deploy Kubernetes manifests?
- The target audience for this repository is app developers so we chose simplicity for the Developer Experience.
- In our daily work, we use Helm for deployments and it is installed in the
Codespaceshould you want to use it.
- Why
k3dinstead ofKind?- We love kind! Most of our code will run unchanged in kind (except the cluster commands)
- We had to choose one or the other as we don't have the resources to validate both
- We chose k3d for these main reasons
- Smaller memory footprint
- Faster startup time
- Secure by default
- K3s supports the CIS Kubernetes Benchmark
- Based on K3s which is a certified Kubernetes distro
- Many customers run K3s on the edge as well as in CI-CD pipelines
- Rancher provides support - including 24x7 (for a fee)
- K3s has a vibrant community
- K3s is a CNCF sandbox project
- Team Working Agreement
- Team Engineering Practices
- CSE Engineering Fundamentals Playbook
This project uses GitHub Issues to track bugs and feature requests. Please search the existing issues before filing new issues to avoid duplicates. For new issues, file your bug or feature request as a new issue.
For help and questions about using this project, please open a GitHub issue.
This project welcomes contributions and suggestions. Most contributions require you to agree to a Contributor License Agreement (CLA) declaring that you have the right to, and actually do, grant us the rights to use your contribution. For details, visit https://cla.opensource.microsoft.com
When you submit a pull request, a CLA bot will automatically determine whether you need to provide a CLA and decorate the PR appropriately (e.g., status check, comment). Simply follow the instructions provided by the bot. You will only need to do this once across all repos using our CLA.
This project has adopted the Microsoft Open Source Code of Conduct. For more information see the Code of Conduct FAQ or contact [email protected] with any additional questions or comments.
This project may contain trademarks or logos for projects, products, or services.
Authorized use of Microsoft trademarks or logos is subject to and must follow Microsoft's Trademark & Brand Guidelines.
Use of Microsoft trademarks or logos in modified versions of this project must not cause confusion or imply Microsoft sponsorship.
Any use of third-party trademarks or logos are subject to those third-party's policies.


