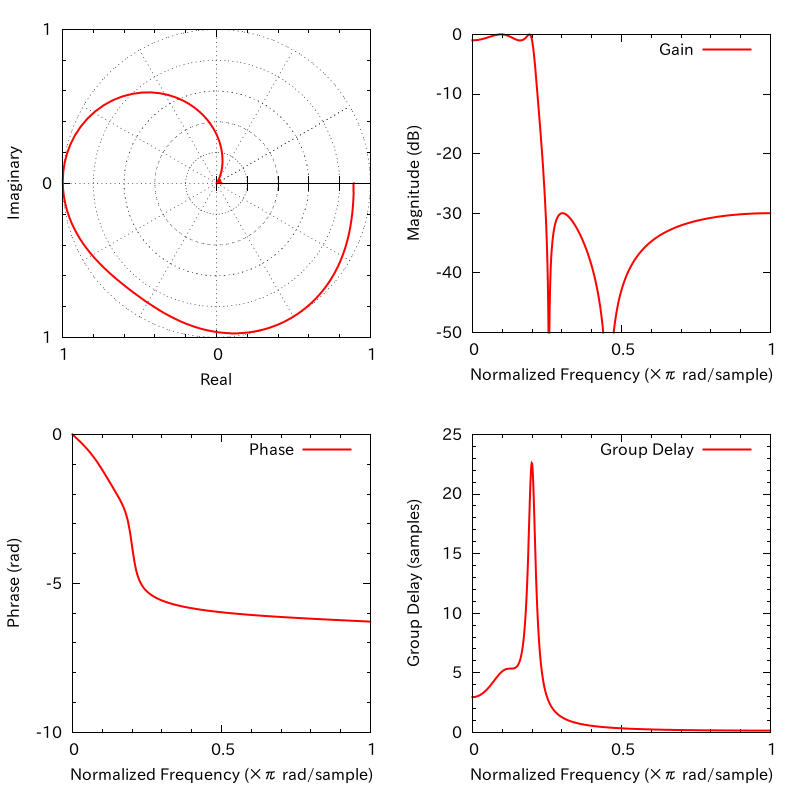
This tiny tool computes magnitude, phase characteristics and group delay from coefficients of IIR filter.
$ ./iir setting.txt out.dat
Each row of out.dat is consisted of five elements: frequency, magnitude, magnitude (dB), phase, and group delay (separated by a comma).
$ gnuplot show.plt
Or, if you want to export to PNG file:
$ gnuplot png.plt
$ git clone https://github.com/kmiya/iir.git
$ cd iir
$ make
You can change settings in the setting.txt.
begin: Staring frequency [0,1)end: Ending frequency (0,1]count: Sampling interval. It should be(end - begin)/[sampling freq], e.g.,0.001.a,b+[number]: Coefficients of an IIR filter.
The transfer function of a given IIR filter is computed according to the following equation:
Note that in most IIR filter designs coefficient b0 is 1.
This tool uses the convention of MATLAB, that is, unit frequency is the Nyquist frequency.
To convert normalized frequency to angular frequency around the unit circle, multiply by π. To convert normalized frequency back to hertz, multiply by half the sample frequency.
Frequency Response - MATLAB & Simulink
