library(ggplot2)
activity <- read.csv("./activity.csv", header=TRUE, colClasses=c("integer", "Date", "integer"))Splitting into daily data
dailyActivity <- split(activity, factor(activity$date))Totals, means and medians of the step count on daily basis
totals <- sapply(dailyActivity, function(x) { sum(x$steps, na.rm=TRUE)})

dates <- names(totals)
names(totals) <- NULL

means <- sapply(dailyActivity, function(x) { mean(x$steps, na.rm=TRUE)})
names(means) <- NULL

medians <- sapply(dailyActivity, function(x) { median(x$steps, na.rm=TRUE)})
names(medians) <- NULL

dailyStats <- data.frame(dates, totals, means, medians)
print(dailyStats)
## dates totals means medians
## 1 2012-10-01 0 NaN NA
## 2 2012-10-02 126 0.4375 0
## 3 2012-10-03 11352 39.4167 0
## 4 2012-10-04 12116 42.0694 0
## 5 2012-10-05 13294 46.1597 0
## 6 2012-10-06 15420 53.5417 0
## 7 2012-10-07 11015 38.2465 0
## 8 2012-10-08 0 NaN NA
## 9 2012-10-09 12811 44.4826 0
## 10 2012-10-10 9900 34.3750 0
## 11 2012-10-11 10304 35.7778 0
## 12 2012-10-12 17382 60.3542 0
## 13 2012-10-13 12426 43.1458 0
## 14 2012-10-14 15098 52.4236 0
## 15 2012-10-15 10139 35.2049 0
## 16 2012-10-16 15084 52.3750 0
## 17 2012-10-17 13452 46.7083 0
## 18 2012-10-18 10056 34.9167 0
## 19 2012-10-19 11829 41.0729 0
## 20 2012-10-20 10395 36.0938 0
## 21 2012-10-21 8821 30.6285 0
## 22 2012-10-22 13460 46.7361 0
## 23 2012-10-23 8918 30.9653 0
## 24 2012-10-24 8355 29.0104 0
## 25 2012-10-25 2492 8.6528 0
## 26 2012-10-26 6778 23.5347 0
## 27 2012-10-27 10119 35.1354 0
## 28 2012-10-28 11458 39.7847 0
## 29 2012-10-29 5018 17.4236 0
## 30 2012-10-30 9819 34.0938 0
## 31 2012-10-31 15414 53.5208 0
## 32 2012-11-01 0 NaN NA
## 33 2012-11-02 10600 36.8056 0
## 34 2012-11-03 10571 36.7049 0
## 35 2012-11-04 0 NaN NA
## 36 2012-11-05 10439 36.2465 0
## 37 2012-11-06 8334 28.9375 0
## 38 2012-11-07 12883 44.7326 0
## 39 2012-11-08 3219 11.1771 0
## 40 2012-11-09 0 NaN NA
## 41 2012-11-10 0 NaN NA
## 42 2012-11-11 12608 43.7778 0
## 43 2012-11-12 10765 37.3785 0
## 44 2012-11-13 7336 25.4722 0
## 45 2012-11-14 0 NaN NA
## 46 2012-11-15 41 0.1424 0
## 47 2012-11-16 5441 18.8924 0
## 48 2012-11-17 14339 49.7882 0
## 49 2012-11-18 15110 52.4653 0
## 50 2012-11-19 8841 30.6979 0
## 51 2012-11-20 4472 15.5278 0
## 52 2012-11-21 12787 44.3993 0
## 53 2012-11-22 20427 70.9271 0
## 54 2012-11-23 21194 73.5903 0
## 55 2012-11-24 14478 50.2708 0
## 56 2012-11-25 11834 41.0903 0
## 57 2012-11-26 11162 38.7569 0
## 58 2012-11-27 13646 47.3819 0
## 59 2012-11-28 10183 35.3576 0
## 60 2012-11-29 7047 24.4688 0
## 61 2012-11-30 0 NaN NA
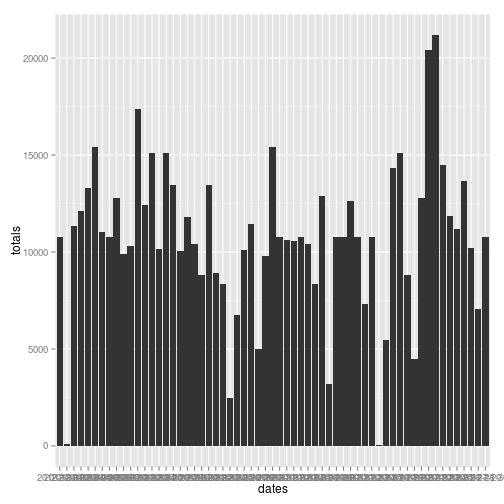
Histogram of daily total steps
g <- ggplot(dailyStats , aes(dates, totals))
g + geom_bar(stat="identity")Splitting into 5-minute-time-slot data
slotActivity <- split(activity, factor(activity$interval))Average step count on slot basis across all days
averages <- sapply(slotActivity, function(x) { mean(x$steps, na.rm=TRUE)})
totals <- sapply(slotActivity, function(x) { sum(x$steps, na.rm=TRUE)})

slotStats <- data.frame(slots=as.numeric(names(averages)), averages=as.vector(averages), totals=as.vector(totals))
Time series plot
qplot(slots, averages, data=slotStats, geom="line", group=1)Slot containing the maximum steps
maxValue <- max(slotStats$totals)
slotStats[slotStats$totals == maxValue, ]
## slots averages totals
## 104 835 206.2 10927
Report of total number of missing values
dataWithNA <- activity[is.na(activity$steps), ]
nrow(dataWithNA)
## [1] 2304
Patching NA's with the mean
for( i in 1:nrow(activity)) {
    if (is.na(activity[i, "steps"])) {
        slot <- activity[i, "interval"]
        averageValue <- slotStats[slotStats$slots == slot, "averages"]
        activity[i, "updated_steps"] <- averageValue
    } else {
        activity[i, "updated_steps"] <- activity[i, "steps"]
    }
}
Splitting into daily data (after patching)
dailyActivity <- split(activity, factor(activity$date))Totals, means and medians of the step count on daily basis
totals <- sapply(dailyActivity, function(x) { sum(x$updated_steps, na.rm=TRUE)})

dates <- names(totals)

means <- sapply(dailyActivity, function(x) { mean(x$updated_steps, na.rm=TRUE)})

medians <- sapply(dailyActivity, function(x) { median(x$updated_steps, na.rm=TRUE)})

dailyStatsAfterPatch <- data.frame(dates=dates, totals=as.vector(totals), means=as.vector(means), medians=as.vector(medians))
Histogram of daily total steps after patch
g <- ggplot(dailyStatsAfterPatch, aes(dates, totals))
g + geom_bar(stat="identity")activity$weekday <- weekdays(activity$date, abbreviate=TRUE)
for(i in 1:nrow(activity)) {
day <- activity[i, "weekday"]
if (day %in% c("Sat", "Sun")) {
activity[i, "dayType"] <- "weekend"
} else {
activity[i, "dayType"] <- "weekday"
}
}Taking averages across weekdays and weekends


