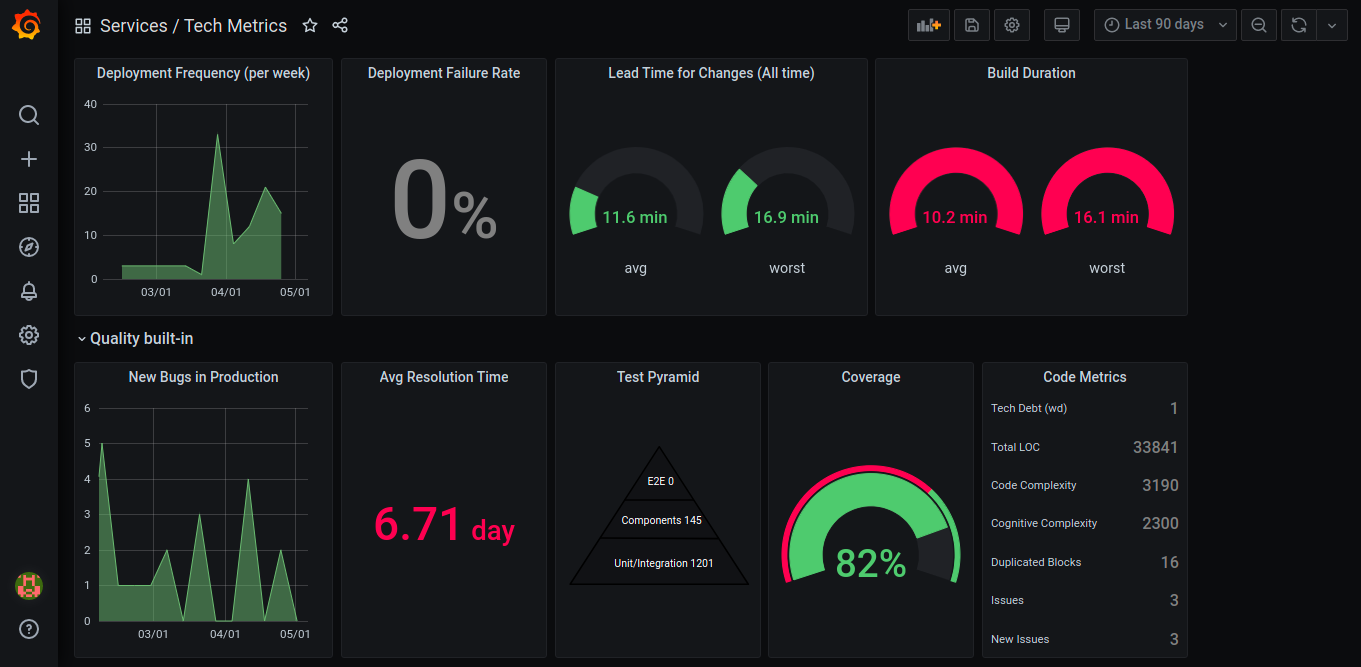
Stack responsible for providing technical and operational metrics to be visualized in grafana.
- Grafana: Responsible for dashboards, the ./grafana folder has all the configuration of datasources and dashboards to upload via docker.
- Influxdb: Timeseries database for metrics, is rising via docker with no mapped volume, so when the container dies the records are reset.
- Strapi: CMS for configurations, today we have two collections, datasources and custom-metrics.
- metrics-service: Service in nodeJS, responsible for reading the configurations of the strapi, and accessing the different datasources to obtain metrics, process them and insert in influxdb, in a recurring way according to the CRON configuration in the docker-compose.
- Docker
- Docker Compose
- Node 12+: just for development.
1 - Run
docker-compose up
2 - Then it is necessary to configure datasources for application via strapi, through: http://localhost:1337
Strapi datasorce is mandatory. The metrics-service application will be up, after you configure of the 1st time strapi datasource inside Strapi.
Default access: user: [email protected] pass: techmetrics
3 - That done, just access the grafana at http://localhost:3000 with username and password "admin".
Datasources are implementations of external providers, who must make the data available through Rest APIs, currently the following providers are available:
New providers can be implemented, for jenkins, GOCD, among other possibilities, for that it is necessary:
Create a new provider in:
./metrics-service/src/providers/provider_name
Follow sonar.provider as an example.
Then it is necessary to add it to the Record of provider.factory:
const providers: Record<string, ProviderFunction> = {
  azure: getAzureMetrics,
  sonar: getSonarMetrics,
  strapi: getStrapiMetrics,
  new_provider: getNewProviderMetrics(),
};
That done, it is enough that a new datasource is registered pointing to this provider within the strapi.
Ex: When you have changes in the strep meta, it is necessary to clean jira_bug and jira_hour in the BD
1 - pause metrics service container docker stop ID_CONTAINER
2 - access influx container docker exec -it ID_CONTAINER bash influx use devops DROP MEASUREMENT jira_bug DROP MEASUREMENT jira_hour exit
3 - Up container metrics service docker start ID_CONTAINER
After up the containers, if the information is not showing in the dashboard, look at the metrics-service log to analyze
docker-compose logs -f --tails=1000 metrics-service
https: use protected key via URL: https://id.atlassian.com/ http: basic auth works normally


