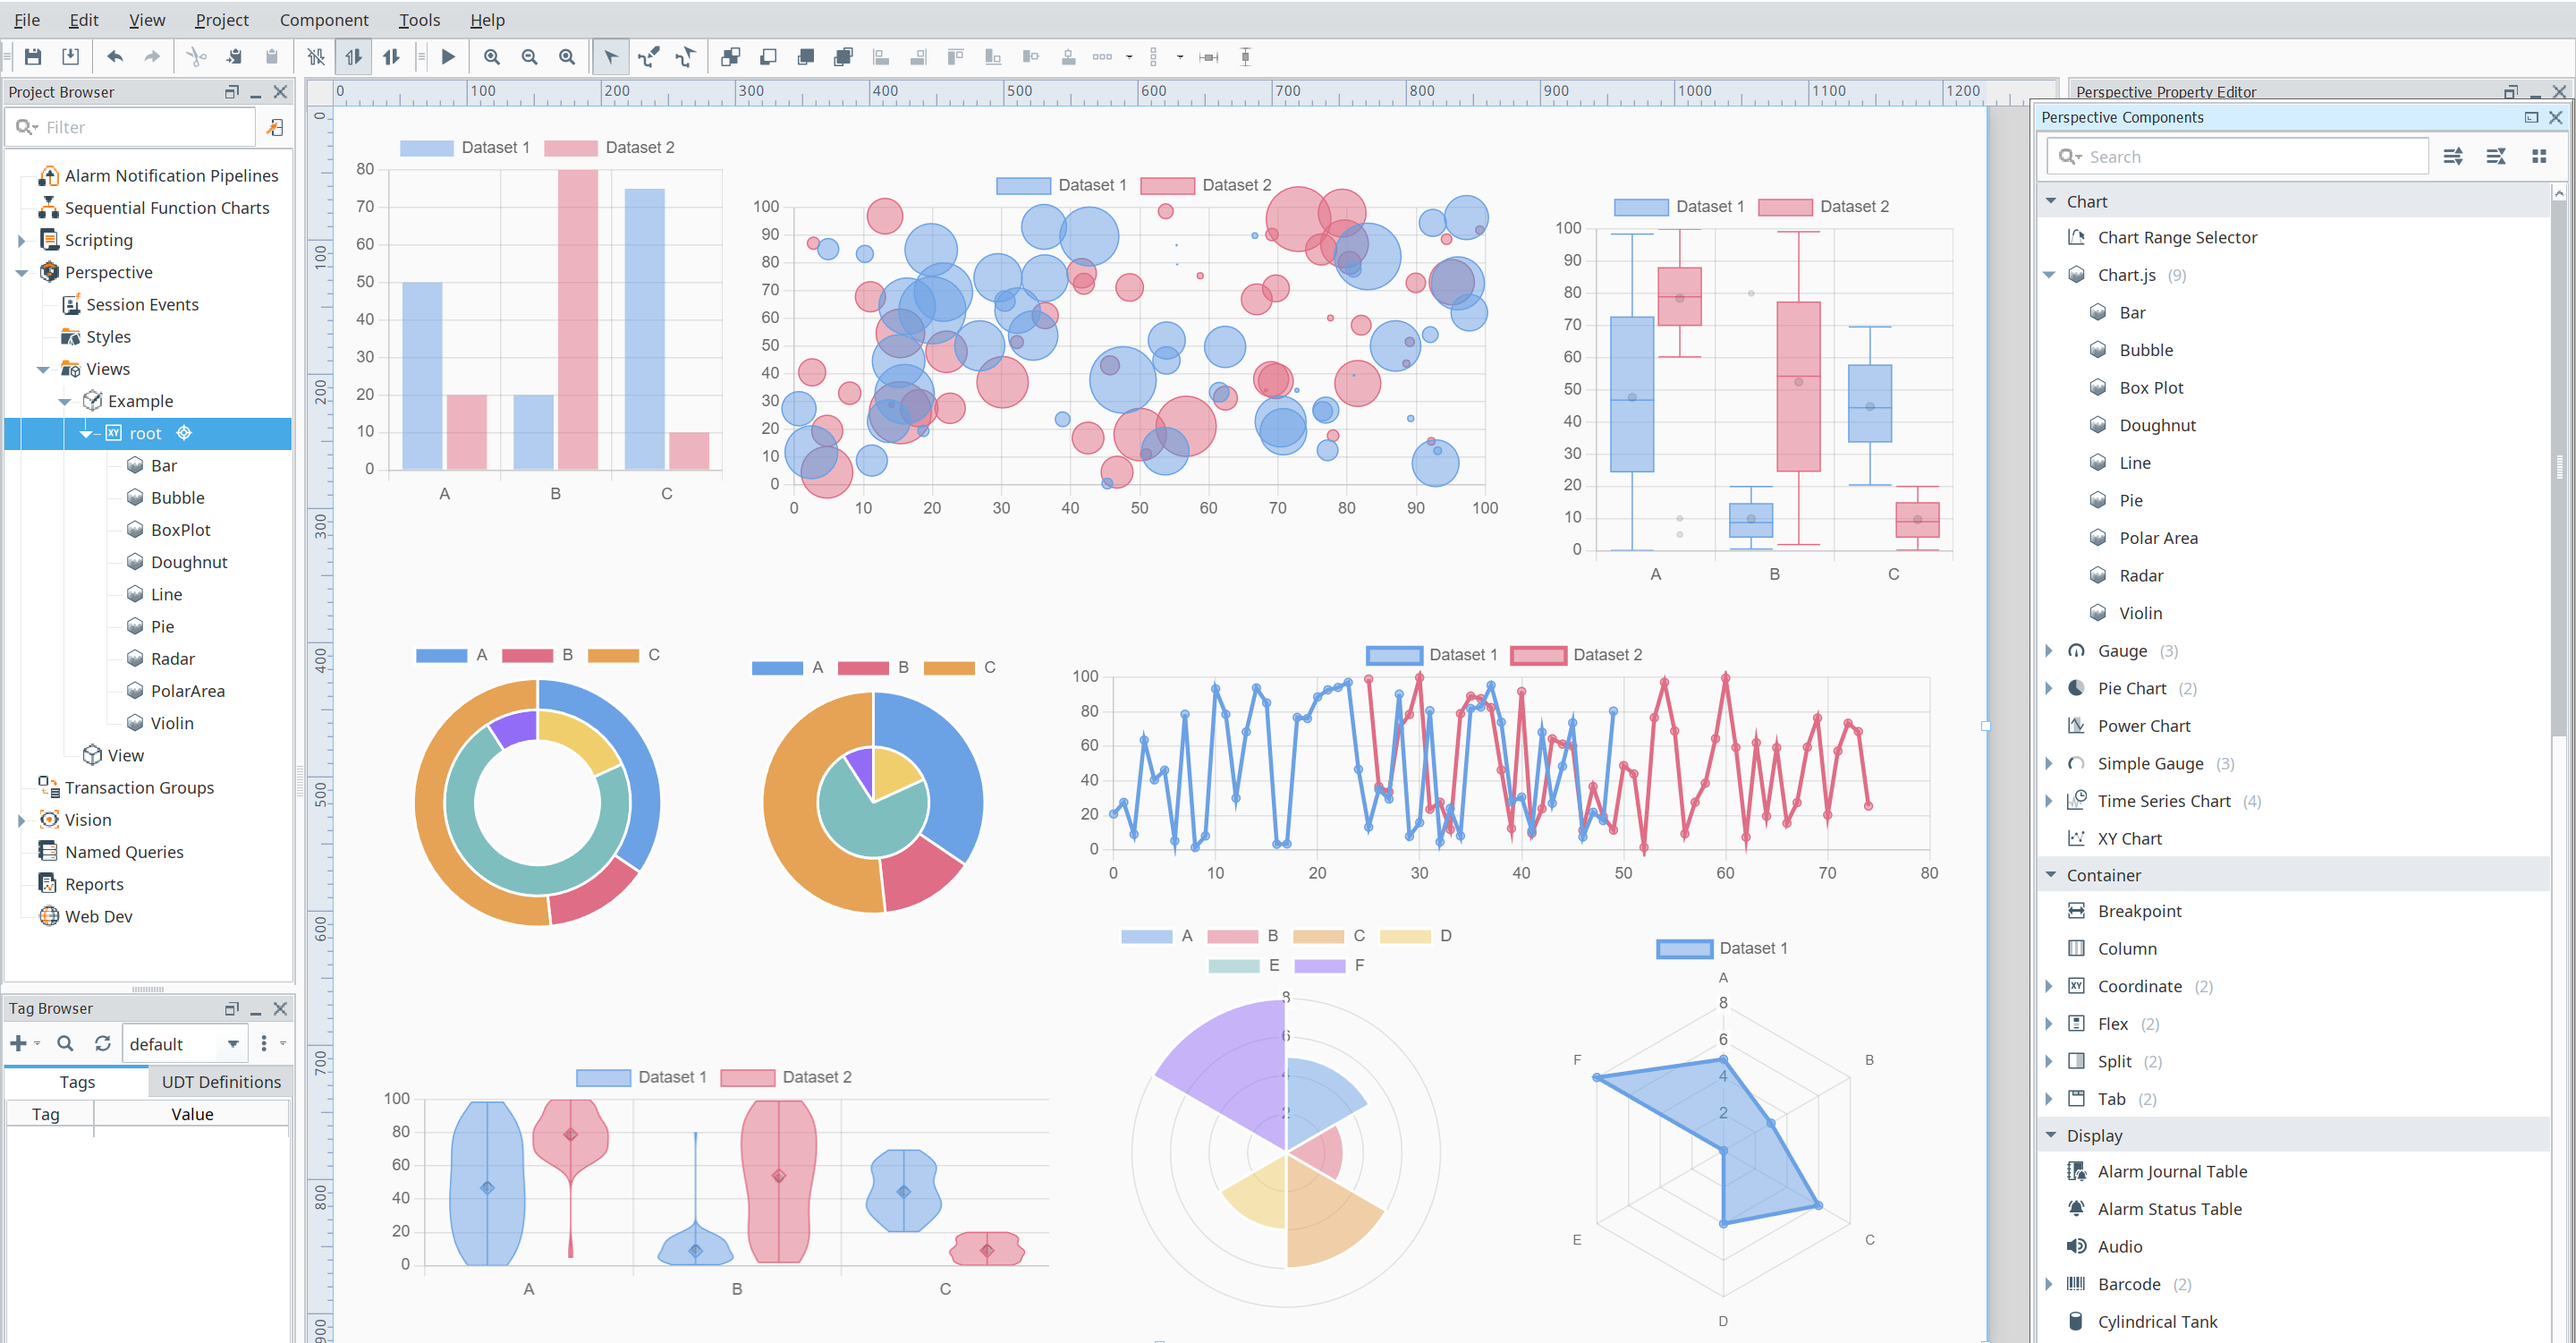
A module for Ignition that adds a collection of enhanced Perspective charting components.
- Download the latest version from releases.
- Install the module through the Ignition Gateway web interface.
- Module documentation is available at docs.mussonindustrial.com.
| Name | Category | Description |
|---|---|---|
| Chart.js Component | Charting | Chart.js renders chart elements on an HTML5 canvas unlike other D3.js-based charting libraries that render as SVG. Canvas rendering makes Chart.js very performant, especially for large datasets and complex visualizations that would otherwise require thousands of SVG nodes in the DOM tree. |
The changelog is regularly updated to reflect what's changed in each new release.
Maintenance of this project is made possible by all the contributors and sponsors. If you'd like to sponsor this project and have your avatar or company logo appear below click here. 💖


