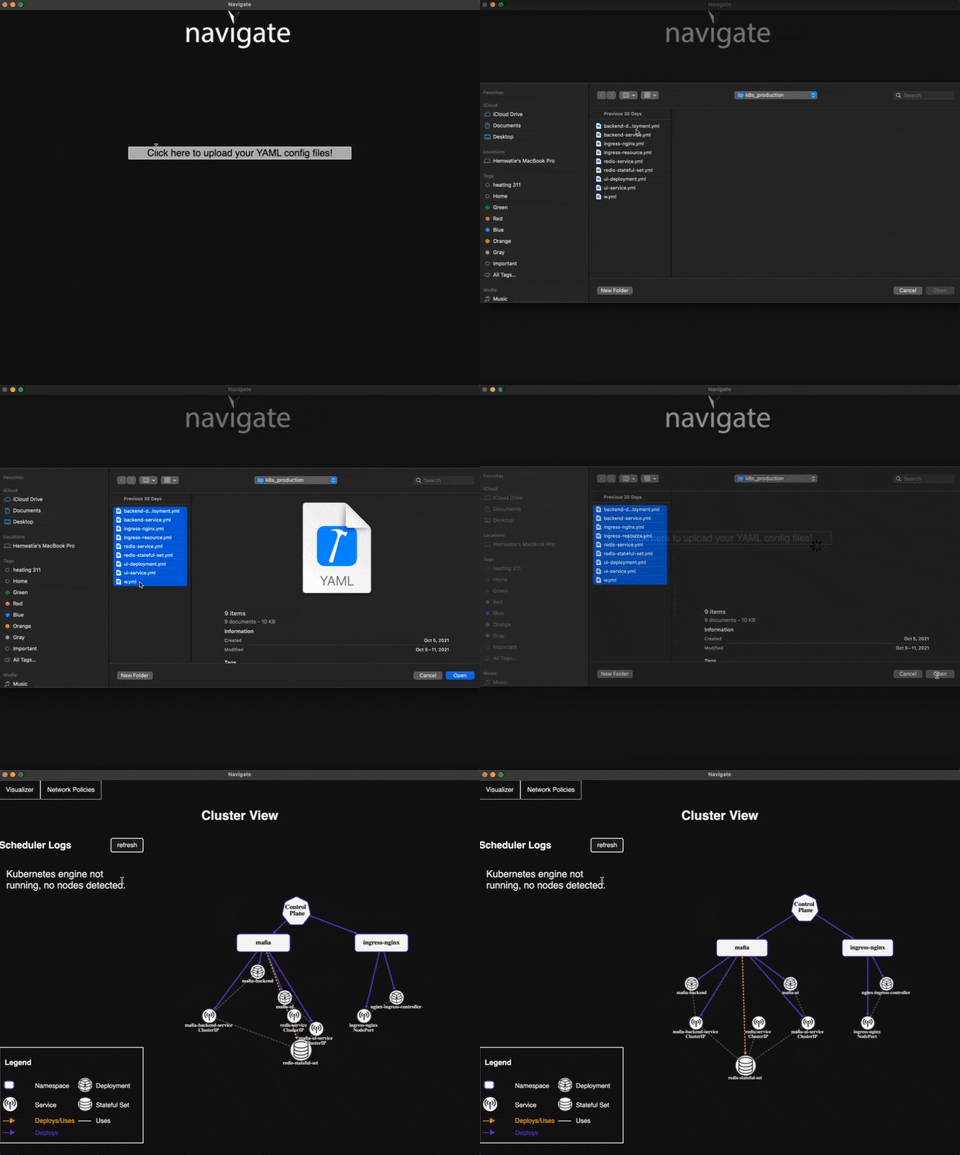
A visual overview of your Kubernetes cluster - with network policies, scheduler decisions, and live logs.
Whether the cluster is live or not, upload your YAML config files to Navigate. Here you can see the network structure of your cluster, observing
the connections between your stateful sets, deployments, services, and other Kubernetes objects.

You can double check for mistakes!
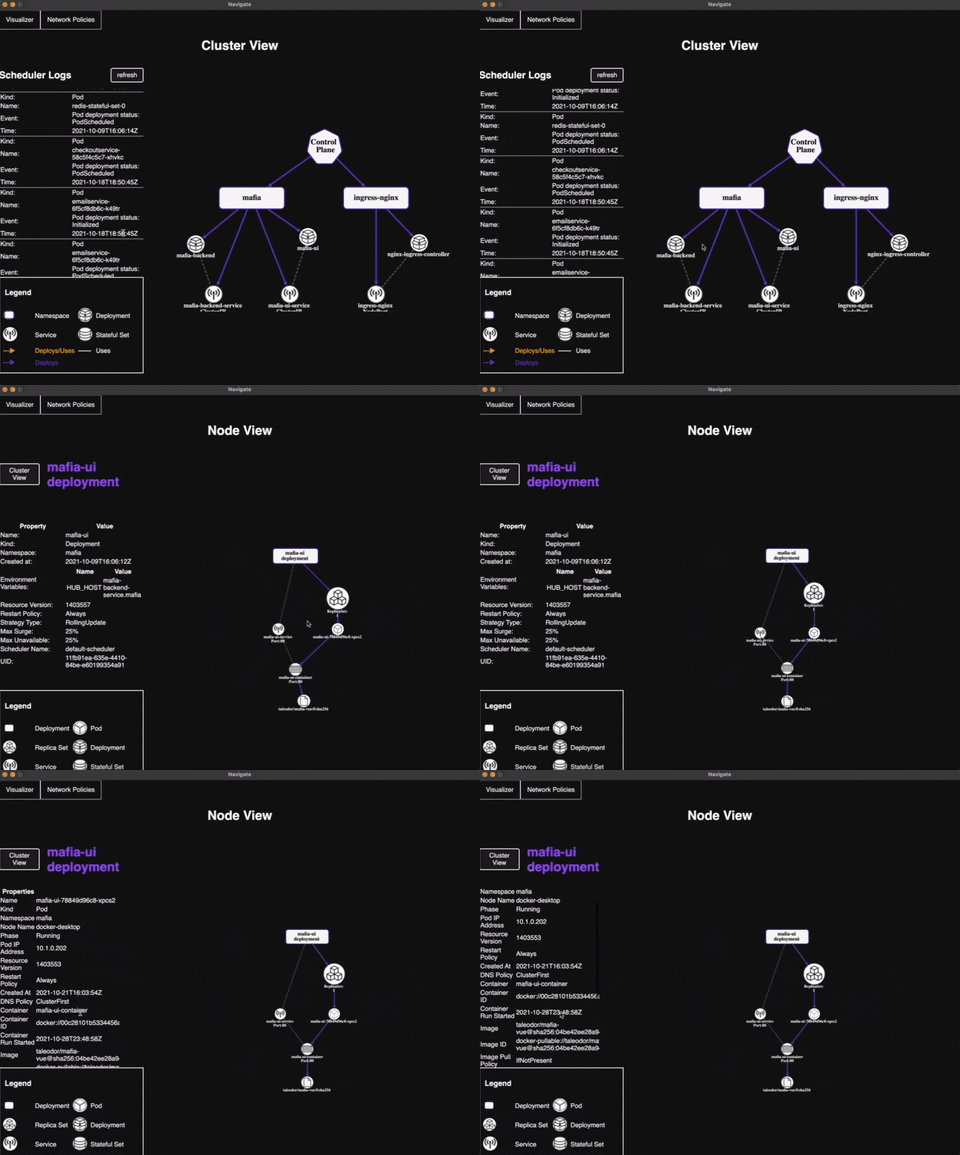
Click on the deployment nodes in your graph to zoom into the Node View, seeing the various containers and connections each deployment brings.
Want to check that your network policies are correct? Use the "Network Policies" tab to view them all, one at a time.

While the cluster is live, see:
- etcd/node scheduler decisions, aggregated across many different logs
- live deployment data, including statuses and conditions
- live pod data that you would normally only get with
kubectlcommands
Prerequisites: npm
FOR WINDOWS USERS: you will need to run npm run server & npm run dev instead - Electron app coming soon.
Here are the steps for getting started after cloning:
- Run
npm install, then runnpm run buildfollowed bynpm run bothin your terminal. - From there, the dev server should launch, and you will be prompted to upload your Kubernetes yaml config files. The app will display your cluster in a network graph without your Kubernetes cluster running. At this point, only deployments and pods can be interacted with in the graph.
- To see live deployment and pod log data, your cluster needs to be currently running on your system.
- If there are network policy objects within your files, the top left network policy tab will provide a dropdown menu so you can inspect each policy.
Currently, we are working on packaging and distributing our app cross-platform via electron. Right now the alpha version for macOS is out, which you can find on our website.
We're actively developing! If you've found a bug or want to help, feel free to take a look at our Issues.


