x1 = c(3, 2, 4, 1, 2, 4, 4)
x2 = c(4, 2, 4, 4, 1, 3, 1)
colors = c("red", "red", "red", "red", "blue", "blue", "blue")
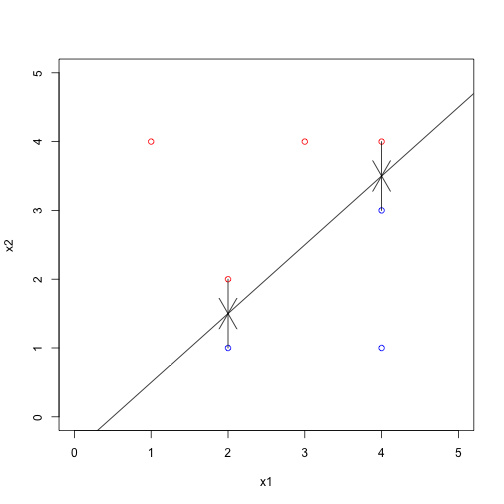
plot(x1, x2, col = colors, xlim = c(0, 5), ylim = c(0, 5))The maximal margin classifier has to be in between observations #2, #3 and #5, #6.
plot(x1, x2, col = colors, xlim = c(0, 5), ylim = c(0, 5))
abline(-0.5, 1)plot(x1, x2, col = colors, xlim = c(0, 5), ylim = c(0, 5))
abline(-0.5, 1)
abline(-1, 1, lty = 2)
abline(0, 1, lty = 2)plot(x1, x2, col = colors, xlim = c(0, 5), ylim = c(0, 5))
abline(-0.5, 1)
arrows(2, 1, 2, 1.5)
arrows(2, 2, 2, 1.5)
arrows(4, 4, 4, 3.5)
arrows(4, 3, 4, 3.5)A slight movement of observation #7 (4,1) blue would not have an effect on the maximal margin hyperplane since its movement would be outside of the margin.
plot(x1, x2, col = colors, xlim = c(0, 5), ylim = c(0, 5))
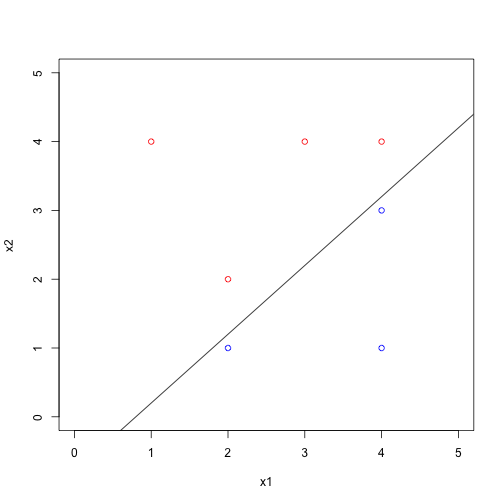
abline(-0.8, 1)plot(x1, x2, col = colors, xlim = c(0, 5), ylim = c(0, 5))
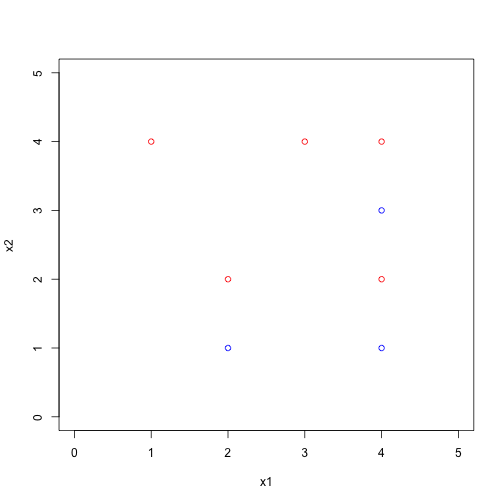
points(c(4), c(2), col = c("red"))


