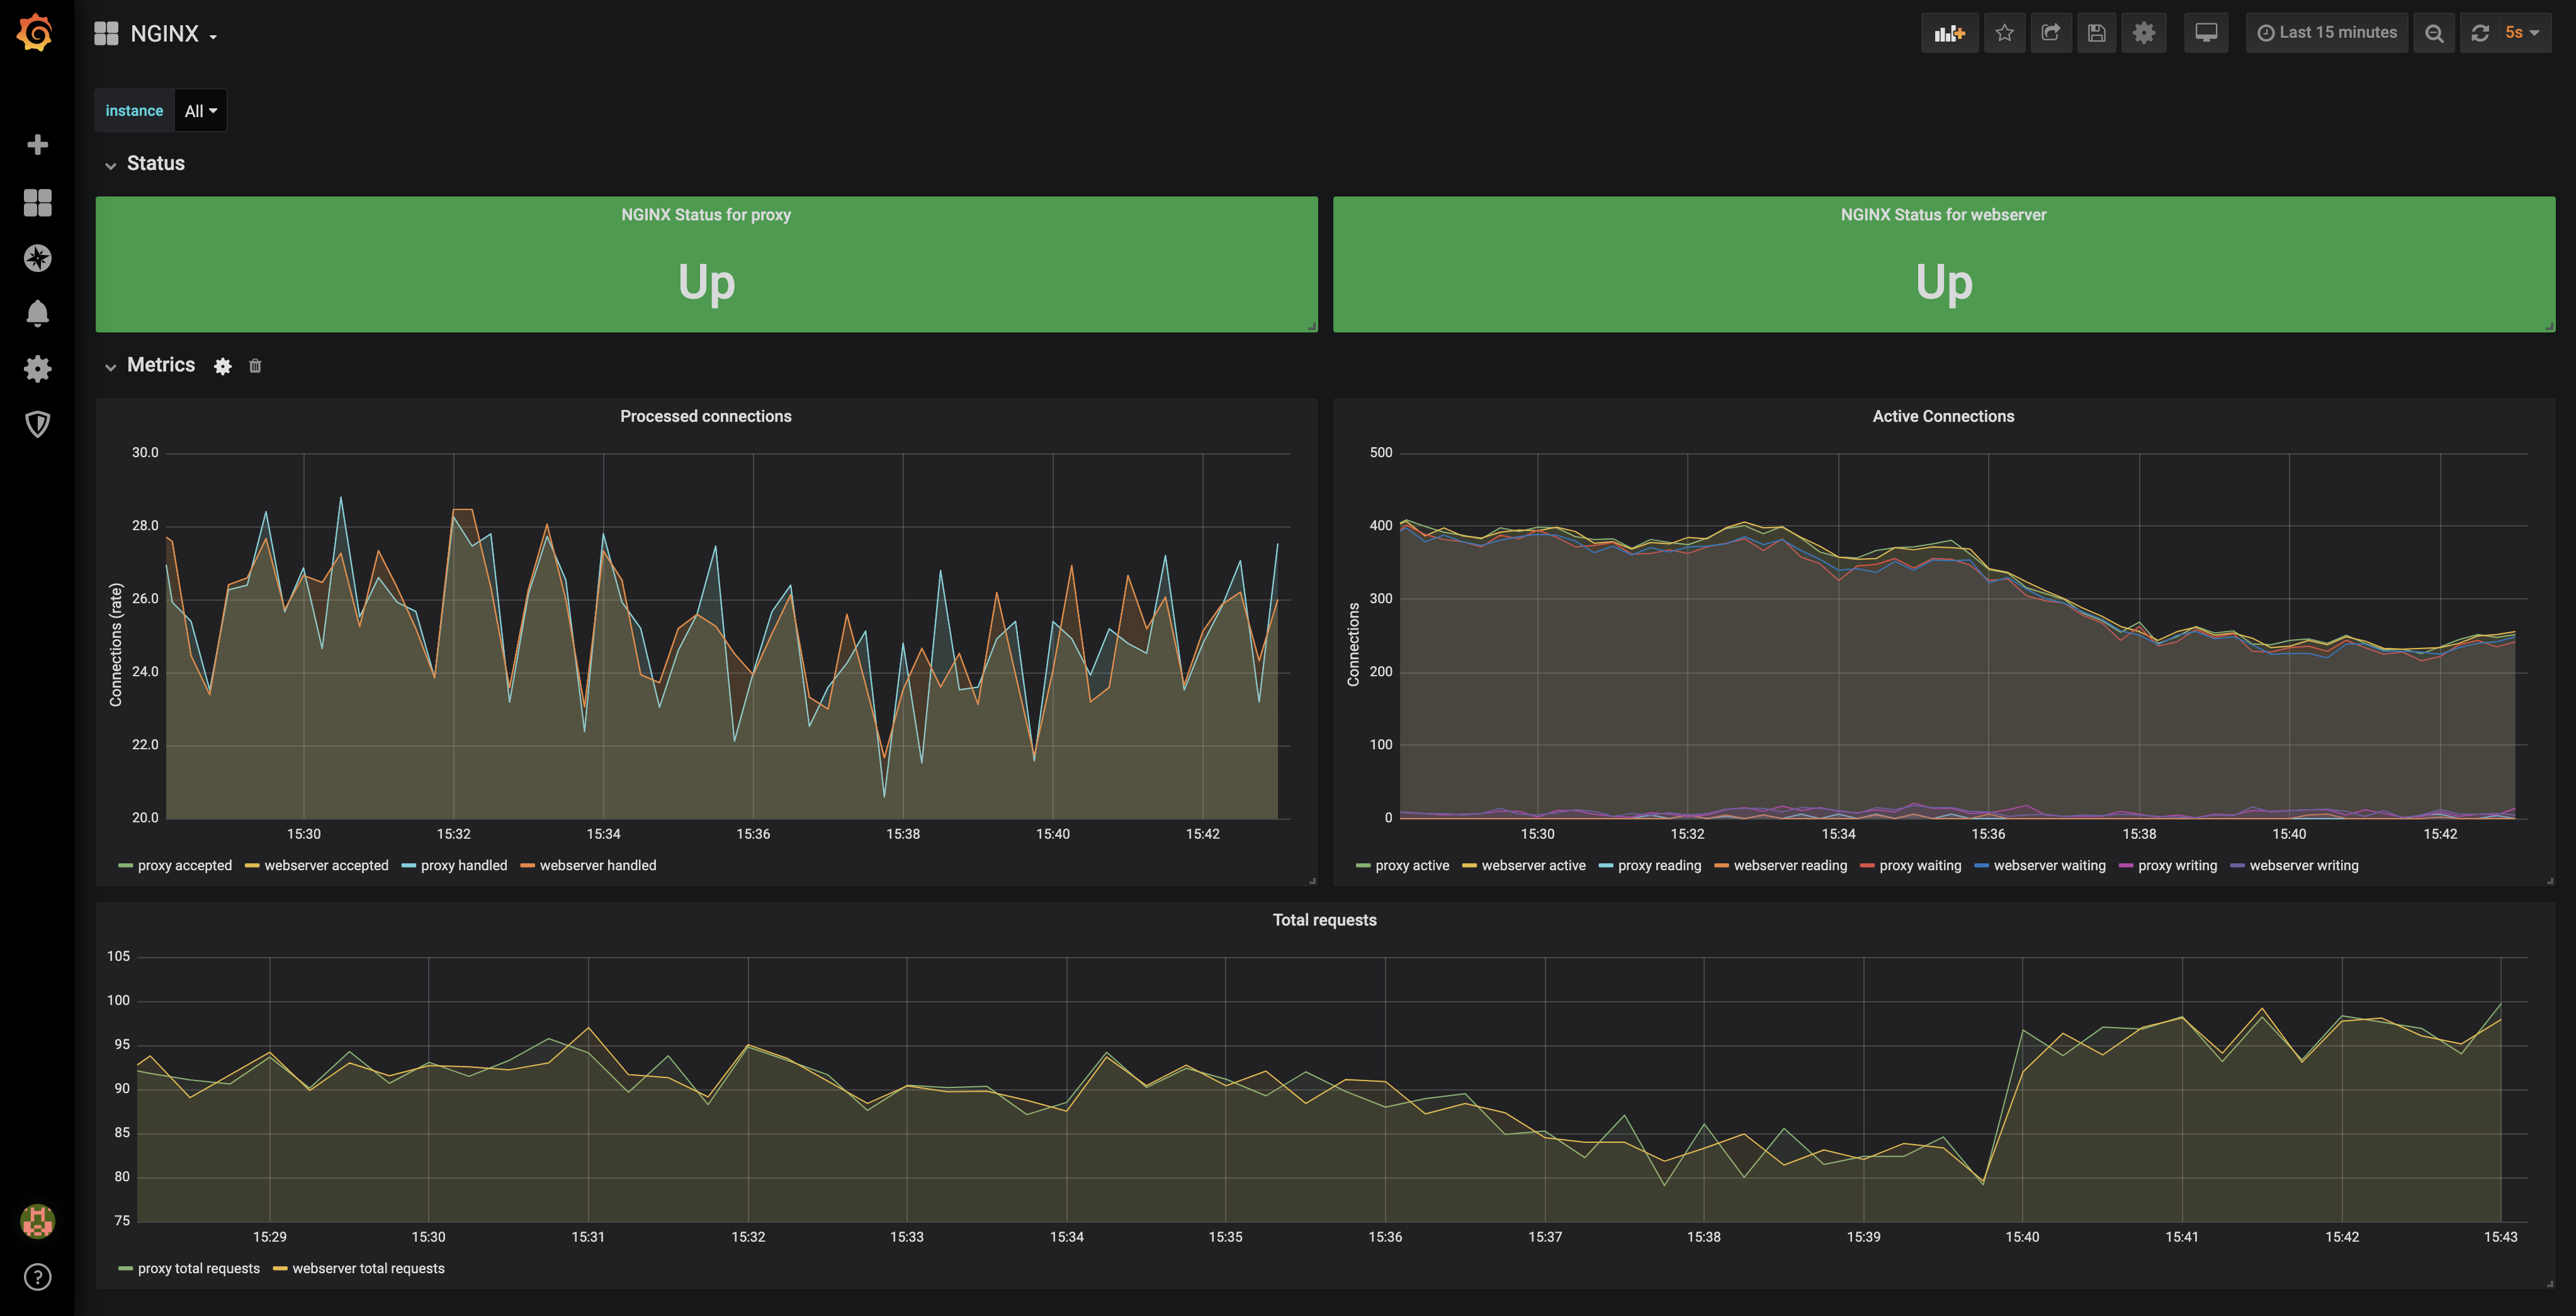
We provide the official Grafana dashboard that visualizes the NGINX metrics exposed by the exporter. The dashboard allows you to filter metrics per instance or see the metrics from all instances.
The dashboard has been tested with the following software versions:
- NGINX Prometheus Exporter >= 0.4.1
- Grafana >= v5.0.0
- Prometheus >= v2.0.0
A Prometheus data source needs to be added before installing the dashboard.
In the Grafana UI complete the following steps:
- Use the New Dashboard button and click Import.
- Upload
dashboard.jsonor copy and paste the contents of the file in the textbox and click Load. - Set the Prometheus data source and click Import.
- The dashboard will appear. Note how you can filter the instance label just below the dashboard title (top left corner). This allows you to filter metrics per instance. By default, all instances are selected.
The dashboard comes with 2 rows with the following graphs for NGINX metrics:
- Status
- Up/Down graph per instance. It shows the
nginx_upmetric.
- Up/Down graph per instance. It shows the
- Metrics
- Processed connections (
nginx_connections_acceptedandnginx_connections_handledmetrics). This graph shows an irate in a range of 5 minutes. Useful for seeing the variation of the processed connections in time. - Active connections (
nginx_connections_active,nginx_connections_reading,nginx_connections_waitingandnginx_connections_writing). Useful for checking what is happening right now. - Total Requests with an irate (5 minutes range too) of the total number of client requests (
nginx_http_requests_total) over time.
- Processed connections (
