In this workshop you will learn about the main concepts related to advanced analytics and Big Data processing and how Azure Data Services can be used to implement a modern data warehouse architecture. You will learn what Azure services you can leverage to establish a solid data platform to quickly ingest, process and visualise data from a large variety of data sources. The reference architecture you will build as part of this exercise has been proven to give you the flexibility and scalability to grow and handle large volumes of data and keep an optimal level of performance.
In the exercises in this lab you will build data pipelines using data related to New York City. The workshop was designed to progressively implement an extended modern data platform architecture starting from a traditional relational data pipeline. Then we introduce big data scenarios with large data files and distributed computing. We add non-structured data and AI into the mix and finish off with real-time stream analytics. You will have done all of that by the end of the workshop.
The workshop can be completed on your own pace depending on your previous experince with the Azure DP tools. Supporting slides are available for each format.
| Activity | Duration |
|---|---|
| Workshop Overview | 15 minutes |
| Modern Data Platform Concepts: Part I | 15 minutes |
| Modern Data Warehousing | |
| Lab 1: Load Data into Azure Synapse Analytics using Azure Data Factory Pipelines | 45 minutes |
| Modern Data Platform Concepts: Part II | 15 minutes |
| Lab 2: Transform Big Data using Azure Data Factory Mapping Data Flows | 60 minutes |
| Advanced Analytics | |
| Modern Data Platform Concepts: Part III | 15 minutes |
| Lab 3: Explore Big Data using Azure Databricks | 45 minutes |
| Modern Data Platform Concepts: Part IV | 15 minutes |
| Lab 4: Add AI to your Big Data Pipeline with Cognitive Services | 75 minutes |
| Real-time Analytics | |
| Modern Data Platform Concepts: Part V | 15 minutes |
| Lab 5: Ingest and Analyse real-time data with Event Hubs and Stream Analytics | 45 minutes |
The workshop content will be delivered over the course of two days with the following agenda:
| Activity | Duration |
|---|---|
| Workshop Overview | 45 minutes |
| Lab 0: Deploy Azure Data Platform End2End to your subscription | 30 minutes |
| Modern Data Platform Concepts: Part I | 90 minutes |
| Modern Data Warehousing | |
| Lab 1: Load Data into Azure Synapse Analytics using Azure Data Factory Pipelines | 45 minutes |
| Modern Data Platform Concepts: Part II | 90 minutes |
| Lab 2: Transform Big Data using Azure Data Factory and Azure Synapse Analytics | 60 minutes |
| Activity | Duration |
|---|---|
| Advanced Analytics | |
| Modern Data Platform Concepts: Part III | 60 minutes |
| Lab 3: Explore Big Data using Azure Databricks | 45 minutes |
| Modern Data Platform Concepts: Part IV | 60 minutes |
| Lab 4: Add AI to your Big Data Pipeline with Cognitive Services | 75 minutes |
| Real-time Analytics | |
| Modern Data Platform Concepts: Part V | 60 minutes |
| Lab 5: Ingest and Analyse real-time data with Event Hubs and Stream Analytics | 45 minutes |
IMPORTANT:
-
The reference architecture proposed in this workshop aims to explain just enough of the role of each of the Azure Data Services included in the overall modern data platform architecture. This workshop does not replace the need of in-depth training on each Azure service covered.
-
The services covered in this course are only a subset of a much larger family of Azure services. Similar outcomes can be achieved by leveraging other services and/or features not covered by this workshop. Specific business requirements may require the use of different services or features not included in this workshop.
-
Some concepts presented in this course can be quite complex and you may need to seek more information from different sources to compliment your understanding of the Azure services covered.
Microsoft recently announced Azure Synapse Analytics as the evolution of Azure SQL Data Warehouse, blending big data, data warehousing, and data integration into a single service for end-to-end analytics at cloud scale. This reference architecture and workshop content will be updated as announced features in the roadmap become publicly available. For more information please visit: https://azure.microsoft.com/en-au/services/synapse-analytics/
This document contains detailed step-by-step instructions on how to implement a Modern Data Platform architecture using Azure Data Services. It’s recommended you carefully read the detailed description contained in this document for a successful experience with all Azure services.
You will see the label IMPORTANT whenever a there is a critical step to the lab. Please pay close attention to the instructions given.
You will also see the label IMPORTANT at the beginning of each lab section. As some instructions need to be executed on your host computer while others need to be executed in a remote desktop connection (RDP), this IMPORTANT label states where you should execute the lab section. See example below:
| IMPORTANT |
|---|
| Execute these steps on your host computer |
New York City data used in this lab was obtained from the New York City Open Data website: https://opendata.cityofnewyork.us/. The following datasets were used:
- NYPD Motor Vehicle Collisions: https://data.cityofnewyork.us/Public-Safety/NYPD-Motor-Vehicle-Collisions/h9gi-nx95
- TLC Yellow Taxi Trip Data: https://www1.nyc.gov/site/tlc/about/tlc-trip-record-data.page
The following prerequisites must be completed before you start these labs:
-
You must be connected to the internet;
-
Use either Edge or Chrome when executing the labs. Internet Explorer may have issues when rendering the UI for specific Azure services.
-
You must have a Pay-As-You-Go Azure account with administrator- or contributor-level access to your subscription. If you don’t have an account, you can sign up for an account following the instructions here: https://azure.microsoft.com/en-au/pricing/purchase-options/pay-as-you-go/.
IMPORTANT: Azure free subscriptions have quota restrictions that prevent the workshop resources from being deployed successfully. Please use a Pay-As-You-Go subscription instead.
IMPORTANT: When you deploy the lab resources in your own subscription you are responsible for the charges related to the use of the services provisioned. For more information about the list of services and tips on how to save money when executing these labs, please visit the Cost Management section of the Lab 0: Deploy Azure Data Platform End2End to your subscription page. -
Labs 1 to 4 require you to open a Remote Desktop Connection (RDP) to Azure Virtual Machines. If you are using a Mac, please ensure you have the latest version of the Microsoft Remote Desktop software installed: https://apps.apple.com/us/app/microsoft-remote-desktop-10/id1295203466?mt=12
-
Lab 5 requires you to have a Power BI Pro account. If you don’t have an account you can sign up for a 60-day trial for free here: https://powerbi.microsoft.com/en-us/power-bi-pro/
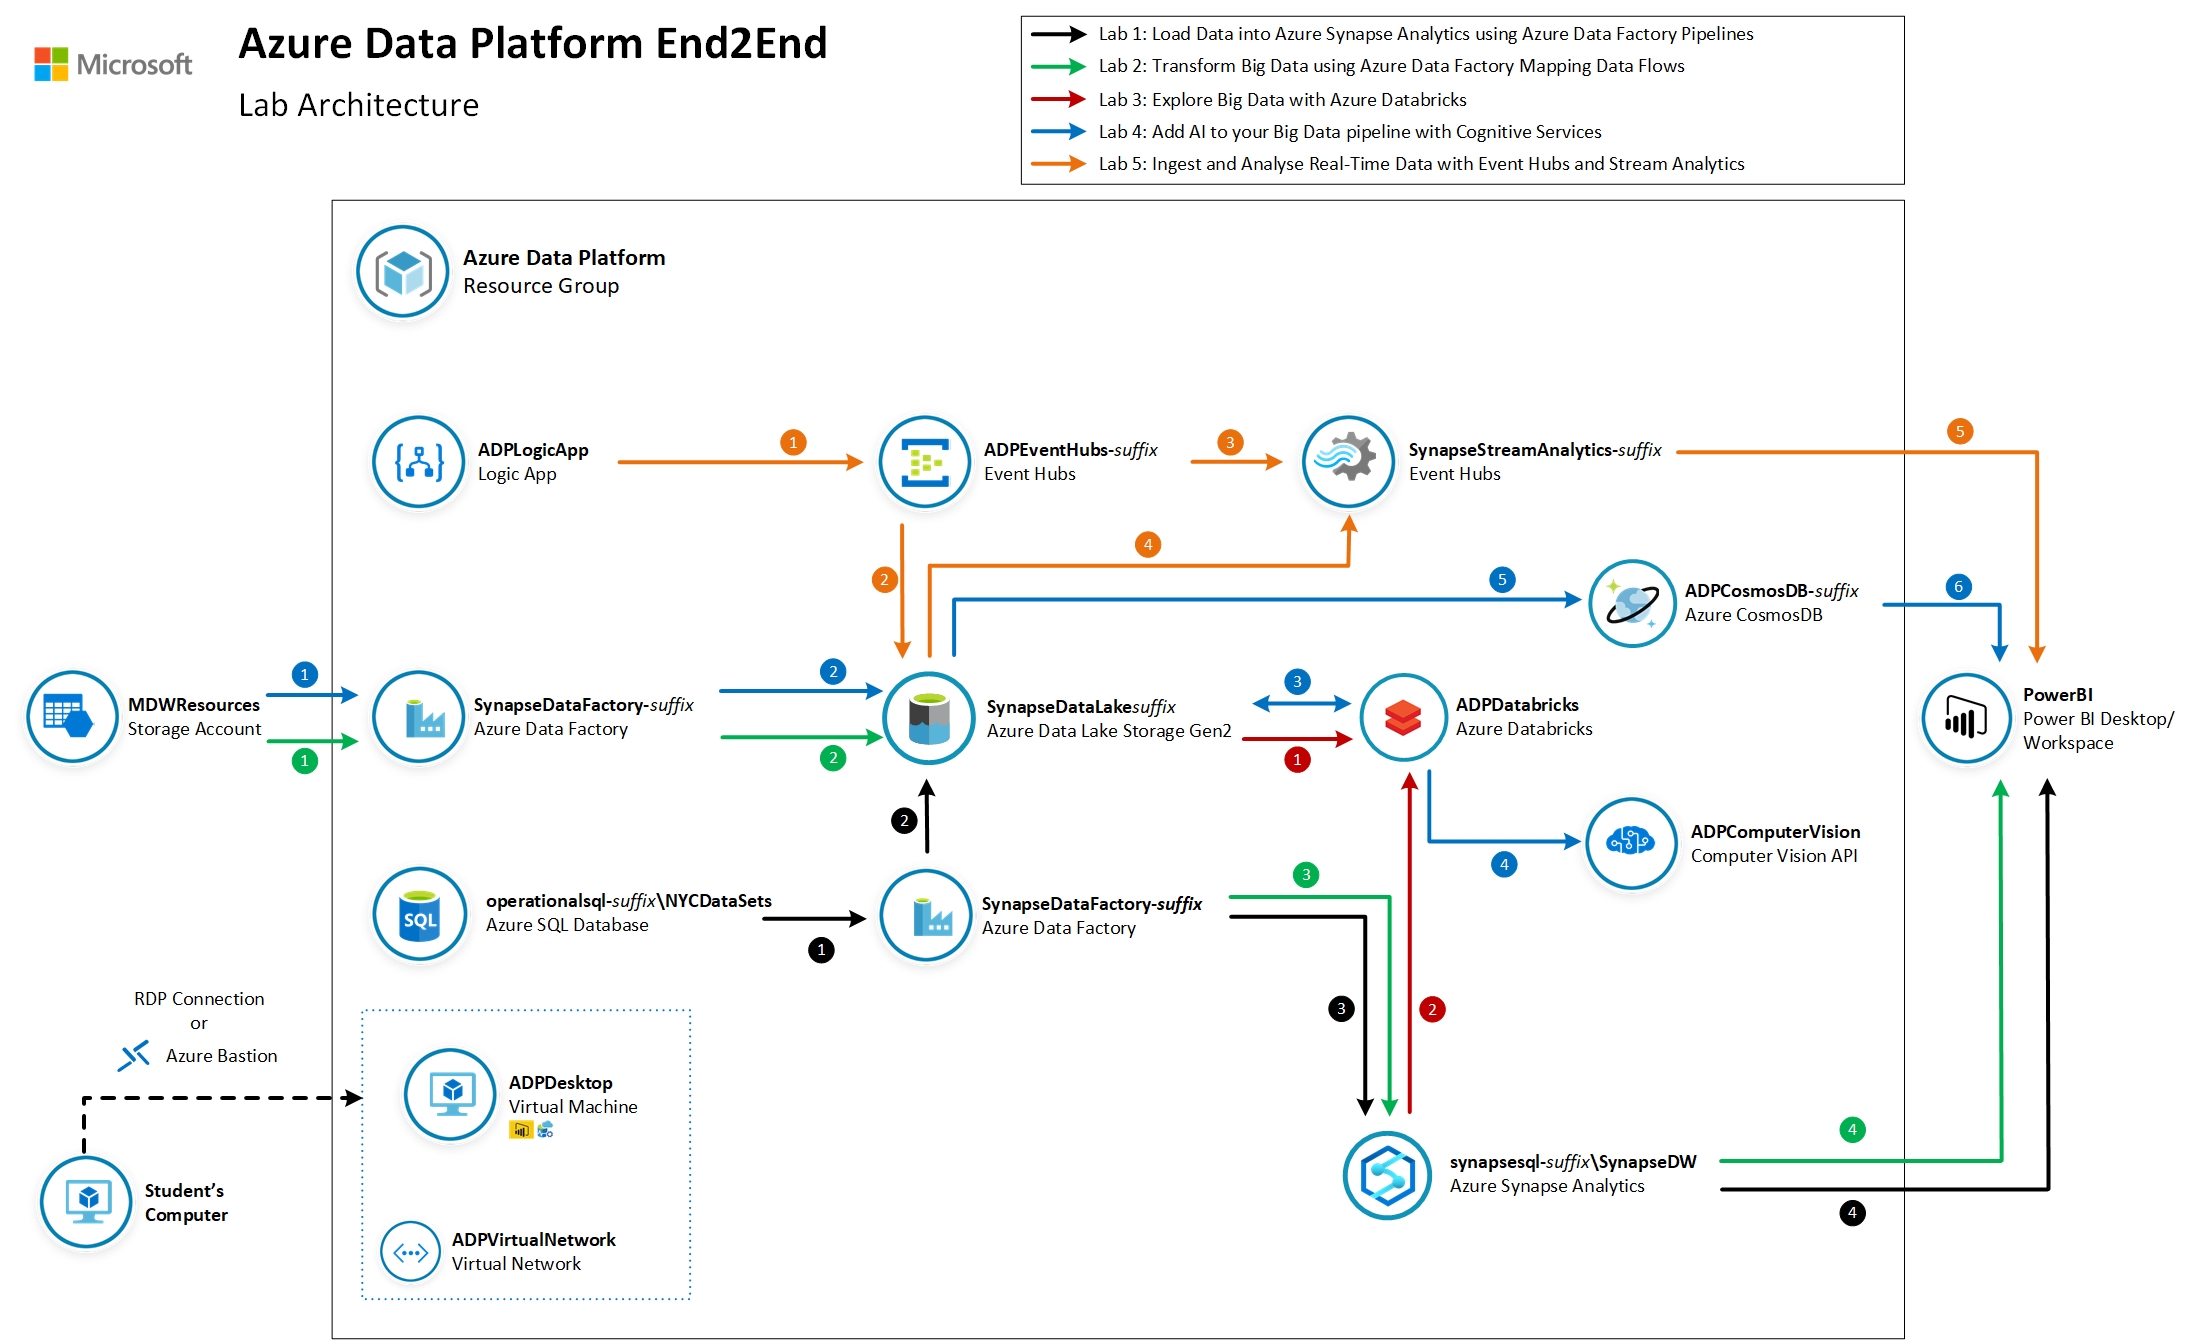
Throughout a series of 5 labs you will progressively implement a modern data platform architecture using datasets from New York City.
You will start ingesting relational data about motorvehicle collisions in Manhattan hosted in an Azure SQL Database into your Azure Synapse Analytics data warehouse. Then we will introduce the concepts of data lake and big data challenges and you will put these into practice by ingesting and processing over 50 million yellow taxi ride records stored as large data files stored in your data lake.
You will then use Databricks and the power of Spark clusters to explore big data files. Then you will incorporate AI into your data pipeline by invoking the Cognitive Services Computer Vision API to automatically generate metadata for New York City street photographs and store the metadata in a Cosmos DB database. Finally, you will use a LogicApp to simulate high-frequency stock purchase transactions as a source of streaming events that you will capture, store and process in real time with Event Hubs, Stream Analytics and Power BI.
By the end of the workshop you will have implemented the lab architecture referenced below:
IMPORTANT: You should skip this Lab if you are executing the labs through subscriptions provided by CloudLabs. All Azure services will be deployed as you activate your registration.
In this section you will automatically provision all Azure resources required to complete labs 1 though to 5. We will use a pre-defined ARM template with the definition of all Azure services used to ingest, store, process and visualise data.
The estimated time to complete this lab is: 30 minutes.
| IMPORTANT |
|---|
| In order to avoid potential delays caused by issues found during the ARM template deployment it is recommended you execute Lab 0 prior to Day 1. |
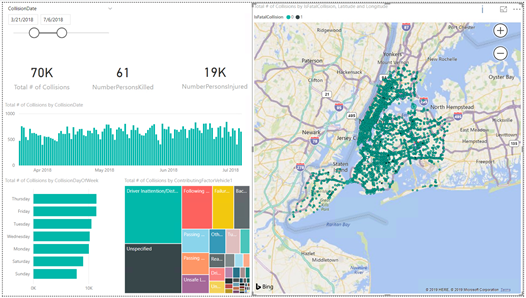
In this lab, the dataset you will use contains data about motor vehicle collisions that happened in New Your City from 2012 to 2019 stored in a relational database. You will configure the Azure environment to allow relational data to be transferred from an Azure SQL Database to an Azure Synapse Analytics data warehouse using Azure Data Factory also staging to Azure Data Lake storage. You will use Power BI to visualise collision data loaded from your Azure Synapse data warehouse.
The estimated time to complete this lab is: 45 minutes.
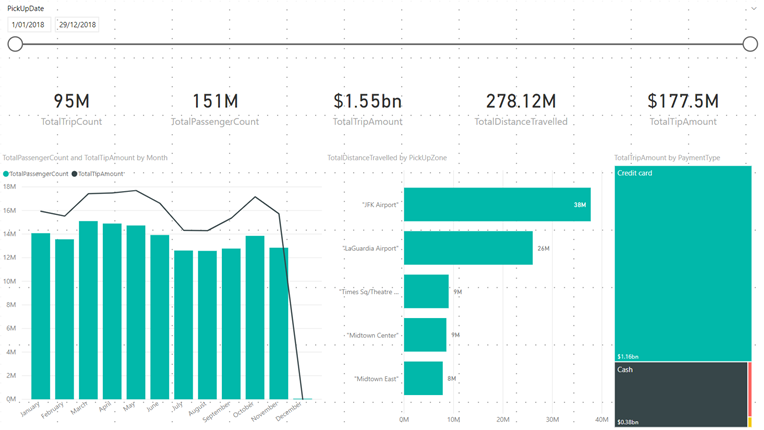
In this lab the dataset you will use contains detailed New York City Yellow Taxi rides for the first half of 2019. You will use Azure Data Factory to download large data files to your data lake. You will generate a daily aggregated summary of all rides from data lake using Mapping Data Flows and save the resulting dataset in your Azure Synapse Analytics. You will use Power BI to visualise summarised taxi ride data.
The estimated time to complete this lab is: 60 minutes.
In this lab you will use Azure Databricks to explore the New York Taxi data files you saved in your data lake in Lab 2. Using a Databricks notebook you will connect to the data lake and query taxi ride details for data cleasning and to apply standard column definitions for the resulting dataset. At the completion, The resulting dataset should be saved in a Spark table using Parquet files sitting in the NYCTaxiData-Curated container in your SynapseDataLake storage account.
The estimated time to complete this lab is: 45 minutes.
In this lab you will use Azure Data Factory to download New York City images to your data lake. Then, as part of the same pipeline, you are going to use an Azure Databricks notebook to invoke Computer Vision Cognitive Service to generate metadata documents and save them in back in your data lake. The Azure Data Factory pipeline then finishes by saving all metadata information in a Cosmos DB collection. You will use Power BI to visualise NYC images and their AI-generated metadata.
The estimated time to complete this lab is: 75 minutes.
In this lab you will use an Azure Logic App to simulate a NYSE stream of stock purchase transactions. The logic app will then send the messages to Event Hubs. You will then use Stream Analytics to receive and process the stream and perform aggregations to calculate the number of transactions and amount traded in the last 10 seconds. Stream Analytics will send the results to a real-time dataset in Power BI.
The estimated time to complete this lab is: 45 minutes.


