Fairwinds' Polaris keeps your clusters sailing smoothly. It runs a variety of checks to ensure that Kubernetes pods and controllers are configured using best practices, helping you avoid problems in the future. Polaris can be run in a few different modes:
Polaris can be run in three different modes:
- As a dashboard, so you can audit what's running inside your cluster.
- As a validating webhook, so you can automatically reject workloads that don't adhere to your organization's policies.
- As a command-line tool, so you can test local YAML files, e.g. as part of a CI/CD process.
Want to learn more? Fairwinds holds office hours on Zoom the first Friday of every month, at 12pm Eastern. You can also reach out via email at [email protected]
kubectl apply -f https://github.com/FairwindsOps/polaris/releases/latest/download/dashboard.yaml
kubectl port-forward --namespace polaris svc/polaris-dashboard 8080:80
With the port forwarding in place, you can open http://localhost:8080 in your browser to view the dashboard.
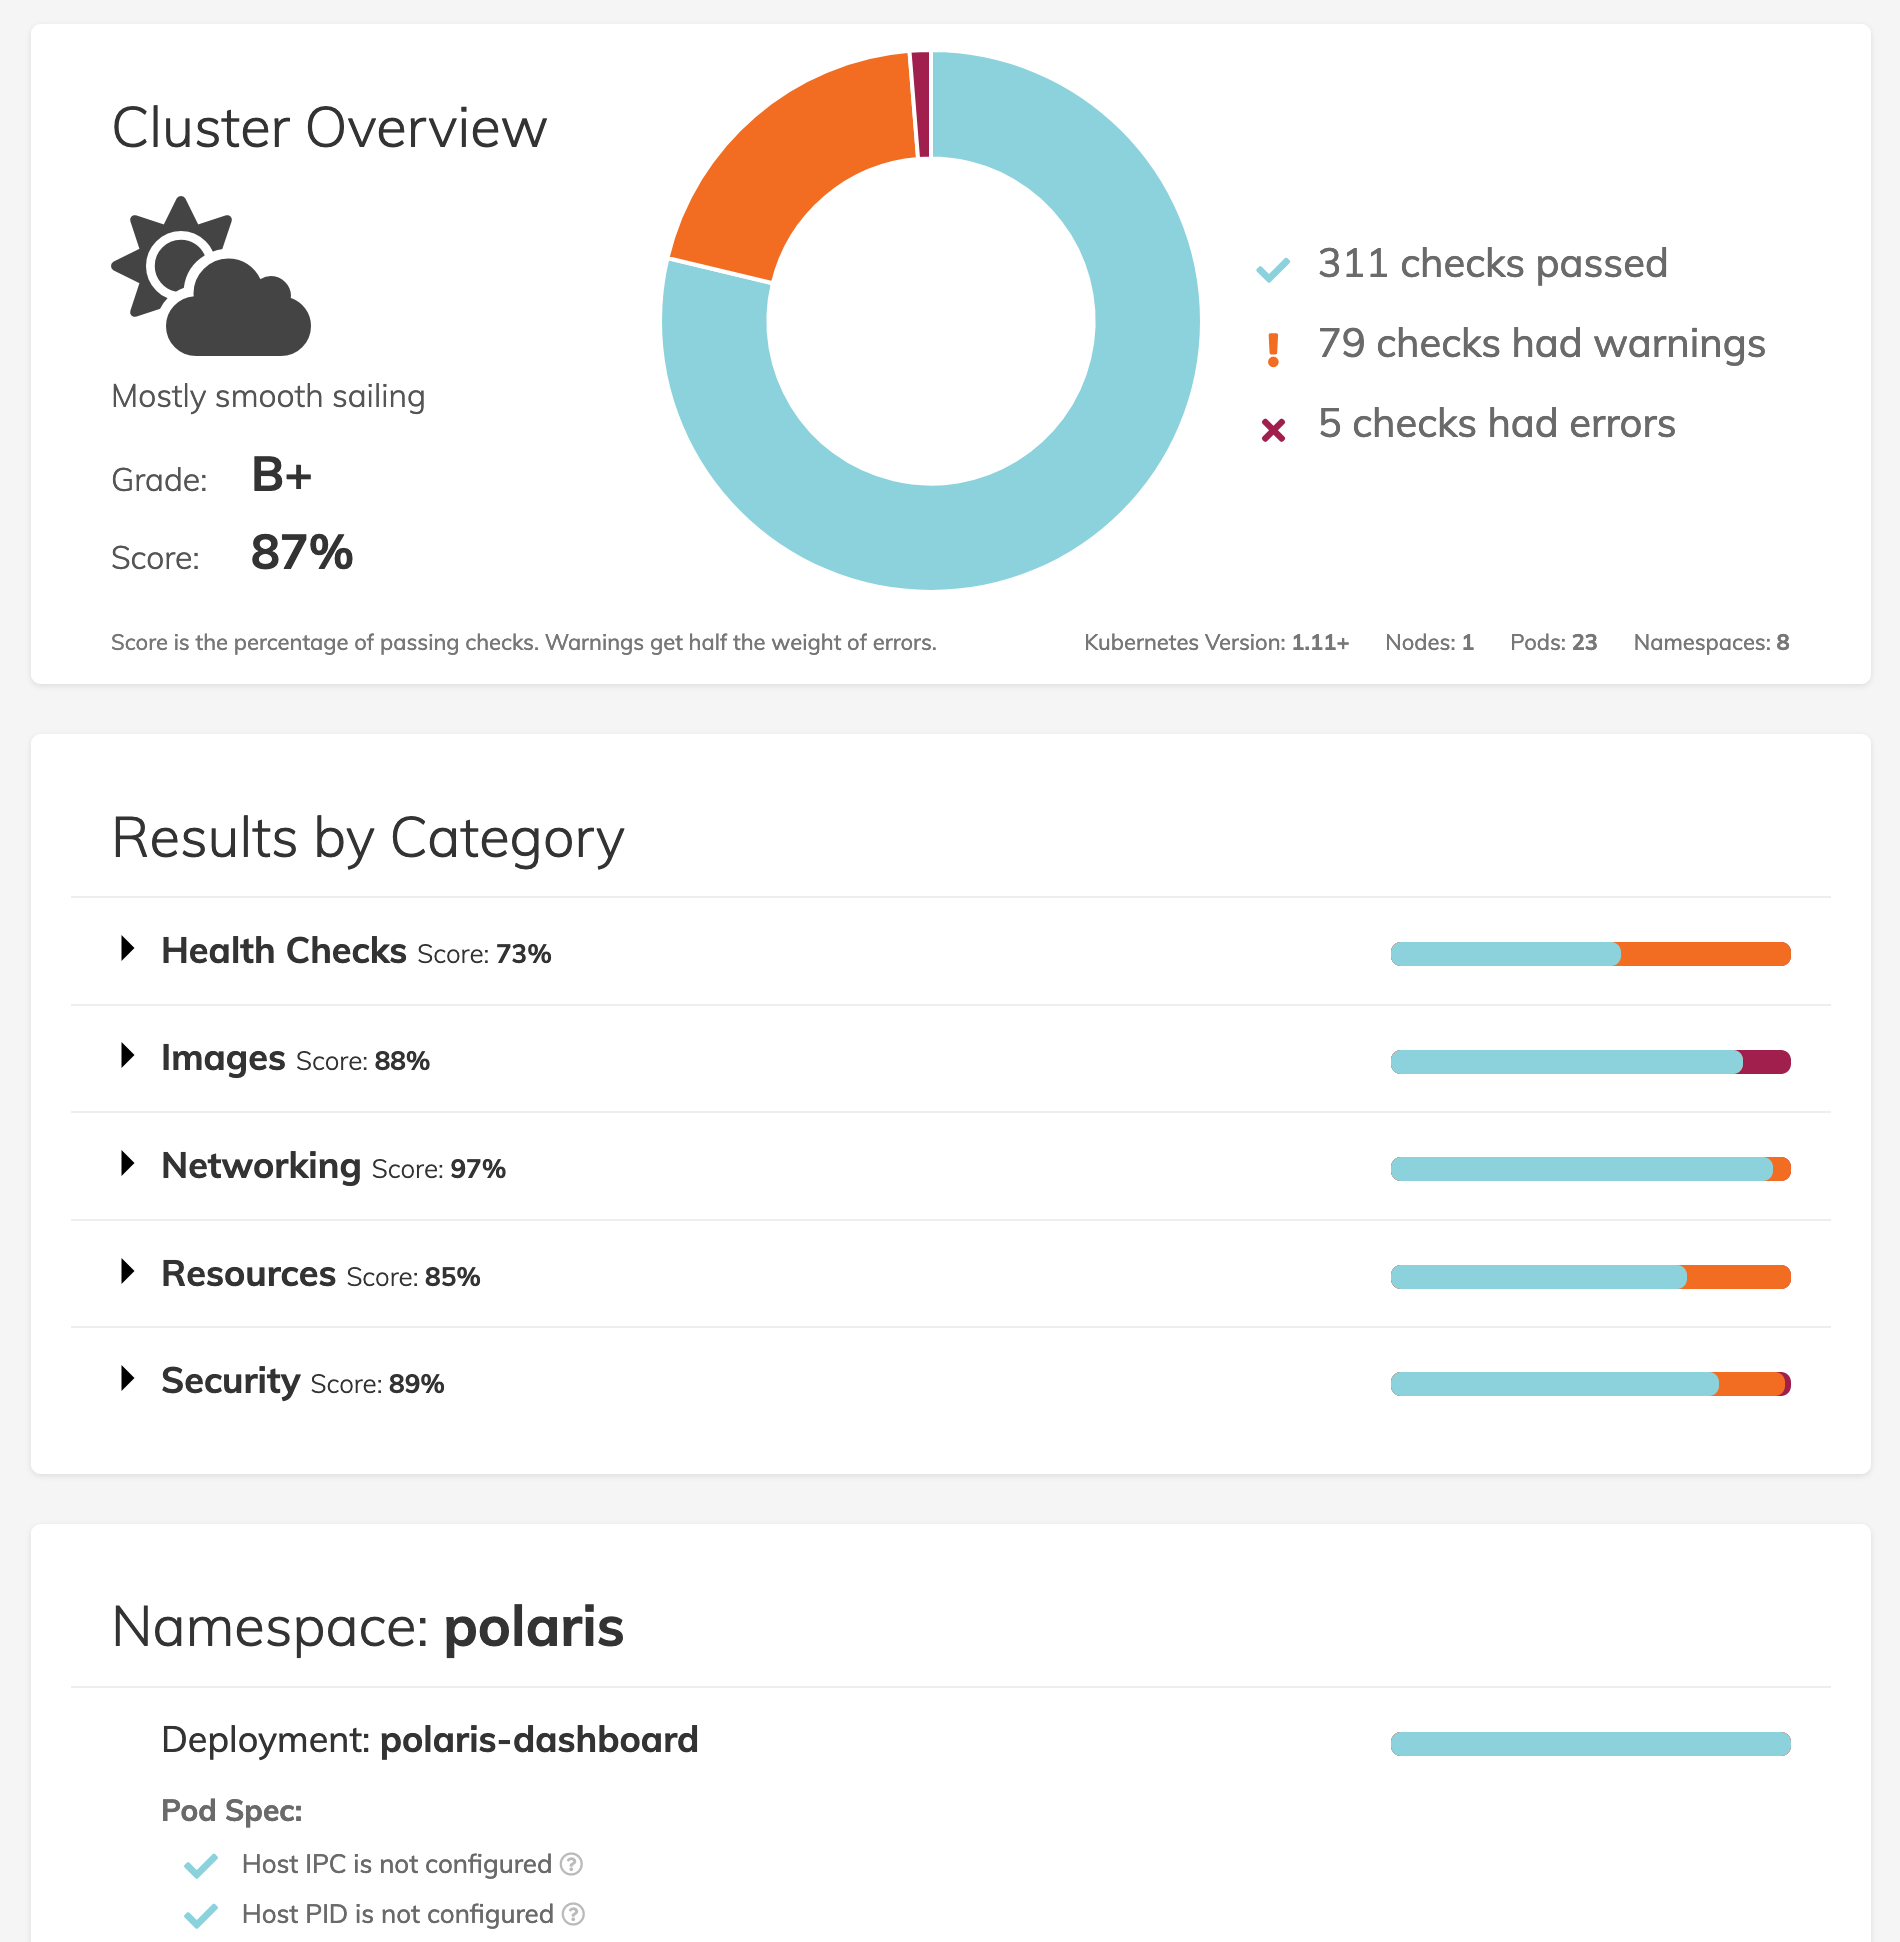
The Polaris dashboard is a way to get a simple visual overview of the current state of your Kubernetes workloads as well as a roadmap for what can be improved. The dashboard provides a cluster wide overview as well as breaking out results by category, namespace, and workload.
Our default standards in Polaris are rather high, so don’t be surprised if your score is lower than you might expect. A key goal for Polaris was to set a high standard and aim for great configuration by default. If the defaults we’ve included are too strict, it’s easy to adjust the configuration as part of the deployment configuration to better suit your workloads.
Polaris includes an optional validating webhook. This accepts the same configuration as the dashboard, and can run the same validations. This webhook will reject any workloads that trigger a validation error. This is indicative of the greater goal of Polaris, not just to encourage better configuration through dashboard visibility, but to actually enforce it with this webhook.
Unfortunately we have not found a way to display warnings as part of kubectl output unless we are rejecting a workload altogether. That means that any checks with a severity of warning will still pass webhook validation, and the only evidence of that warning will either be in the Polaris dashboard or the Polaris webhook logs.
Polaris can also be used on the command line, either to audit local files or a running cluster. This is particularly helpful for running Polaris against your infrastructure-as-code as part of a CI/CD pipeline. Use the available command line flags to cause CI/CD to fail if your Polaris score drops below a certain threshold, or if any errors arise.
See the Usage Guide for details on different methods for installing and using Polaris.
PRs welcome! Check out the Contributing Guidelines, Code of Conduct, and Roadmap for more information.
A history of changes to this project can be viewed in the Changelog
If you'd like to learn more about Polaris, or if you'd like to speak with
a Kubernetes expert, you can contact [email protected] or visit our website
Apache License 2.0


