This directory summarizes the different evaluation efforts to measure the performance of Knative using confidential containers, and place it in relation to well-known serverless benchmarks.
The evaluation of the project is divided in two parts:
- Performance Measurements - performance (overheads) of Knative on CoCo.
- Benchmarks - evaluating Knative + CoCo on standarised benchmarks.
In general, we compare Knative running on regular containers, on VMs (aka Knative + Kata) and with Knative + CoCo with different levels of security: (i) no attestaion, (ii) only guest FW attestation, (ii) image signature, and (iii) image signature + encryption.
In order to execute any of the performance measurement experiments, it is expected that you have a functional system as described in the Quick Start guide.
Then, start the KBS:
inv kbs.start

# If the KBS is already running, clear the DB contents
inv kbs.clear-db
you must also sign and encrypt all the images used in the performance tests. Signing and encryption is an interactive process, hence why we do it once, in advance of the evaluation:
# First encrypt (and sign) the image
inv skopeo.encrypt-container-image "ghcr.io/csegarragonz/coco-helloworld-py:unencrypted" --sign

# Then sign the unencrypted images used
inv cosign.sign-container-image "ghcr.io/csegarragonz/coco-helloworld-py:unencrypted"
inv cosign.sign-container-image "ghcr.io/csegarragonz/coco-knative-sidecar:unencrypted"
Now you are ready to run one of the experiments:
- Start-Up Costs - time required to spin-up a Knative service.
- Instantiation Throughput - throughput-latency of service instantiation.
- Memory Size - impact on initial VM memory size on start-up time.
This benchmark compares the time required to spin-up a pod as measured from Kubernetes. This is the higher-level (user-facing) measure we can take.
The benchmark must be run with debug logging disabled:
inv containerd.set-log-level info kata.set-log-level infoIn order to run the experiment, just run:
inv eval.startup.runyou may then plot the results by using:
inv eval.startup.plot
which generates a plot in ./plots/startup/startup.png. You can also see the plot below:
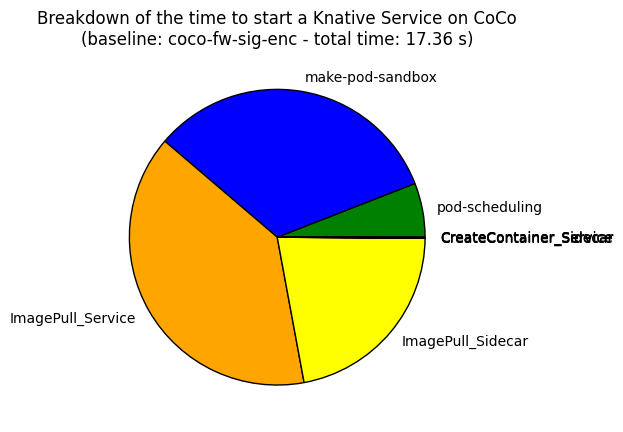
In addition, we also generate a breakdown pie chart for one of the runs in
./plots/sartup/breakdown.png:
In this experiment we measure the time it takes to spawn a fixed number of Knative services. Each service uses the same docker image, so it is a proxy measurement for scale-up/scale-down costs.
In more detail, we template N different service files, apply all of them,
and wait for all associated service pods to be in Ready state. We report the
time between we apply all files, and the last service pod is Ready.
To run the benchmark, you may run:
inv eval.xput.runwhich generates a plot in ./plots/xput/xput.png. You can also see the plot below:
This experiment explores the impact of the initial VM memory size on the Knative service start-up time.
By initial VM memory size we mean the memory size passed to QEMU with the -m
flag. This size can be configured through the Kata configuration file.
To run the experiment you may run:
inv eval.mem-size.runwhich generates a plot in ./plots/mem-size/mem_size.png. You can also see the plot below:
TODO


