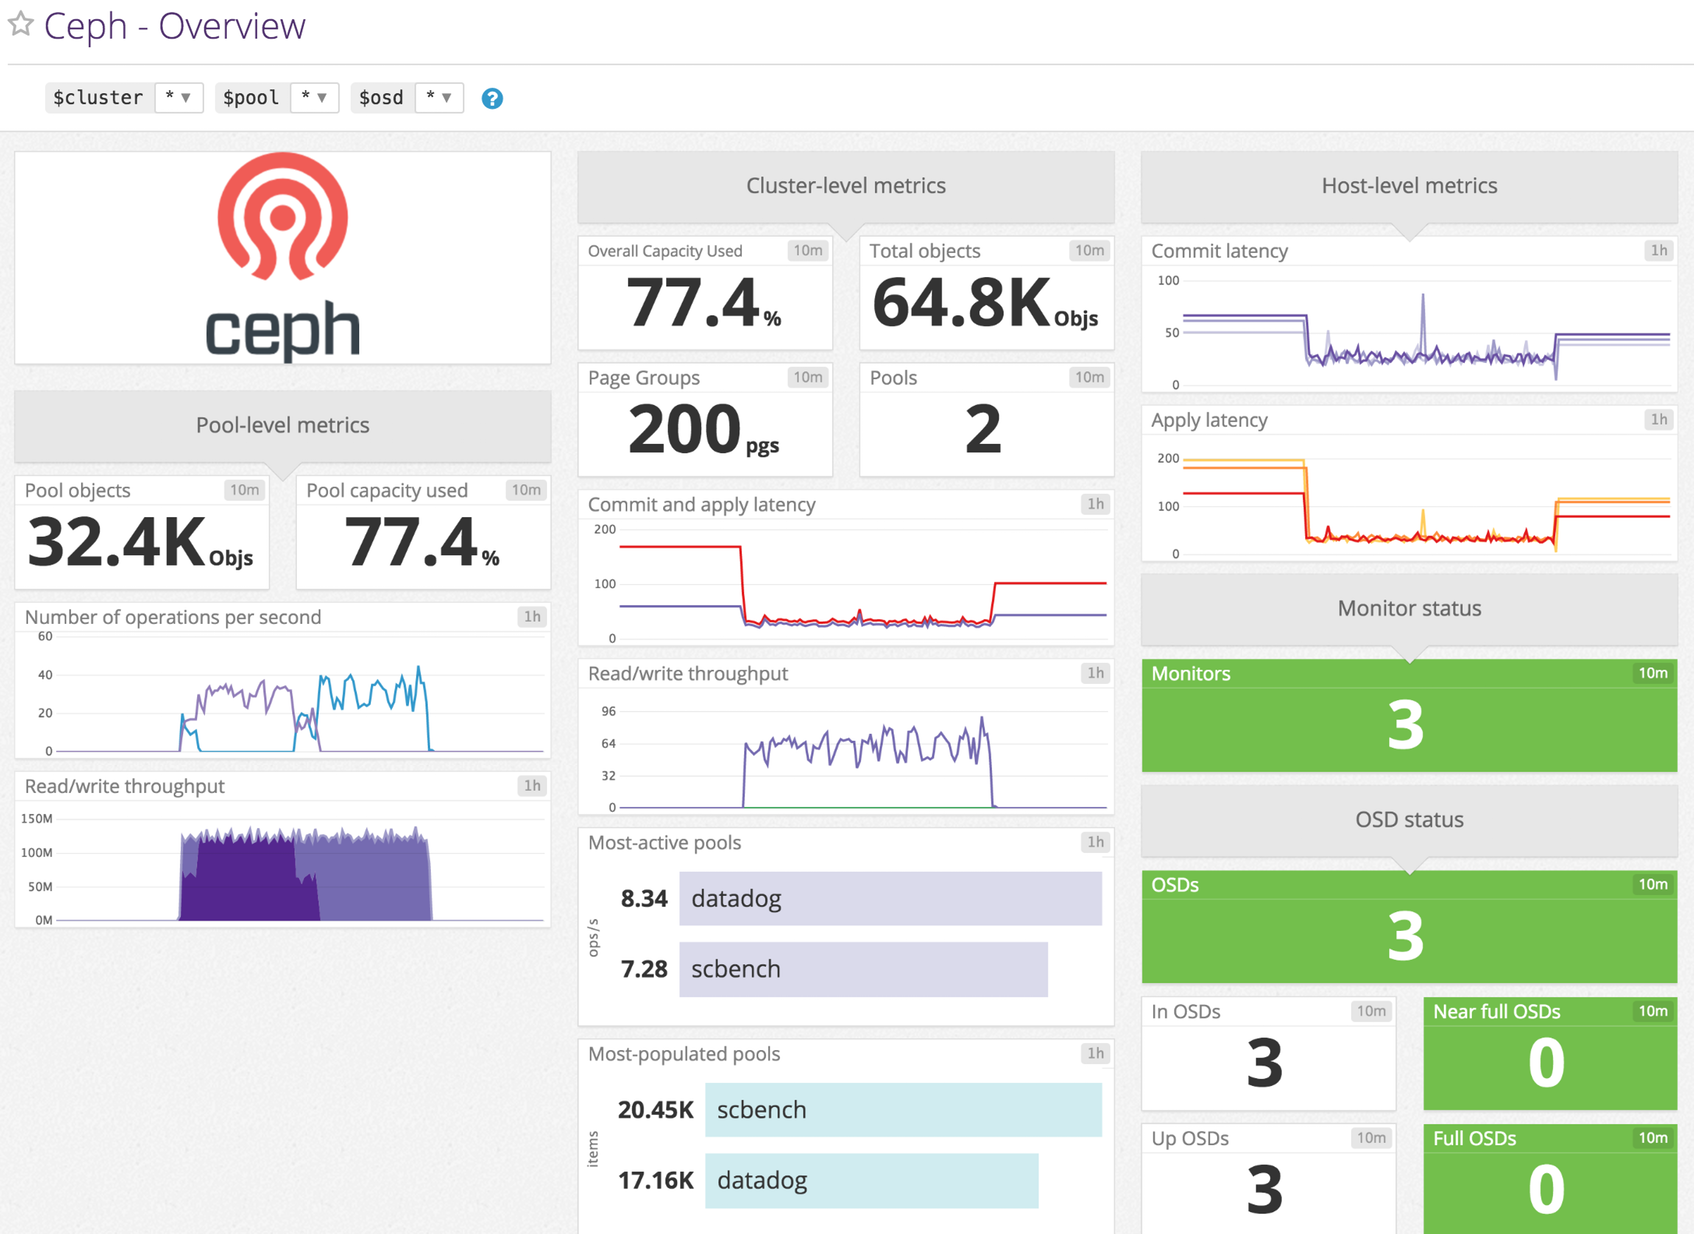
Enable the Datadog-Ceph integration to:
- Track disk usage across storage pools
- Receive service checks in case of issues
- Monitor I/O performance metrics
The Ceph check is included in the Datadog Agent package, so you don't need to install anything else on your Ceph servers.
Edit the file ceph.d/conf.yaml in the conf.d/ folder at the root of your Agent's configuration directory.
See the sample ceph.d/conf.yaml for all available configuration options:
init_config:

instances:
  - ceph_cmd: /path/to/your/ceph # default is /usr/bin/ceph
    use_sudo: true # only if the ceph binary needs sudo on your nodes
If you enabled use_sudo, add a line like the following to your sudoers file:
dd-agent ALL=(ALL) NOPASSWD:/path/to/your/ceph
Available for Agent versions >6.0
-
Collecting logs is disabled by default in the Datadog Agent, enable it in your
datadog.yamlfile:logs_enabled: true
-
Next, edit
ceph.d/conf.yamlby uncommenting thelogslines at the bottom. Update the logspathwith the correct path to your Ceph log files.logs: - type: file path: /var/log/ceph/*.log source: ceph service: "<APPLICATION_NAME>"
Run the Agent's status subcommand and look for ceph under the Checks section.
See metadata.csv for a list of metrics provided by this integration.
Note: If you are running Ceph luminous or later, the ceph.osd.pct_used metric is not included.
The Ceph check does not include any events.
See service_checks.json for a list of service checks provided by this integration.
Need help? Contact Datadog support.
