Setup a Kubernetes cluster using
k3drunning in GitHub Codespaces
This is a template that will setup a Kubernetes developer cluster using k3d in a GitHub Codespace or local Dev Container
We use this for inner-loop Kubernetes development. Note that it is not appropriate for production use but is a great Developer Experience. Feedback calls the approach game-changing - we hope you agree!
For ideas, feature requests, and discussions, please use GitHub discussions so we can collaborate and follow up.
This Codespace is tested with zsh and oh-my-zsh - it "should" work with bash but hasn't been fully tested. For the HoL, please use zsh to avoid any issues.
You can run the dev container locally and you can also connect to the Codespace with a local version of VS Code.
Please experiment and add any issues to the GitHub Discussion. We LOVE PRs!
The motivation for creating and using Codespaces is highlighted by this GitHub Blog Post. "It eliminated the fragility and single-track model of local development environments, but it also gave us a powerful new point of leverage for improving GitHub’s developer experience."
Cory Wilkerson, Senior Director of Engineering at GitHub, recorded a podcast where he shared the GitHub journey to Codespaces
You must be a member of the Microsoft OSS and CSE-Labs GitHub organizations
-
Instructions for joining the GitHub orgs are here
- If you don't see an
Open in Codespacesoption, you are not part of the organization(s)
- If you don't see an
-
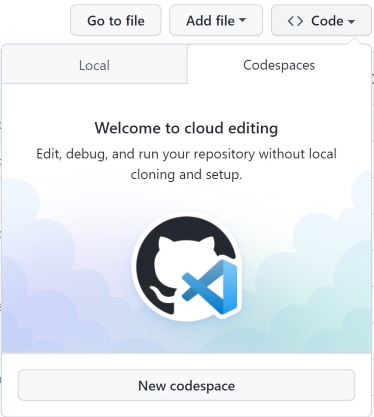
Click the
Codebutton on this repo -
Click the
Codespacestab -
Click
New Codespace -
Choose the
4 coreoption
Wait until the Codespace is ready before opening the workspace
- Once setup is complete, open the workspace
- Click the
hamburgermenu - Click
File - Click
Open Workspace from file - Click
workspaces - Click
cse-labs.code-workspace
- Click the
- Your screen will reload
- You may have to click on the terminal tab once Codespaces reloads
-
Codespaces will shutdown automatically after 30 minutes of non-use
-
To shutdown a codespace immediately
- Click
Codespacesin the lower left of the browser window - Choose
Stop Current Codespacefrom the context menu
- Click
-
You can also rebuild the container that is running your Codespace
- Any changes in
/workspaceswill be retained - Other directories will be reset
- Click
Codespacesin the lower left of the browser window - Choose
Rebuild Containerfrom the context menu - Confirm your choice
- Any changes in
-
To delete a Codespace
- https://github.com/codespaces
- Use the context menu to delete the Codespace
-
This will create a local Kubernetes cluster using k3d
- The cluster is running inside your Codespace
# build the cluster make all -
Output from
make allshould resemble thisdefault jumpbox 1/1 Running 0 25s default ngsa-memory 1/1 Running 0 33s default webv 1/1 Running 0 31s logging fluentbit 1/1 Running 0 31s monitoring grafana-64f7dbcf96-cfmtd 1/1 Running 0 32s monitoring prometheus-deployment-67cbf97f84-tjxm7 1/1 Running 0 32s
- If you get an error, just run the command again - it will clear once the services are ready
# check endpoints
make check
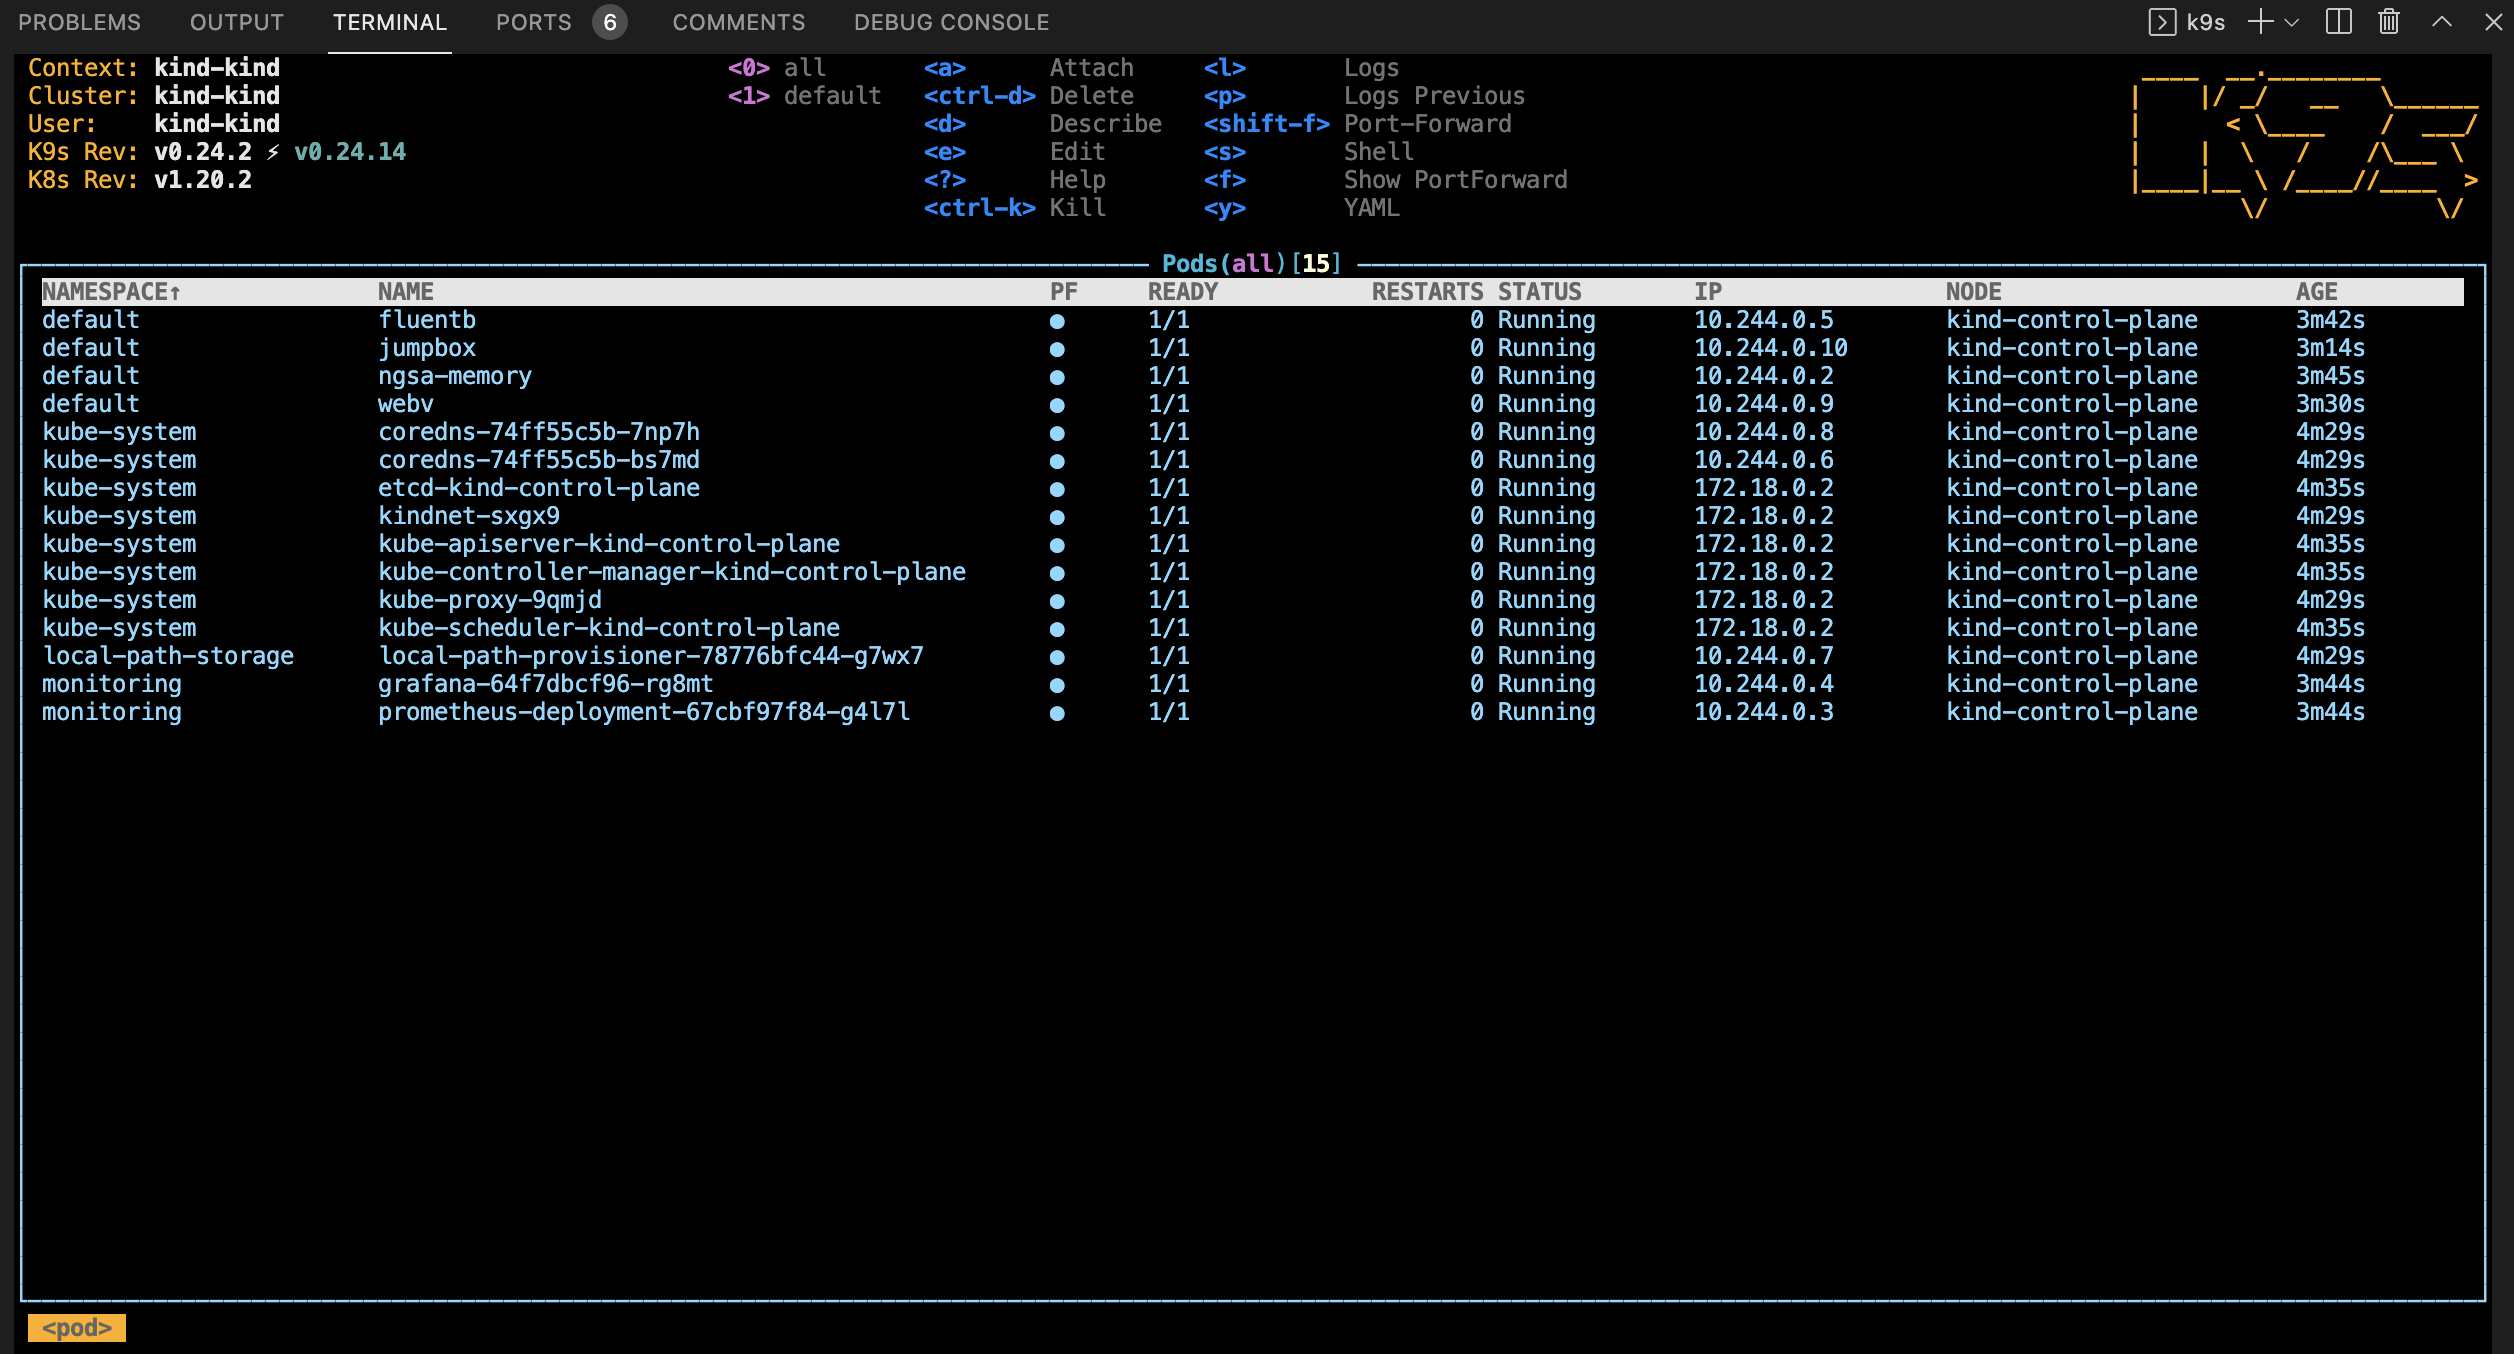
- From the Codespace terminal window, start
k9s- Type
k9sand press enter - Press
0to select all namespaces - Wait for all pods to be in the
Runningstate (look for theSTATUScolumn) - Use the arrow key to select
nsga-memorythen press thelkey to view logs from the pod - To go back, press the
esckey - Use the arrow key to select
jumpboxthen pressskey to open a shell in the container- Hit the
ngsa-memoryNodePort from within the cluster by executinghttp ngsa-memory:8080/version - Verify 200 status in the response
- To exit -
exit
- Hit the
- To view other deployed resources - press
shift + :followed by the deployment type (e.g.secret,services,deployment, etc). - To exit -
:q <enter>
- Type
Open curl.http
curl.http is used in conjuction with the Visual Studio Code REST Client extension.
When you open curl.http, you should see a clickable
Send Requesttext above each of the URLs
Clicking on Send Request should open a new panel in Visual Studio Code with the response from that request like so:
A jump box pod is created so that you can execute commands in the cluster
-
use the
kjaliaskubectl exec -it jumpbox -- bash -l- note: -l causes a login and processes
.profile - note:
sh -lwill work, but the results will not be displayed in the terminal due to a bug
- note: -l causes a login and processes
-
example
- run
kj- Your terminal prompt will change
- From the
jumpboxterminal - Run
http ngsa-memory:8080/version exitback to the Codespaces terminal
- run
-
use the
kjealiaskubectl exec -it jumpbox --
-
example
- run http against the ClusterIP
kje http ngsa-memory:8080/version
- run http against the ClusterIP
-
Since the jumpbox is running
inthe cluster, we use the service name and port, not the NodePort- A jumpbox is great for debugging network issues
-
Codespaces exposes
portsto the browser -
We take advantage of this by exposing
NodePorton most of our K8s services -
Codespaces ports are setup in the
.devcontainer/devcontainer.jsonfile -
Exposing the ports
// forward ports for the app
"forwardPorts": [
  30000,
  30080,
  30088,
  32000
],
-
Adding labels to the ports
// add labels
"portsAttributes": {
  "30000": { "label": "Prometheus" },
  "30080": { "label": "ngsa-app" },
  "30088": { "label": "WebV" },
  "32000": { "label": "Grafana" },
},
- Click on the
portstab of the terminal window - Click on the
open in browser iconon the ngsa-app port (30080) - This will open the ngsa-app home page (Swagger) in a new browser tab
- Click on the
portstab of the terminal window - Click on the
open in browser iconon the WebV port (30088) - This will open the Web Validate in a new browser tab
- Note that you will get a 404 as WebV does not have a home page
- Add
versionormetricsto the end of the URL in the browser tab
-
We have a local Docker container registry running in the Codespace
- Run
docker psto see the running images
- Run
-
Build the WebAPI app from the local source code
-
Push to the local Docker registry
-
Deploy to local k3d cluster
-
Switch back to your Codespaces tab
# from Codespaces terminal

# make and deploy a local version of ngsa-memory to k8s
make app

# check the app version
# the semver will have the current date and time
http localhost:30080/version
-
Click on the
portstab of the terminal window -
Click on the
open in browser iconon the Prometheus port (30000) -
This will open Prometheus in a new browser tab
-
From the Prometheus tab
- Begin typing
NgsaAppDuration_bucketin theExpressionsearch - Click
Execute - This will display the
histogramthat Grafana uses for the charts
- Begin typing
-
Grafana login info
- admin
- cse-labs
-
Click on the
portstab of the terminal window- Click on the
open in browser iconon the Grafana port (32000) - This will open Grafana in a new browser tab
- Click on the
# from Codespaces terminal

# run an integration test (will generate warnings in Grafana)
make test

# run a 60 second load test
make load-test
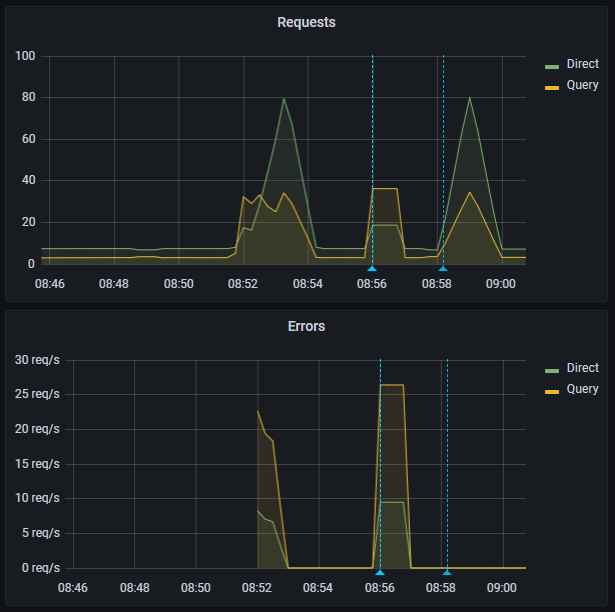
- Switch to the Grafana brower tab
- The integration test generates 400 and 404 results by design
- The requests metric will go from green to yellow to red as load increases
- It may skip yellow
- As the test completes
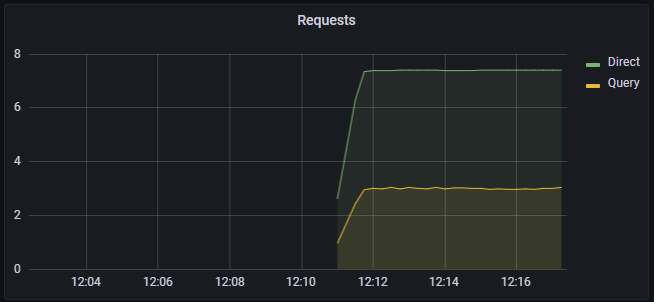
- The metric will go back to green (10 req/sec)
- The request graph will return to normal
Fluent Bit is set to forward logs to stdout for debugging
Fluent Bit can be configured to forward to different services including Azure Log Analytics
- Start
k9sfrom the Codespace terminal - Press
0to show allnamespaces - Select
fluentbitand pressenter - Press
enteragain to see the logs - Press
sto Toggle AutoScroll - Press
wto Toggle Wrap - Review logs that will be sent to Log Analytics when configured
- See
deploy/loganalyticsfor directions
- See
Codespaces extends the use of development containers by providing a remote hosting environment for them. A development container is a fully-featured development environment running in a container.
Developers can simply click on a button in GitHub to open a Codespace for the repo. Behind the scenes, GitHub Codespaces is:
- Spinning up a VM
- Shallow cloning the repo in that VM. The shallow clone pulls the
devcontainer.jsononto the VM - Spins up the development container on the VM
- Clones the repository in the development container
- Connects you to the remotely hosted development container via the browser or Visual Studio Code
.devcontainer folder contains the following:
-
devcontainer.json: This configuration file determines the environment of every new codespace anyone creates for repository by defining a development container that can include frameworks, tools, extensions, and port forwarding. It exists either at the root of the project or under a .devcontainer folder at the root. For information about the settings and properties that you can set in a devcontainer.json, see devcontainer.json reference in the Visual Studio Code documentation. -
Dockerfile: Dockerfile in.devcontainerdefines a container image and installs software. You can use an existing base image by dasignating it toFROMinstruction. For more information on using a Dockerfile in a dev container, see Create a development container in the Visual Studio Code documentation. -
Bash scripts: These scripts have to be placed under a.devcontainerfolder at the root. They are the hooks that allow you to run commands at different points in the development container lifecycle which include:- onCreateCommand - Run when creating the container
- postCreateCommand - Run inside the container after it is created
- postStartCommand - Run every time the container starts
For more information on using LifyCycle scripts, see Codespaces lifecycle scripts.
Note: Provide executable permissions to scripts using:
chmod+ x.
Makefile is a good place to start exploring
We use the makefile to encapsulate and document common tasks
- Why don't we use helm to deploy Kubernetes manifests?
- The target audience for this repository is app developers so we chose simplicity for the Developer Experience.
- In our daily work, we use Helm for deployments and it is installed in the
Codespaceshould you want to use it.
- Why
k3dinstead ofKind?- We love kind! Most of our code will run unchanged in kind (except the cluster commands)
- We had to choose one or the other as we don't have the resources to validate both
- We chose k3d for these main reasons
- Smaller memory footprint
- Faster startup time
- Secure by default
- K3s supports the CIS Kubernetes Benchmark
- Based on K3s which is a certified Kubernetes distro
- Many customers run K3s on the edge as well as in CI-CD pipelines
- Rancher provides support - including 24x7 (for a fee)
- K3s has a vibrant community
- K3s is a CNCF sandbox project
- Team Working Agreement
- Team Engineering Practices
- CSE Engineering Fundamentals Playbook
This project uses GitHub Issues to track bugs and feature requests. Please search the existing issues before filing new issues to avoid duplicates. For new issues, file your bug or feature request as a new issue.
For help and questions about using this project, please open a GitHub issue.
This project welcomes contributions and suggestions. Most contributions require you to agree to a Contributor License Agreement (CLA) declaring that you have the right to, and actually do, grant us the rights to use your contribution. For details, visit https://cla.opensource.microsoft.com
When you submit a pull request, a CLA bot will automatically determine whether you need to provide a CLA and decorate the PR appropriately (e.g., status check, comment). Simply follow the instructions provided by the bot. You will only need to do this once across all repos using our CLA.
This project has adopted the Microsoft Open Source Code of Conduct. For more information see the Code of Conduct FAQ or contact [email protected] with any additional questions or comments.
This project may contain trademarks or logos for projects, products, or services.
Authorized use of Microsoft trademarks or logos is subject to and must follow Microsoft's Trademark & Brand Guidelines.
Use of Microsoft trademarks or logos in modified versions of this project must not cause confusion or imply Microsoft sponsorship.
Any use of third-party trademarks or logos are subject to those third-party's policies.


